. 2022 Feb 4;25(3):103871.
doi: 10.1016/j.isci.2022.103871. eCollection 2022 Mar 18.

Sebocytes contribute to melasma onset

Affiliations

Sebocytes contribute to melasma onset

Enrica Flori et al. iScience. .

Abstract

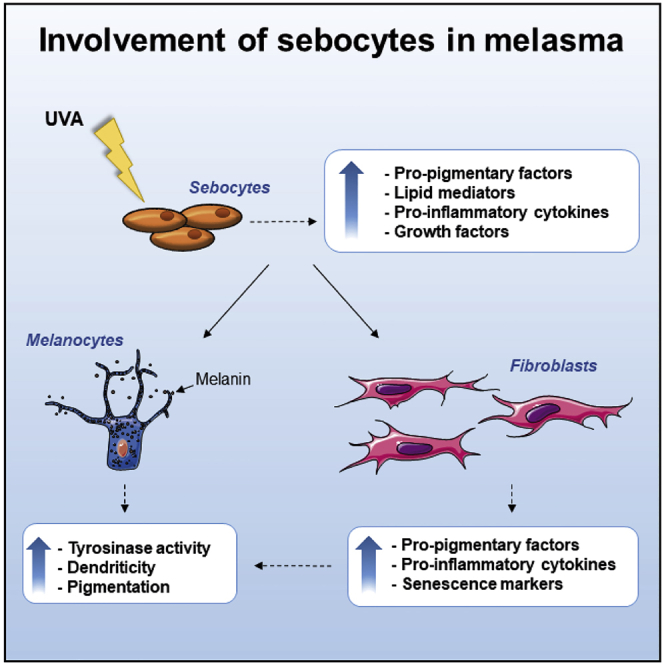
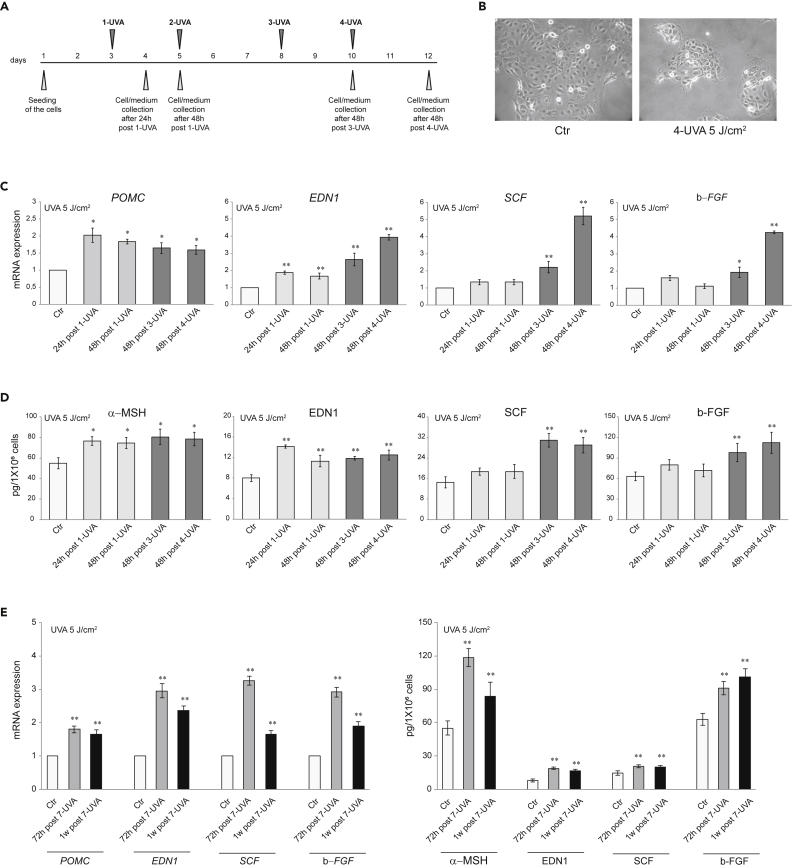
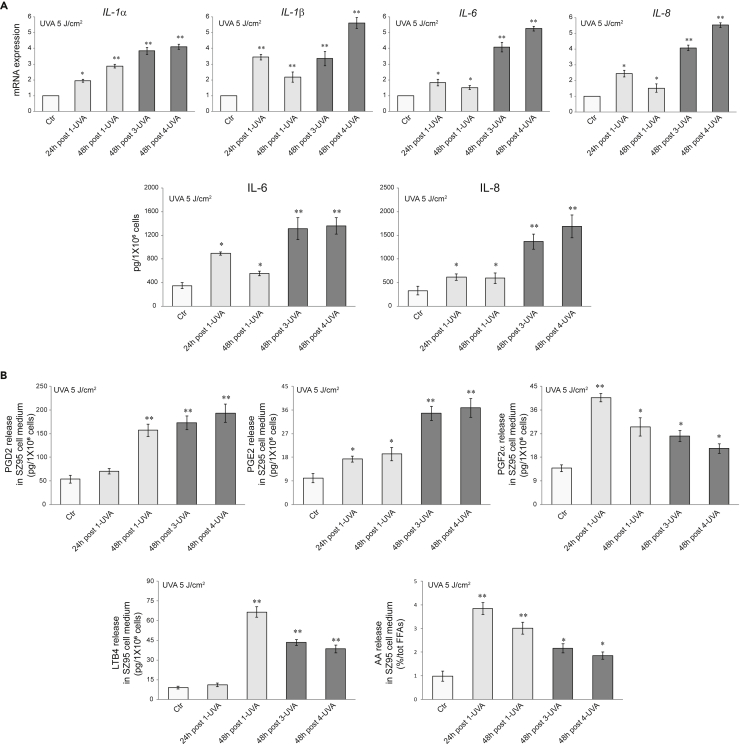
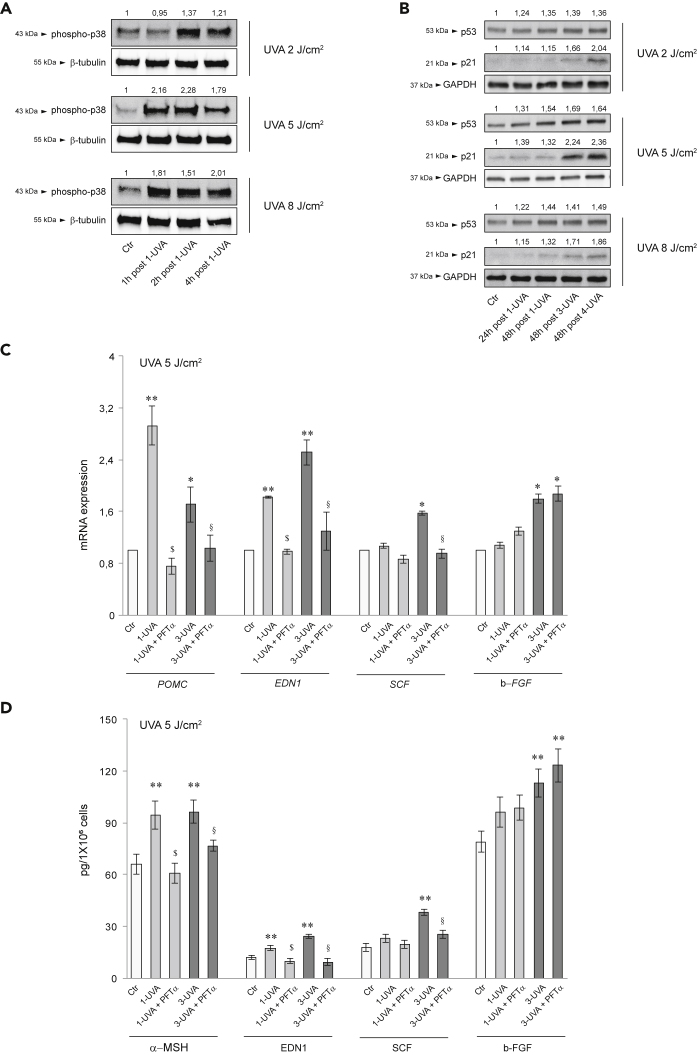
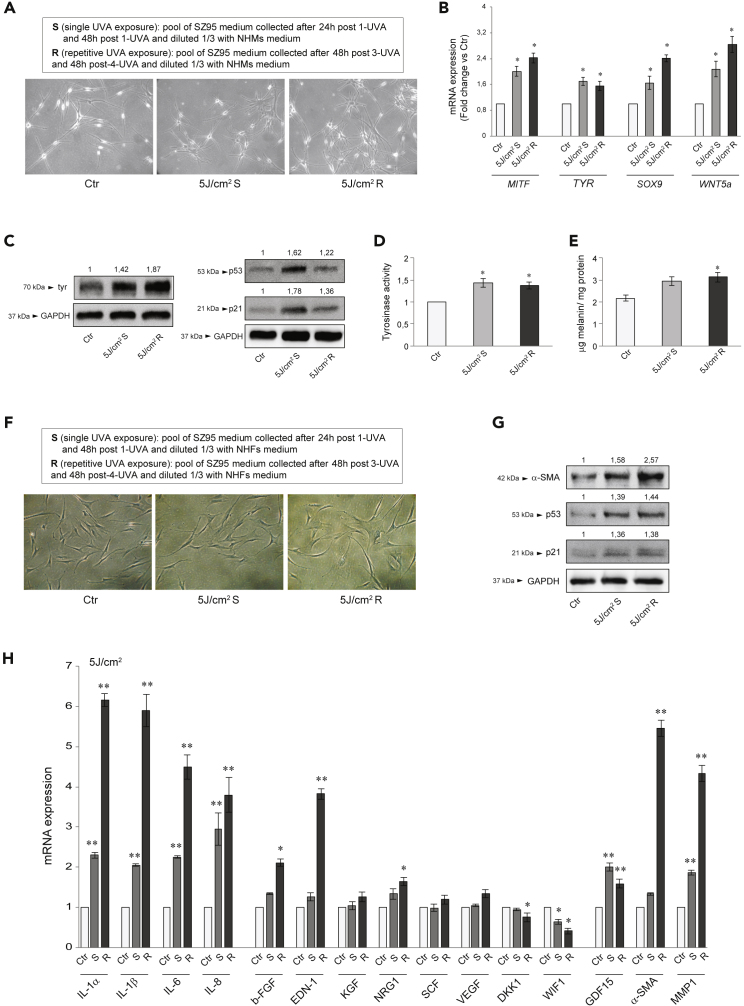
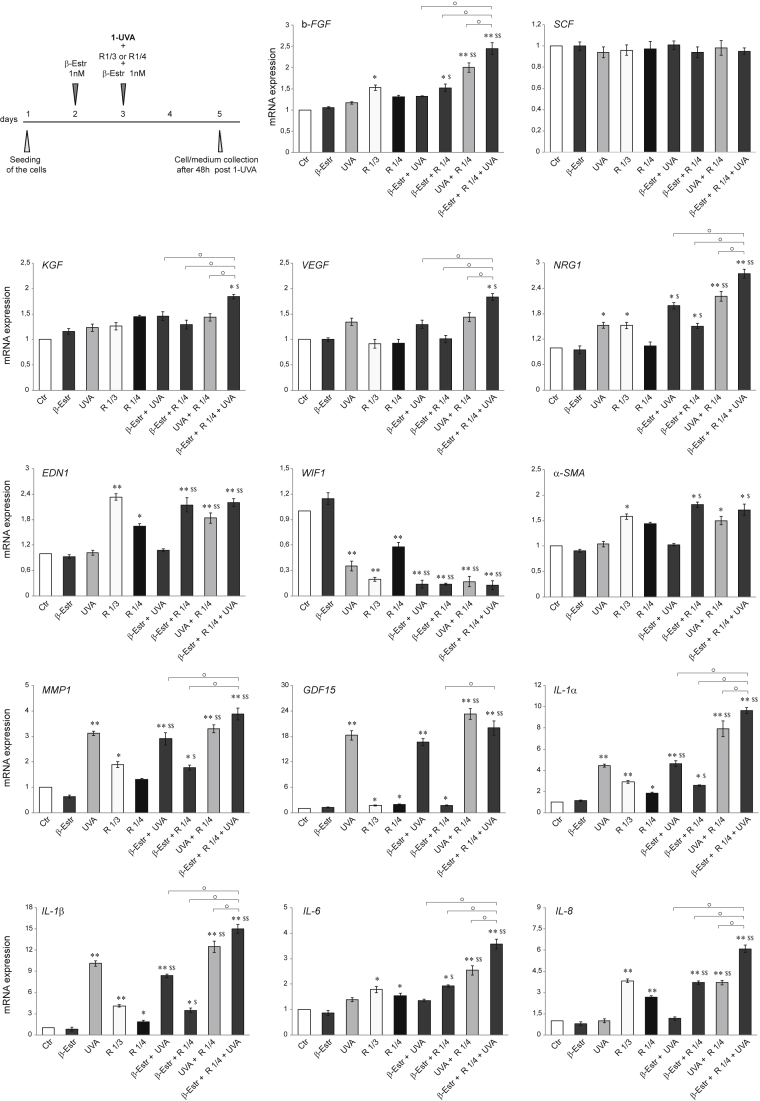
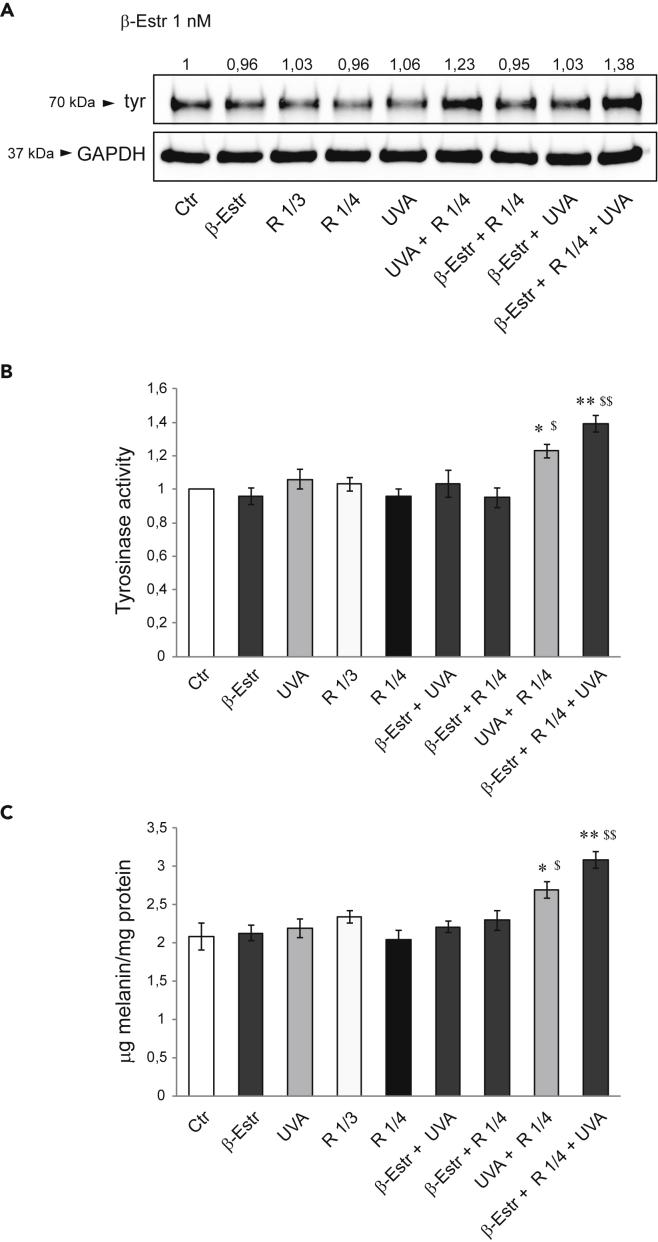
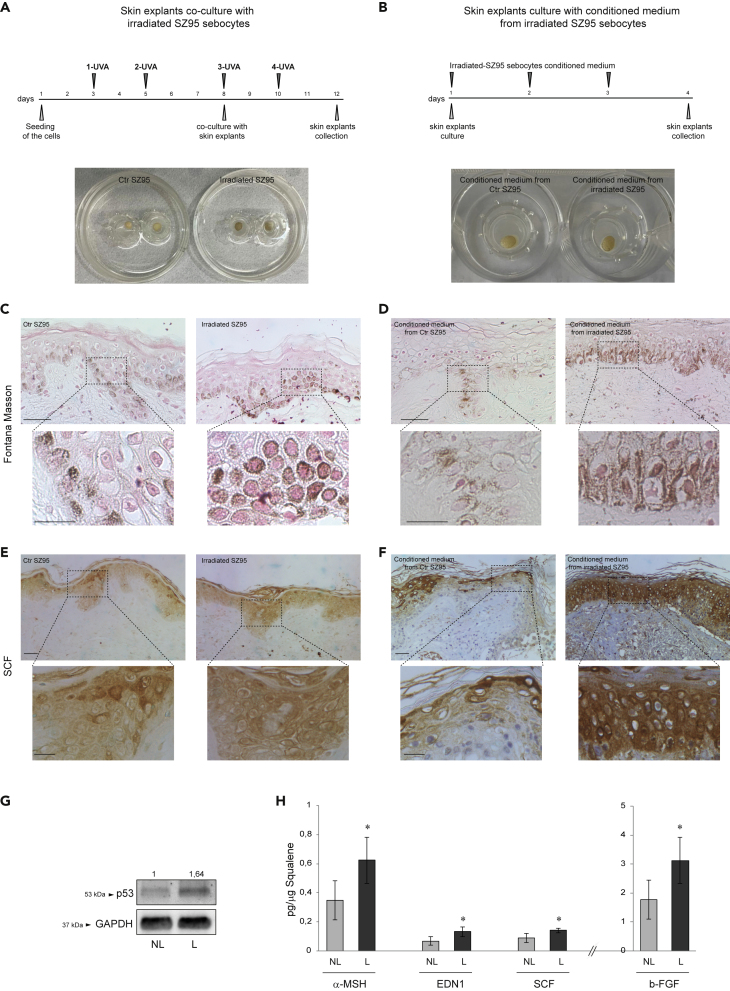
Melasma is a hyperpigmentary disorder with photoaging features, whose manifestations appear on specific face areas, rich in sebaceous glands (SGs). To explore the SGs possible contribution to the onset, the expression of pro-melanogenic and inflammatory factors from the SZ95 SG cell line exposed to single or repetitive ultraviolet (UVA) radiation was evaluated. UVA up-modulated the long-lasting production of α-MSH, EDN1, b-FGF, SCF, inflammatory cytokines and mediators. Irradiated SZ95 sebocyte conditioned media increased pigmentation in melanocytes and the expression of senescence markers, pro-inflammatory cytokines, and growth factors regulating melanogenesis in fibroblasts cultures. Cocultures experiments with skin explants confirmed the role of sebocytes on melanogenesis promotion. The analysis on sebum collected from melasma patients demonstrated that in vivo sebocytes from lesional areas express the UVA-activated pathways markers observed in vitro. Our results indicate sebocytes as one of the actors in melasma pathogenesis, inducing prolonged skin cell stimulation, contributing to localized dermal aging and hyperpigmentation.

Keywords: Biochemistry; Biological sciences; Molecular biology.


Conflict of interest statement

The authors declare no competing interests

Figures

None
Graphical abstract
Figure 1
Figure 1
Effect of UVA irradiation on growth factors release in SZ95 sebocytes (A) Experimental scheme of UVA irradiation of SZ95 sebocytes. (B) Phase-contrast analysis of SZ95 sebocytes after 4-UVA 5 J/cm2 irradiations. (C) The mRNA expression levels of POMC, EDN1, SCF, and b-FGF in SZ95 sebocytes after 24 and 48h post 1-UVA and 48h post three or 4-UVA 5 J/cm2 irradiations. Results are presented as the mean ± SD of three independent experiments and are expressed as the fold change respect to untreated control cells (∗p < 0.05, ∗∗p < 0.01). (D) Protein quantitation by ELISA of α-MSH, EDN1, SCF, and b-FGF in SZ95 sebocytes after 24 and 48h post 1-UVA and 48h post three or 4-UVA 5 J/cm2 irradiations. Results are presented as the mean ± SD of three independent experiments and are expressed in absolute quantities (∗p < 0.05, ∗∗p < 0.01 vs Ctr). (E) The mRNA expression levels and protein quantitation by ELISA of POMC/α-MSH, EDN1, SCF, and b-FGF in SZ95 sebocytes after 72h or 1 week post 7-UVA 5 J/cm2 irradiations. Data represent the mean ± SD of three independent experiments. For mRNA levels, results are expressed as the fold change respect to untreated control cells (∗∗p < 0.01). For ELISA assay, results are expressed in the absolute quantities (∗∗p < 0.01 vs Ctr).
Figure 2
Figure 2
Effect of UVA irradiation on inflammatory mediators release in SZ95 sebocytes (A) The mRNA expression levels of IL-1α, IL-1β, IL-6, IL-8, and protein quantitation by ELISA of IL-6 and IL-8 in SZ95 sebocytes after 24 and 48h post 1-UVA and 48h post three or 4-UVA 5 J/cm2 irradiations. For mRNA levels, results are expressed as the fold change respect to untreated control cells (∗p < 0.05, ∗∗p < 0.01). For ELISA assay, results are expressed in absolute quantities (∗p < 0.05, ∗∗p < 0.01 vs Ctr). (B) PGD2, PGE2, PGF2α, LTB4, and AA quantitation by HPLC-MS/MS in SZ95 sebocytes after 24 and 48h post 1-UVA and 48h post three or 4-UVA 5 J/cm2 irradiations. Results are expressed in absolute quantities (∗p < 0.05, ∗∗p < 0.01 vs Ctr). Data represent the mean ± SD of three independent experiments.
Figure 3
Figure 3
Effect of UVA irradiation on p38MAP kinase and p53 signaling in SZ95 sebocytes (A) Western blot analysis of phospho-p38 protein expression in SZ95 sebocytes after 1-2-4h post irradiation with UVA 2-5-8 J/cm2 β-tubulin was used as an equal loading control. Representative blots are shown. Densitometric scanning of band intensities was performed to quantify the change of protein expression (control value taken as 1-fold in each case). (B) Western blot analysis of p53 and p21 protein expression in SZ95 sebocytes after 24 and 48h post 1-UVA and 48h post three or 4-UVA 2-5-8 J/cm2. GAPDH was used as an equal loading control. Representative blots are shown. Densitometric scanning of band intensities was performed to quantify the change of protein expression (control value taken as 1-fold in each case). (C) The mRNA expression levels of POMC, EDN1, SCF, and b-FGF in SZ95 sebocytes after 48h of treatment with PFTα 5 μM and one or 3-UVA 5 J/cm2 irradiations. Results are presented as the mean ± SD of three independent experiments and are expressed as the fold change respect to untreated control cells (∗p < 0.05, ∗∗p < 0.01 vs Ctr; $p < 0.05 vs 1-UVA irradiated cells; §p < 0.05 vs 3-UVA irradiated cells). (D) Protein quantitation by ELISA of αMSH, EDN1, SCF, and b-FGF in SZ95 sebocytes after 48h of treatment with PFTα 5 μM and one or 3-UVA 5 J/cm2 irradiations. Results are presented as the mean ± SD of three independent experiments and are expressed in absolute quantities (∗∗p < 0.01 vs Ctr; $p < 0.05 vs 1-UVA irradiated cells; §p < 0.05 vs 3-UVA irradiated cells).
Figure 4
Figure 4
Influences of irradiated SZ95 conditioned medium on NHMs melanogenesis and NHFs phenotype (A) Experimental SZ95 pool medium description and phase-contrast analysis of NHMs treated with S or R UVA 5 J/cm2 for 5 days. (B) The mRNA expression levels of MITF, TYR, SOX9, and WNT5a in NHMs after addition with S or R UVA 5 J/cm2 for 48h. Results are presented as the mean ± SD of three independent experiments and are expressed as the fold change respect to untreated control cells (∗p < 0.05 vs Ctr). (C) Western blot analysis of tyr, p53, and p21 protein expression in NHMs after addition with S or R UVA 5 J/cm2 for 72h. GAPDH was used as an equal loading control. Representative blots are shown. Densitometric scanning of band intensities was performed to quantify the change of protein expression (control value taken as 1-fold in each case). (D) Analysis of tyrosinase activity on NHMs after addition with S or R UVA 5 J/cm2 for 4 days. Results are presented as the mean ± SD of three independent experiments and are expressed as the fold change respect to untreated control cells (∗p < 0.05). (E) Melanin content evaluation in NHMs after addition with S or R UVA 5 J/cm2 for 5 days. Results are presented as the mean ± SD of three independent experiments and are expressed as ratio of μg melanin/mg protein (∗p < 0.05 versus Ctr). (F) Experimental SZ95 pool medium description and phase-contrast analysis of NHFs added with S or R UVA 5 J/cm2 for 4 days. (G) Western blot analysis of α-SMA, p53, and p21 protein expression in NHFs after addition with S or R UVA 5 J/cm2 for 4 days. GAPDH was used as an equal loading control. Representative blots are shown. Densitometric scanning of band intensities was performed to quantify the change of protein expression (control value taken as 1-fold in each case). (H) The mRNA expression levels of IL-1α, IL-1β, IL-6, IL-8, b-FGF, EDN1, KGF, NRG1, SCF, VEGF, DKK1, WIF1, GDF15, α-SMA, and MMP1 in NHFs after addition with S or R UVA 5 J/cm2 for 48h. Results are presented as the mean ± SD of three independent experiments and are expressed as the fold change respect to untreated control cells (∗p < 0.05, ∗∗p < 0.01 vs Ctr).
Figure 5
Figure 5
Synergistic effect of UVA irradiation, 17β-estradiol treatment, and exposure to SZ95 conditioned medium on NHFs. Experimental scheme of 1 nM β-estradiol treatment, exposure to SZ95 conditioned medium, and UVA irradiation of NHFs (see Table 2 for treatments) The mRNA expression levels of b-FGF, SCF, KGF, VEGF, NRG1, EDN1, WIF1, α-SMA, MMP1, GDF15, IL-1α, IL-1β, L-6, and IL-8 in NHFs after treatments. Results are presented as the mean ± SD of three independent experiments and are expressed as the fold change respect to untreated control cells (∗p < 0.05, ∗∗p < 0.01 vs Ctr; $p < 0.05, $$p < 0.01 vs R 1/4; °p < 0.05 vs other treatments).
Figure 6
Figure 6
Effects of NHFs conditioned medium on NHMs melanogenesis (A) Western blot analysis of tyrosinase protein expression in NHMs after treatments with NHFs medium (see Table 3 for treatments). GAPDH was used as an equal loading control. Representative blots are shown. Densitometric scanning of band intensities was performed to quantify the change of protein expression (control value taken as 1-fold in each case). (B) Analysis of tyrosinase activity on NHMs after treatments. Results are presented as the mean ± SD of three independent experiments and are expressed as the fold change respect to untreated control cells (∗p < 0.05, ∗∗p < 0.01) and R 1/4 ($p < 0.05, $$p < 0.01), respectively. (C) Melanin content evaluation in NHMs after treatments. Results are presented as the mean ± SD of three independent experiments and are expressed as ratio of μg melanin/mg protein (∗p < 0.05, ∗∗p < 0.01 versus Ctr; $p < 0.05, $$p < 0.01 versus R 1/4).
Figure 7
Figure 7
Melanogenesis promotion and growth factors induction in ex vivo and in vivo systems (A) Experimental schemes and macroscopic visualization of ex vivo skin explants coculture with UVA irradiated SZ95 sebocytes. (B) Experimental schemes and macroscopic visualization of ex vivo skin explants cultured with conditioned medium from irradiated SZ95 sebocytes. (C and D) Pigmentation of ex vivo skin explants visualized by Fontana-Masson staining. Scale bars: 50 and 20 μM for low and high magnification, respectively. (E and F) Immunohistochemical analysis of SCF expression. Scale bars: 50 and 20 μM for low and high magnification, respectively. (G) Immunohistochemical analysis of SCF expression in the sebaceous glands of ex vivo skin explants stimulated with conditioned medium from control and irradiated SZ95 sebocytes. Scale bars: 50 μM (H) Western blot analysis of p53 protein expression on sebutape from lesional (L) or non-lesional (NL) melasma skin. GAPDH was used as an equal loading control. Representative blots are shown. Densitometric scanning of band intensities was performed to quantify the change of protein expression (NL control value taken as 1-fold in each case). (I) Protein quantitation by ELISA of α-MSH, EDN1, SCF, and b-FGF in sebum samples. Results are presented as the mean ± SD and are expressed in absolute quantities (∗p < 0.05 vs Ctr).

References

    1. Abdel-Naser M.B., Seltmann H., Zouboulis C.C. SZ95 sebocytes induce epidermal melanocyte dendricity and proliferation in vitro. Exp. Dermatol. 2012;21:393–395. - PubMed
    1. Afaq F., Katiyar S.K. Polyphenols: skin photoprotection and inhibition of photocarcinogenesis. Mini Rev. Med. Chem. 2011;11:1200–1215. - PMC - PubMed
    1. Atef A., El-Rashidy M.A., Abdel Azeem A., Kabel A.M. The role of stem cell factor in hyperpigmented skin lesions. Asian Pac. J. Cancer Prev. 2019;20:3723–3728. - PMC - PubMed
    1. Bak H., Lee H.J., Chang S.E., Choi J.H., Kim M.N., Kim B.J. Increased expression of nerve growth factor receptor and neural endopeptidase in the lesional skin of melasma. Dermatol. Surg. 2009;35:1244–1250. - PubMed
    1. Barker N. The canonical Wnt/beta-catenin signalling pathway. Methods Mol. Biol. 2008;468:5–15. - PubMed