

CDK7/12/13 inhibition targets an oscillating leukemia stem cell network and synergizes with venetoclax in acute myeloid leukemia
- PMID: 35253392
- PMCID: PMC8988201
- DOI: 10.15252/emmm.202114990
CDK7/12/13 inhibition targets an oscillating leukemia stem cell network and synergizes with venetoclax in acute myeloid leukemia
Abstract
The heterogeneous response of acute myeloid leukemia (AML) to current anti-leukemic therapies is only partially explained by mutational heterogeneity. We previously identified GPR56 as a surface marker associated with poor outcome across genetic groups, which characterizes two leukemia stem cell (LSC)-enriched compartments with different self-renewal capacities. How these compartments self-renew remained unclear. Here, we show that GPR56+ LSC compartments are promoted in a complex network involving epithelial-to-mesenchymal transition (EMT) regulators besides Rho, Wnt, and Hedgehog (Hh) signaling. Unexpectedly, Wnt pathway inhibition increased the more immature, slowly cycling GPR56+ CD34+ fraction and Hh/EMT gene expression, while Wnt activation caused opposite effects. Our data suggest that the crucial role of GPR56 lies in its ability to co-activate these opposing signals, thus ensuring the constant supply of both LSC subsets. We show that CDK7 inhibitors suppress both LSC-enriched subsets in vivo and synergize with the Bcl-2 inhibitor venetoclax. Our data establish reciprocal transition between LSC compartments as a novel concept underlying the poor outcome in GPR56high AML and propose combined CDK7 and Bcl-2 inhibition as LSC-directed therapy in this disease.
Keywords: AML; CDK7 inhibition; GPR56; leukemia stem cell; self-renewal.
©2022 The Authors. Published under the terms of the CC BY 4.0 license.
Figures
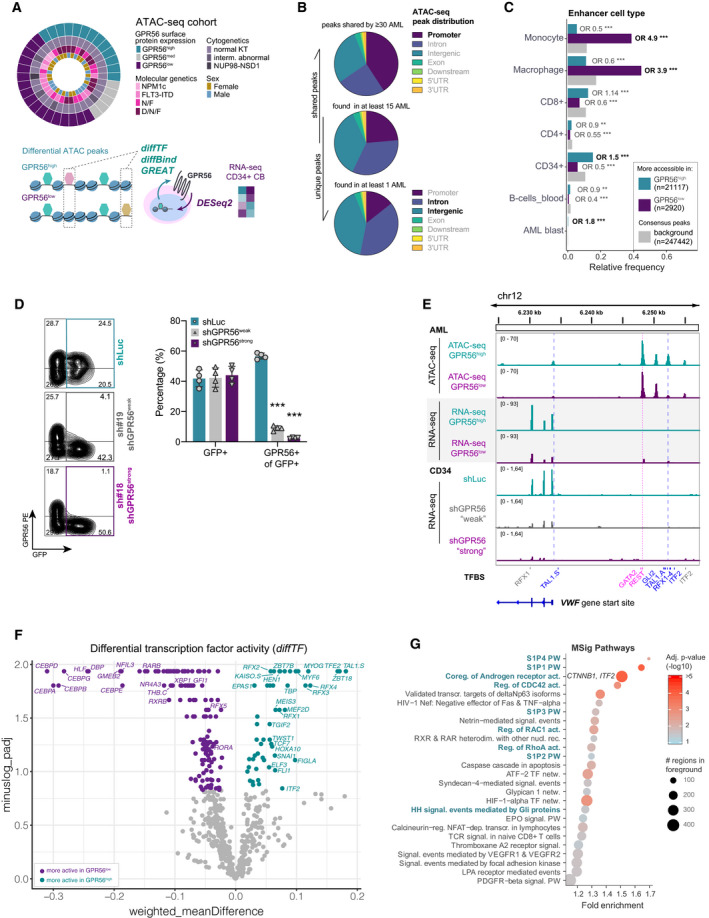
Overview of the experimental and analytical setup. ATAC‐seq was performed on 35 AML samples comprising the mutational groups N: NPM1 mutated, F: FLT3‐ITD, N/F: NPM1/FLT3‐ITD, D/N/F: DNMT3A/NPM1/FLT3‐ITD. Indicated colors represent GPR56 protein expression grouped into high (> 70% GPR56+ cells per sample, n = 13), medium (30%–70% GPR56+, n = 5), and low (< 30% GPR56+, n = 17), cytogenetic and molecular genetic characteristics, and gender. ATAC‐seq data were subjected to the computational pipelines diffTF, diffBind, and GREAT. RNA‐seq was performed on cord blood (CB) CD34+ cells after GPR56 knockdown and analyzed by DESeq2. The combined information was used to identify differential TF and signaling pathway activities up‐ and downstream of GPR56.
Pie charts showing the distribution of ATAC‐seq peaks shared by most samples (top), by at least 15 samples (middle), and those present in at least one sample. Colors indicate the different genomic regions. Chromatin regions that are rather differentially accessible (bottom) are enriched for introns and intergenic regions, which often contain regulatory elements, while shared peaks are more often located in promoter regions (top).
ATAC‐seq peaks more accessible in GPR56low (violet) or GPR56high (turquoise) against the background (gray) are enriched for enhancers associated with specific hematopoietic cell types. P‐values and odds ratios are given for a pairwise, two‐sided Fisher’s Exact test comparing each category (GPR56low/high) against the background. Enhancer annotations are taken from EnhancerAtlas 2.0. ***P < 0.0005, **P < 0.005, *P < 0.05.
Knockdown efficiency of two shRNAs against GPR56 (shGPR56weak and shGPR56strong) versus shLuc as negative control measured on protein level by flow cytometry in CD34+ CB cells. Shown are representative FACS plots (left) and the percentage of GPR56+ cells of transduced GFP+ cells on day 5 (right panel). Biological replicates N = 4, unpaired t‐test, bars and error bars represent mean and SD. ***P < 0.0005, **P < 0.005, *P < 0.05.
Integrative Genome Viewer (IGV) snapshot showing ATAC‐seq peaks along and upstream of the VWF gene in GPR56high vs. lowsamples (top, average peak size of 10 GPR56high (turquoise) and 15 GPR56low samples (violet)), RNA‐seq reads of the same location in AML samples with high (n = 9) versus low (n = 11) GPR56 expression (two middle tracks), and RNA‐seq reads of shLuc versus GPR56 knockdown CD34+ cells (3 bottom tracks, one of two replicates shown for each condition). Track height was group‐scaled. Dashed vertical lines indicate binding sites for the annotated TFs. TFBS: transcription factor‐binding site derived from the HOCOMOCO v10 database; TSS: transcription start site. TFs in blue bind to differentially accessible chromatin regions.
Volcano plot of differential TF motif accessibility (activity) in GPR56high (turquoise) vs. GPR56low (violet) samples and their corresponding adjusted P‐values determined with diffTF. Highlighted are TFs whose RNA expression was also positively or negatively affected by GPR56 KD in the RNA‐seq dataset.
Pathway enrichment analysis for peaks that are more accessible in GPR56high AML. The GREAT algorithm was used to assign peaks to genes, the MSig database was used for pathway enrichment analysis (Pathway Interaction Database). Shown are all terms with adjusted P‐value < 0.05. PW: pathway, (Co‐)reg.: (Co‐) regulation, act.: activity, NR: nuclear receptor, transcr.: transcription(al), netw.: network, signal.: signaling.
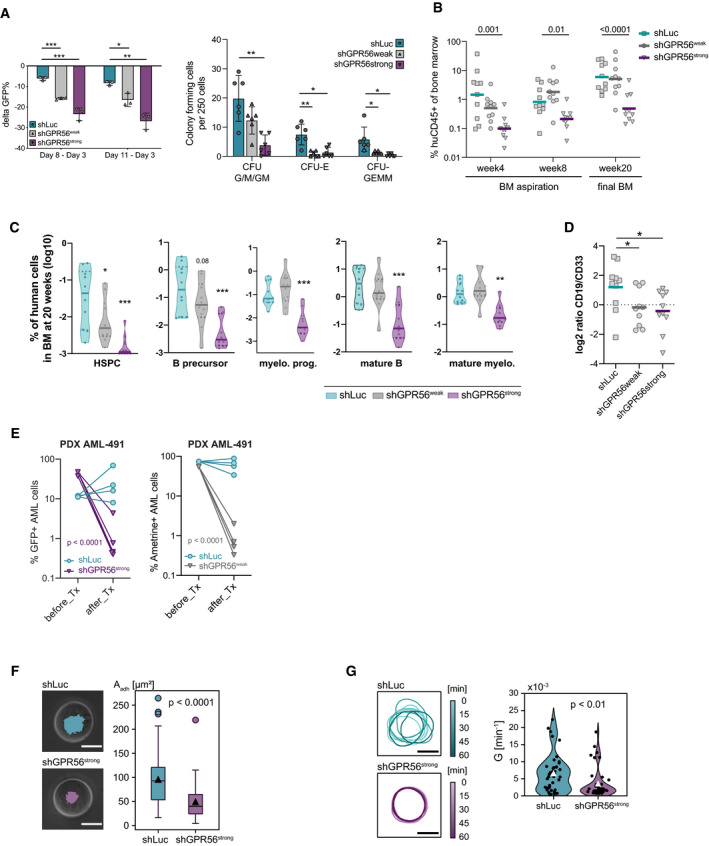
Functional role of GPR56 in vitro. Left: CB CD34+ cells were transduced with shGPR56weak and shGPR56strong versus shLuc as negative control. The loss of the GFP+ fraction on day 8 and day 11 compared with day 3 post transduction (delta GFP+) correlates with the level of GPR56 KD. Three replicate wells were monitored per condition, unpaired t‐test, bars and error bars represent mean and SD, ***P < 0.0005, **P < 0.005, *P < 0.05. Right: Colony‐forming cell assay. Pooled CB CD34+ cells were transduced with shRNAs against GPR56 or shLuc control and GFP+ cells were directly sorted into methylcellulose 72 h post transduction. Two hundred fifty GFP+ cells were plated per well, and colonies were counted 10 days post plating. CFC: colony forming cell, CFU: colony forming unit, G: granulocyte, M: macrophage, GM: granulocyte/macrophage, E: erythrocyte, GEMM: granulocyte, erythrocyte, megakaryocyte, macrophage. Shown is one of two independent assays. Six wells were plated per condition, unpaired t‐test, bars and error bars represent mean and SD. *P < 0.05, **P < 0.005.
Functional role of GPR56 in vivo. CB CD34+ cells were transduced with the two shRNAs against GPR56 versus shLuc as negative control. Gene transfer was approximately 50% at experiment start. Equal numbers of cells were injected in 10 recipient NSG mice per condition, and engraftment of human CD45+ (huCD45) cells in the bone marrow was assessed at 4 and 8 weeks by bone marrow aspiration and at 20 weeks by total bone marrow harvest. Strong GPR56 KD (shGPR56strong) significantly reduced overall human CD45+ engraftment, while incomplete KD (shGPR56weak) showed a trend toward lower engraftment at 4 weeks, but no difference at later time points indicating that low GPR56 surface levels might be sufficient for LT‐HSC engraftment. Unpaired t‐test of log10‐transformed values, symbols represent individual mice, horizontal bars represent geometric means, BM: bone marrow.
Violin plots showing geometric mean (horizontal line) and individual values (circles) of the engraftment levels of different hematopoietic cell types in the bone marrow of NSG mice 20 weeks after transplantation of CB CD34+ cells following overnight‐infection with shGPR56strong (turqouise) and shGPR56weak (gray) versus shLuc control (violet). Shown are percentages of indicated populations, which are also co‐positive for human CD45 and GFP, relative to all harvested bone marrow cells. HSPC: CD34+SSClowCD33−CD19−, B precursor: CD34+CD19+CD33−, myeloid progenitor (myelo. prog.): CD34+CD33+CD19−, mature B cells: CD19+CD34−, mature myeloid cells: CD33+CD19−CD34−. Multiple unpaired t‐tests of log‐transformed values, P‐values were Benjamini and Hochberg corrected (P adj), *P adj < 0.05, **P adj < 0.005, ***P adj < 0.0005. See Appendix Fig S2A for gating strategy.
Log2‐fold changes (log2FC) of the CD19+ (B lymphoid) versus CD33+ (myeloid) cell ratios within the human CD45+GFP+ fractions at final analysis 20 weeks after transplantation. Both shRNAs change the lymphoid/myeloid ratio in favor of myeloid cells. Unpaired t‐test of log2FC, symbols represent individual mice, horizontal bars represent average log2FC, *P < 0.05.
GPR56 KD results in highly reduced engraftment of AML‐491 in mice. Left: Cells from two independent infections with shGPR56strong were injected in 4 NRGS mice. Shown are fractions of GFP+ cells before and 10 weeks after transplantation (Tx). Unpaired t‐tests of log(%GFP+) before versus after transplantation. Right: weak GPR56 KD results in highly reduced engraftment of AML‐491 in NSGW41 mice. Cells were injected in 4 recipient NSGW41 mice. Shown are fractions of positively transduced Ametrine (AM)+ cells before and 32 weeks after Tx. Unpaired t‐tests of log(%AM+) before versus after transplantation. No difference in overall leukemic engraftment (including non‐transduced cells) was observed excluding technical issues with injections (Appendix Fig S2C).
Adhesion of control and GPR56 KD K562 cells on fibronectin‐functionalized substrates. Left: Overlay of phase contrast and microinterferometry images of control (above) and GPR56 KD cells (below). The area of tight adhesion extracted by microinterferometry is highlighted in turquoise and violet, respectively. Right: Comparison of adhesion areas extracted by microinterferometry, reduction of adhesion area by factor 1.9 in GPR56 KD cells (P = 1.0 × 10⁻¹⁰, two‐sided Mann‐Whitney test, box plots showing medians, quartiles, and outliers according to the Tukey method). Technical replicates N control = 71, Technical replicates N KD = 104, scale bar 10 µm.
Active deformation of control and GPR56 KD cells. Left: Cell periphery of control (top) and GPR56 KD (bottom) K562 cells tracked over 60 min. Right: Comparison of deformation power of control and GPR KD cells, showing a reduction of deformation power by factor 1.8 (P = 0.005, two‐sided Mann‐Whitney test, white triangles of the violin plot represent mean). Technical replicates N control = 40, Technical replicates N KD = 40, scale bar 10 µm.
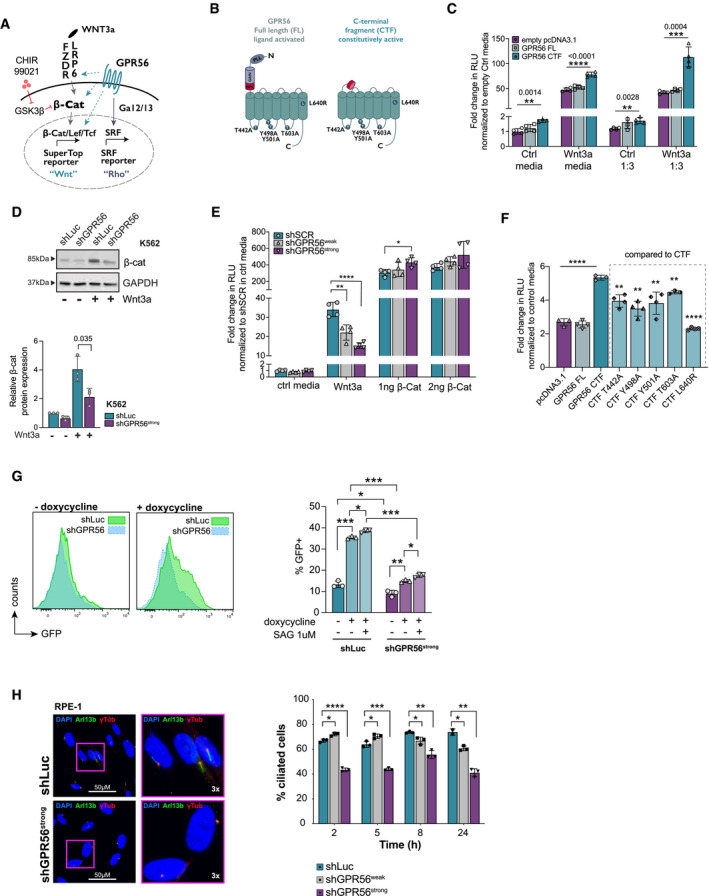
Cartoon illustrating at which levels GPR56 may enhance canonical Wnt signaling (turquoise dashed arrows): at the level of ligand‐receptor/co‐receptor interaction, β‐catenin, downstream of β‐catenin, indirectly via activation of Rho/SRF through Gɑ12/13. CHIR99021 is a GSK3 inhibitor that prevents degradation of β‐catenin thus enhancing Wnt signaling.
Cartoon illustrating GPR56 full length (FL, left) and the C‐terminal fragment (CTF, right). Amino acid changes introduced in the intracellular loops are indicated by circles and letters. GAIN: GPCR autoproteolysis‐inducing domain, GPS: GPCR proteolytic site, PLL: Pentraxin/Laminin/neurexin/sex‐hormone‐binding‐globulin‐Like (Salzman et al, 2016).
SuperTop reporter assay showing fold change of relative luminescence units (RLU) in Wnt3a conditioned culture media normalized to empty pcDNA3.1+ in the respective control (Ctrl) media after transfection of HEK293T cells with empty vector (violet), GPR56 FL (light turquoise), and GPR56 CTF (turquoise). Shown are means, SD, and individual values of four technical replicates performed in either complete media or 1:3 diluted Wnt3a conditioned media. Unpaired t‐test, ****P < 0.0001, ***P < 0.0005, **P < 0.005.
β‐catenin protein expression in K562 cells infected with shGPR56strong or shLuc negative control in presence and absence of Wnt3a (representative Western Blot (above) and quantification after normalization to GAPDH (below)). Shown is fold‐change compared with shLuc in control media, bars and error bars represent mean and SD of three biological replicates, unpaired t‐test.
SuperTop reporter assay showing fold‐change of RLU in presence of Wnt3a normalized to a scrambled shRNA (shSCR) in control media after transfection with shSCR, shRNAs against GPR56 with or without additional transfection with 1 ng or 2 ng of β‐catenin plasmid. Overexpression of β‐catenin fully rescues the SuperTop signal reduction caused by shRNAs against GPR56. Unpaired t‐test, bars, and error bars represent mean and SD of four biological replicates, ****P < 0.0001, ***P < 0.0005, **P < 0.005, *P < 0.05.
SuperTop reporter assay indicating fold change in RLU normalized to control media after transfection of HEK293T cells with empty vector, GPR56‐FL, or 5 GPR56‐CTF mutants. Unpaired t‐test, bars, and error bars represent mean and SD of four biological replicates, ****P < 0.0001, **P < 0.005.
Left: SMO‐GFP reporter RPE cell line or RPE‐1 wild‐type cells were infected with shGPR56strong or shLuc control followed by administration of doxycycline or the SMO agonist SAG as indicated. GPR56 KD significantly reduces the baseline and doxycycline‐induced SMO‐GFP signal. Right: representative FACS histogram plots showing GFP intensity in shLuc versus shGPR56strong RPE cells with and without doxycycline. Unpaired t‐test, bars, and error bars represent mean and SD of three biological replicates, ***P < 0.0005, **P < 0.005, *P < 0.05.
Left: Representative immunofluorescence (IF) images showing primary cilium formation in RPE cells upon starvation after infection with shLuc (above) or shGPR56strong (below). The non‐motile primary cilium is visualized using antibodies against γ‐tubulin, which stains the basal body, and the ciliary membrane marker ARL13B. DAPI indicates the nucleus. Images on the right show selected cells at 3× magnification. Brightness was increased in all images to enhance visibility of cilia. Right: Percentage of RPE‐1 cells with primary cilium in shLuc vs. shGPR56strong RPE‐1 cells at different time points after the start of serum starvation. Unpaired t‐test, bars, and error bars represent mean and SD of three biological replicate wells. ****P < 0.0001, ***P < 0.0005, **P < 0.005, *P < 0.05.
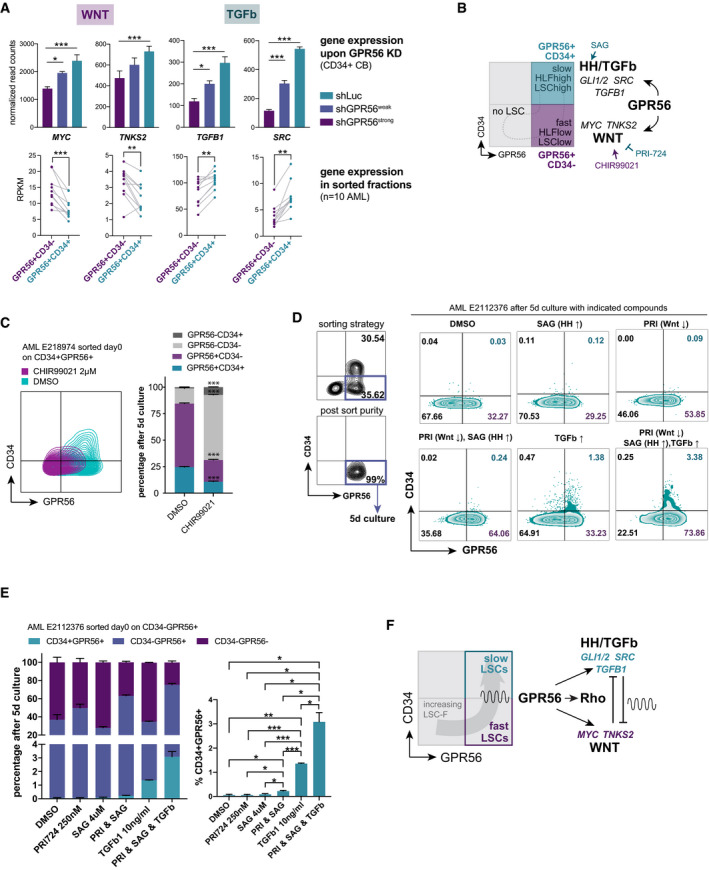
RNA‐seq after GPR56 KD in CD34+ CB cells reveals that GPR56 enhances gene expression displayed as reads per kilobase per million mapped reads (RPKM) of MYC, TNKS2, TGFB1, and SRC (top). Previously published RNA‐seq of ten sorted CD34+GPR56+ versus CD34−GPR56+ fractions (Garg et al, 2019) shows a divergent expression pattern: downregulation of Wnt targets MYC and TNKS, but upregulation of TGFB1 and SRC in the CD34+GPR56+ fraction. Unpaired t‐test, bars, and error bars represent mean and SD of three biological replicates, ***P < 0.0005, **P < 0.005, *P < 0.05.
Cartoon visualizing that GPR56 enhances genes and pathways differentially active in the CD34+GPR56+ fraction, which is characterized by slow cell cycle progression, high LSC frequency, and high expression of the stemness gene HLF versus the CD34−GPR56+ cells, which are more differentiated (lower LSC frequency), cycle faster, and have little HLF expression. Arrows and blocked arrows indicate activation or inhibition by the indicated small molecules, respectively, which were used in subsequent experiments.
Contour FACS plots (left) and summary bar graph (right) showing CD34 and GPR56 expression after 5‐day culture of purified CD34+GPR56+ cells from AML sample E218974 with CHIR99021 or vehicle DMSO, Unpaired t‐test, bars, and error bars represent mean and SD of three technical replicates, ***P < 0.0005.
Left: FACS profile and sorting strategy for the CD34‐GPR56+ fraction (top), and post‐sort purity (bottom) of AML sample E2112376 on the day of thawing. Right: CD34 and GPR56 expression measured by flow cytometry 5 days post exposure of purified CD34‐GPR56+cells to the indicated molecules or their combinations. PRI: PRI‐724, arrows indicate whether the pathway is inhibited (↓) or activated (↑) by the compound.
Left: Bar graph showing the distribution of CD34 and GPR56 fractions at the end of the 5‐day culture of purified CD34−GPR56+ cells from AML E2112376 with indicated compounds. Right: statistical analysis shown only for the CD34+GPR56+ fraction. See Dataset EV11 for full statistical analysis. PRI: PRI‐724, Unpaired t‐test, bars, and error bars represent mean and SD of three individual treatments, ***P < 0.0005, **P < 0.005, *P < 0.05.
Cartoon visualizing the proposed mechanism by which both GPR56+ LSC‐enriched compartments are maintained: GPR56 enhances pathways, which reciprocally inhibit each other and are differentially active in the two fractions. This should result in a constant transition between the compartments and thus prevent exhaustion of the two populations.
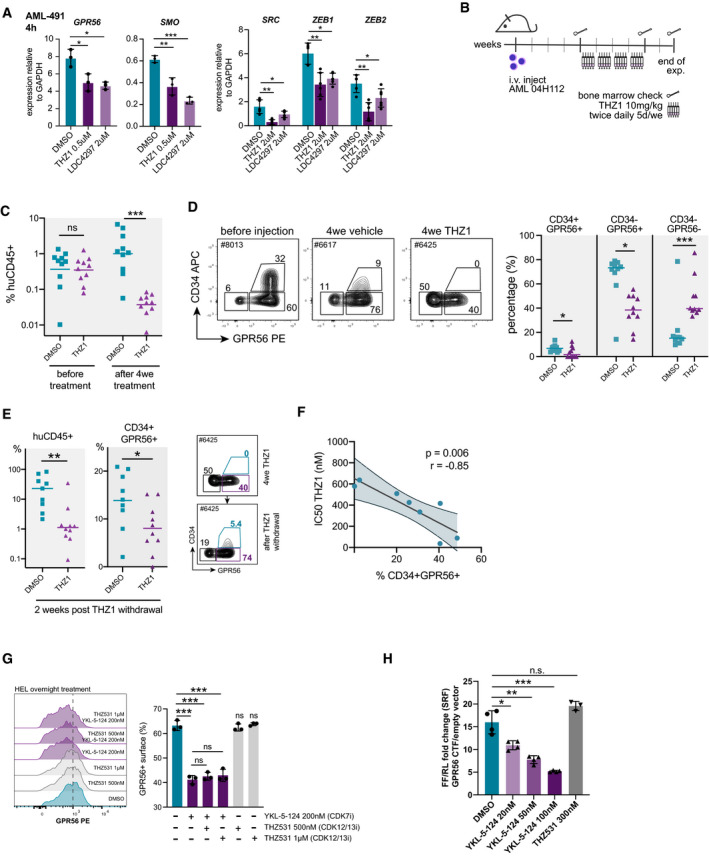
Gene expression of GPR56, SMO (left), and TGFb targets SRC, ZEB1, and ZEB2 (right) normalized to GAPDH in AML‐491 cells determined by q‐RT‐PCR 4 h after treatment with THZ1 0.5 µM or LDC4297 2 µM. Unpaired t‐test. Mean, SD, and individual values from three individual treatments. ***P < 0.0005, **P < 0.005, *P < 0.05.
Setup of in vivo drug treatment. NSG mice were injected with 105 AML 04H112 cells. Four weeks post injection, bone marrow (BM) was analyzed for human leukemic engraftment by BM aspiration. Treatment with either THZ1 or vehicle was started in the following week as indicated. BM was analyzed again after the end of the 4‐week treatment period.
Overall percentage of human (huCD45+) leukemic cells in mice before and at the end of the 4‐week treatment period. Individual mice and mean engraftment are shown. Unpaired t‐test. ***P < 0.0005. N = 10 mice for each group.
Left: Representative FACS plots showing the typical CD34lowGPR56high profile of sample 04H112 before injection and after the 4‐week treatment with THZ1. Right: both LSC compartments, the CD34‐GPR56+ and the CD34+GPR56+ fractions were significantly reduced in vivo in the THZ1 treatment group. Individual mice and mean engraftment are shown. Unpaired t‐test. ***P < 0.0005, **P < 0.005, *P < 0.05. N = 10 mice for each group.
Left: Overall percentage of human (huCD45+) leukemic cells and the fraction of CD34+GPR56+ among human cells (mean, individual mice) two weeks after drug withdrawal. Right: FACS plot visualizing that the CD34+GPR56+ is re‐established upon drug removal. Unpaired t‐test, ***P < 0.0005, **P < 0.005, *P < 0.05.
Correlation plot showing an anti‐correlation between the percentage of CD34+GPR56+ cells in AML samples and the corresponding IC50s for THZ1 determined in the respective samples. Pearson correlation. Each dot represents one sample. See Dataset EV12 for sample characteristics.
FACS histogram plot (left) and summary bar graph from three replicate wells (right) showing reduction of GPR56 surface expression on the GPR56‐positive AML cell line HEL only in conditions that contain the more specific CDK7 inhibitor YKL‐5‐124, but not those that contain only the specific CDK12/13 inhibitor THZ531. Unpaired t‐test, bars, and error bars represent mean and SD of three individual treatments, ***P < 0.0005, **P < 0.005, *P < 0.05.
SRF reporter assay showing dose‐dependent suppression of the GPR56‐CTF‐induced SRF signal by the CDK7 inhibitor YKL‐5‐124, but not by the CDK12/13 inhibitor THZ531. Four technical replicates. One of the four individual experiments. Unpaired t‐test, bars and error bars represent mean and SD, ***P < 0.0005, **P < 0.005, *P < 0.05.

Left: Eleven primary AML specimens with different cytogenetic and molecular genetic aberrations (see Dataset EV12 for details) were treated with THZ1 or YKL‐5‐124 alone or in combination with venetoclax. IC50 values in presence of increasing doses of venetoclax are visualized for THZ1. The gray‐scale bar indicates the fraction of viable cells in presence of a high dose of venetoclax (500 nM) compared with DMSO to provide an approximation whether a sample was rather sensitive or resistant against venetoclax alone. Note that the addition of venetoclax reduces the IC50 in all samples regardless of their baseline resistance against venetoclax alone. The last four columns provide the average and maximum BLISS scores reached by a combination of THZ1 and venetoclax (N = 11) Middle: representative dose‐response curves of THZ1 in presence of increasing doses of venetoclax for one primary AML specimen with intermediate venetoclax sensitivity. Right: representative 3D‐synergy plot showing the BLISS synergy scores at indicated concentrations of THZ1 and venetoclax for AML E204098.
Dose‐response curve for the CDK7i CT7001 in presence of increasing doses of venetoclax for primary AML E2113590. The indicated doses on the right represent the IC50 dose.
Schematic visualizing the setup for the combinatory in vivo treatment. AML‐661 cells were injected in NSG mice. Bones indicate the timepoints of bone marrow aspirations to monitor engraftment of human leukemic cells in mice before treatment start and during treatment.
Percentage of human CD45+ leukemic cells three weeks post injection, i.e. before treatment start (left), and 4 and 6 weeks after treatment start (right). Dots represent individual mice, horizontal lines represent means. Unpaired t‐test, ***P < 0.0005, **P < 0.005.
Percentage of human CD34+GPR56+ cells in the mouse bone marrow at 4 and 6 weeks post treatment start with the indicated compounds. Dots represent individual mice, horizontal lines represent means. Unpaired t‐test, ***P < 0.0005, **P < 0.005, *P < 0.05.
Left: Representative FACS plots showing CD34 and GPR56 expression on AML cells after 4‐week treatment with the indicated compounds. Right: Statistical analysis of the geometric mean intensity of CD34 APC (left) and GPR56 PE (right) in the four treatment groups. Horizontal lines represent means. Unpaired t‐test, ***P < 0.0005, **P < 0.005, *P < 0.05.
Cartoon visualizing how CDK7i and venetoclax synergize to suppress both GPR56+ compartments in AML.
References
-
- Berest I, Arnold C, Reyes‐Palomares A, Palla G, Rasmussen KD, Giles H, Bruch P‐M, Huber W, Dietrich S, Helin K et al (2019) Quantification of differential transcription factor activity and multiomics‐based classification into activators and repressors: diffTF. Cell Rep 29: 3147–3159 - PubMed
-
- Bliss CI (1939) The toxicity of poisons applied jointly. Ann Appl Biol 26: 585–615
MeSH terms
Substances
Associated data
- Actions
- Actions
- Actions
- Actions
- Actions
- Actions
- Actions
LinkOut - more resources
Full Text Sources
Medical
