. 2022 Apr 8;50(6):3445-3455.
doi: 10.1093/nar/gkac158.

i-Motif formation and spontaneous deletions in human cells

Affiliations

i-Motif formation and spontaneous deletions in human cells

Marianna Martella et al. Nucleic Acids Res. .

Abstract

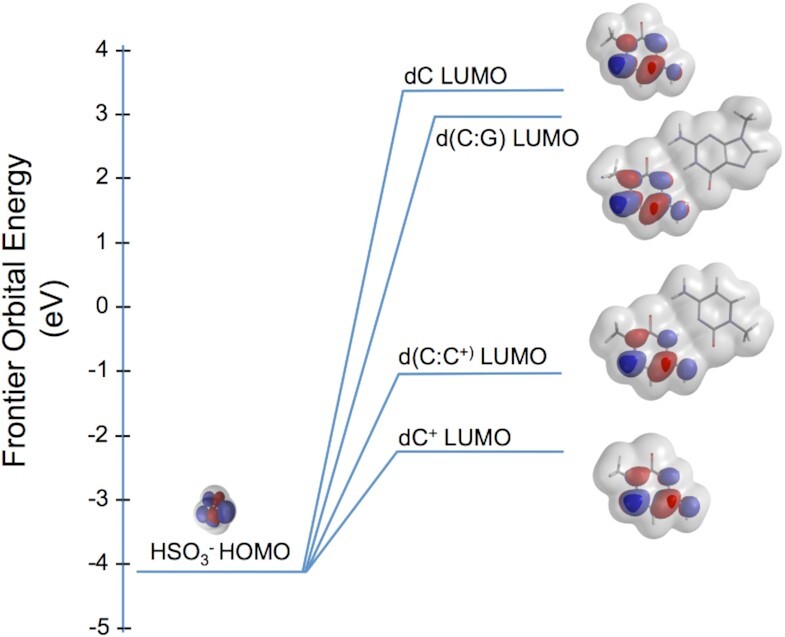
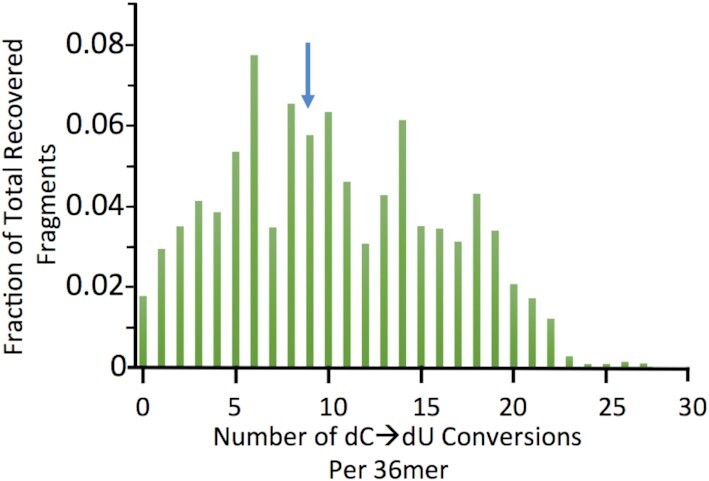
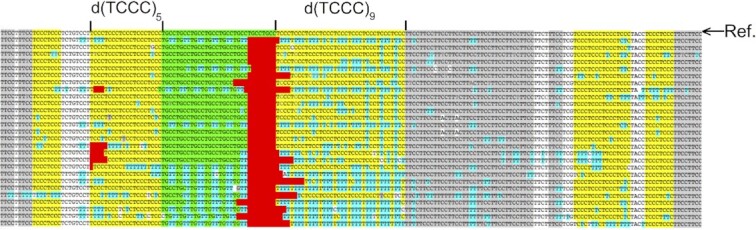
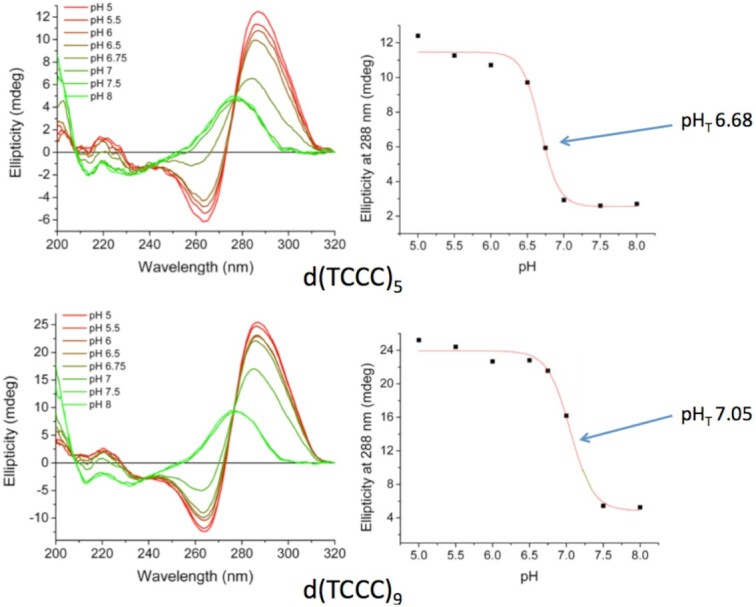
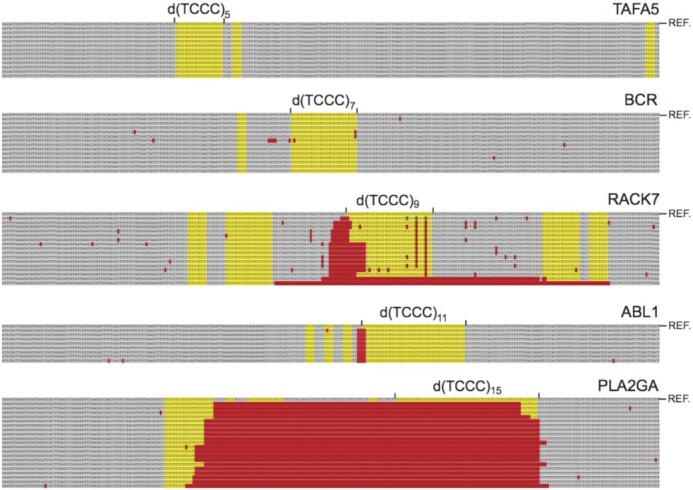
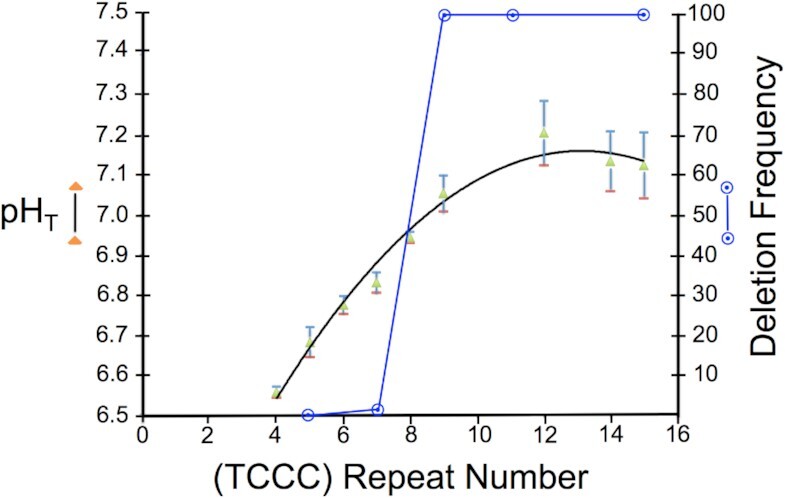
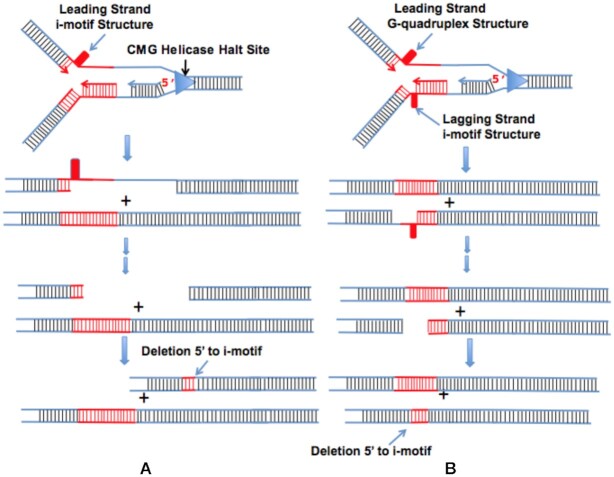
Concatemers of d(TCCC) that were first detected through their association with deletions at the RACK7 locus, are widespread throughout the human genome. Circular dichroism spectra show that d(GGGA)n sequences form G-quadruplexes when n > 3, while i-motif structures form at d(TCCC)n sequences at neutral pH when n ≥ 7 in vitro. In the PC3 cell line, deletions are observed only when the d(TCCC)n variant is long enough to form significant levels of unresolved i-motif structure at neutral pH. The presence of an unresolved i-motif at a representative d(TCCC)n element at RACK7 was suggested by experiments showing that that the region containing the d(TCCC)9 element was susceptible to bisulfite attack in native DNA and that d(TCCC)9 oligo formed an i-motif structure at neutral pH. This in turn suggested that that the i-motif present at this site in native DNA must be susceptible to bisulfite mediated deamination even though it is a closed structure. Bisulfite deamination of the i-motif structure in the model oligodeoxynucleotide was confirmed using mass spectrometry analysis. We conclude that while G-quadruplex formation may contribute to spontaneous mutation at these sites, deletions actually require the potential for i-motif to form and remain unresolved at neutral pH.


Figures

Figure 1.
Figure 1.
Frontier orbitals in the reaction between the bisulfite anion and cytosine in nucleic acids. The equilibrium geometry highest occupied molecular orbital (HOMO) for the bisulfite anion (lower left) is shown at its energy in eV under the transparent electron density that envelops of the molecule. Similar equilibrium geometry calculations, all at the Hartree-Fock 6–31G* level of theory, are depicted for the lowest unoccupied molecular orbital (LUMO) of models of cytosine in its several possible configurations in DNA. In each model the deoxyribose moiety at N1 of cytosine or guanine is modeled by a simple methyl group. Hence, the bases used in the electronic structure calculations are 1-methyl-cytosine, 1-methyl_cytoisne+ or 1-methyl-guanine. The geometry of the LUMO’s identify C6 of cytosine as the point of nucleophilic attack by the anion (blue center above the transparent electron density) in each model, and order the reactivity of each based on the LUMO energies in eV: dC+>d(C:C+)>>d(C:G)>dC.
Figure 2.
Figure 2.
Frequency distribution for recovered 36mers after bisulfite treatment at 37°C and pH 5.3. Bisulfite treated DNA at 0.5, 1 and 2 μg input oligodeoxynucleotide DNA was recovered after high resolution liquid chromatography. Mass spectrometry showed that it is partially converted with a range of dU/36mer deaminations that are distributed from 0 to 27 dU deaminations in individual 36mers distinguished based on mass. The frequency of each species is plotted versus the number of dUs present in each 36mer as the average for the three input levels. The Distribution is centered on approximately 9dU/36mer (blue arrow). 92% of fragments in the spectrum had masses ≥ that of the d(TCCC)9 36mer.
Figure 3.
Figure 3.
Bisulfite mediated deamination of native DNA in the region of RACK7 containing d(TCCC)5 and d(TCCC)9. After bisulfite treatment of native DNA at pH 5.3 and 37°C, representative cloned isolates of the region were sequenced and the sequences aligned under the genomic reference sequence from the GRCh38.p12 primary assembly of the human genome (marked Ref. in the figure). d(TCCC)n elements are depicted in yellow. The alignment shows that deletions of various length have occurred in different cells at the 5′ends of both d(TCCC)5 and d(TCCC)9. However, both the level of deamination (blue) and the level of deletion (red) are much more extensive at d(TCCC)9 than in d(TCCC)5.
Figure 4.
Figure 4.
Titration curves for oligodeoxynucleotides with d(TCCC)5 and d(TCCC)9 repeats. CD spectra for each repeat over the titration range pH 5 to pH 8. In each titration, the characteristics i-motif signature emerge as pH is decreased, with the full signature emerging at pH 5 for d(TCCC)5 and at pH 5.5 for d(TCCC)9. Transition pH (pHT) values show that a significant fraction of each sequence would be present as i-motif near physiological pH.
Figure 5.
Figure 5.
Deletions at multiple genomic locations in cultured human prostate cancer cells. Deleted sequences (red) are located near the 5′- end of the C-rich strand of the d(TCCC)n repeat and often extend into the repeat itself. Deletions were not observed for d(TCCC)5 in the HAFA5 gene, and were very infrequent for d(TCCC)7 in the BCR gene, however for the d(TCCC)9 in the RACK7 gene, d(TCCC)11 in the ABL1 gene and d(TCCC)15 in the PLA2GA2 gene each cloned representative carried a deletion.
Figure 6.
Figure 6.
Length dependence of i-motif formation at neutral pH correlated with deletion frequency. pHT value: closed triangles (green) ± standard deviation determined from the titration curve fit. Fraction of cloned sequences with a deletion: open circles (blue).
Figure 7.
Figure 7.
Possible structures for d(TCCC)9. (A) A Tandem Structure Composed of two linked i-motifs formed from two d(TCCC)4 elements linked by a single d(TCCC): d(TCCC)4–d(TCCC)–d(TCCC)4. (B) A single d(TCCC)9 i-motif. In each structure the loops contain a single dT residue.
Figure 8.
Figure 8.
i-Motif induced deletion models. i-Motifs can form on either the leading or lagging strand depending on the direction of replication. When replication completes, either by restarting replication beyond the leading strand impediment or by replication from a distant replication origin two types of structure are created (20,21,36). A: When an i-motif forms the leading strand impediment and survives after replication deletions occur 5′ to the i-motif on the C-rich strand often extending into the repeat sequence itself. B: When a G-quadruplex forms a transient leading strand impediment and an i-motif forms on the lagging strand, deletions again occur near the i-motif often extending into the repeat sequence itself. Note that when only G-quadruplex survives replication as is the case in dog-1 mutant C. elegans deletions will occur 5′ to the G-quadruplex on the G-rich strand (20,21,36) often extending into the repeat itself.

References

    1. Huppert J.L., Balasubramanian S.. Prevalence of quadruplexes in the human genome. Nucleic Acids Res. 2005; 33:2908–2916. - PMC - PubMed
    1. Sundquist W.I., Klug A.. Telomeric DNA dimerizes by formation of guanine tetrads between hairpin loops. Nature. 1989; 342:825–829. - PubMed
    1. Del Mundo I.M.A., Zewail-Foote M., Kerwin S.M., Vasquez K.M.. Alternative DNA structure formation in the mutagenic human c-MYC promoter. Nucleic Acids Res. 2017; 45:4929–4943. - PMC - PubMed
    1. Day H.A., Pavlou P., Waller Z.A.. i-Motif DNA: structure, stability and targeting with ligands. Bioorg. Med. Chem. 2014; 22:4407–4418. - PubMed
    1. Smith S.S. Evolutionary expansion of structurally complex DNA sequences. Cancer Genomics Proteomics. 2010; 7:207–215. - PubMed

Publication types