. 2022 Apr 22;50(7):e42.
doi: 10.1093/nar/gkac150.

STRIDE: accurately decomposing and integrating spatial transcriptomics using single-cell RNA sequencing

Affiliations

STRIDE: accurately decomposing and integrating spatial transcriptomics using single-cell RNA sequencing

Dongqing Sun et al. Nucleic Acids Res. .

Erratum in

Abstract

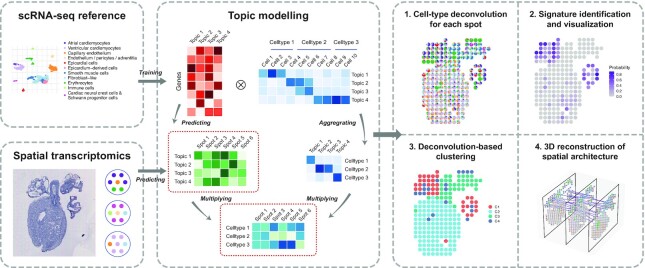
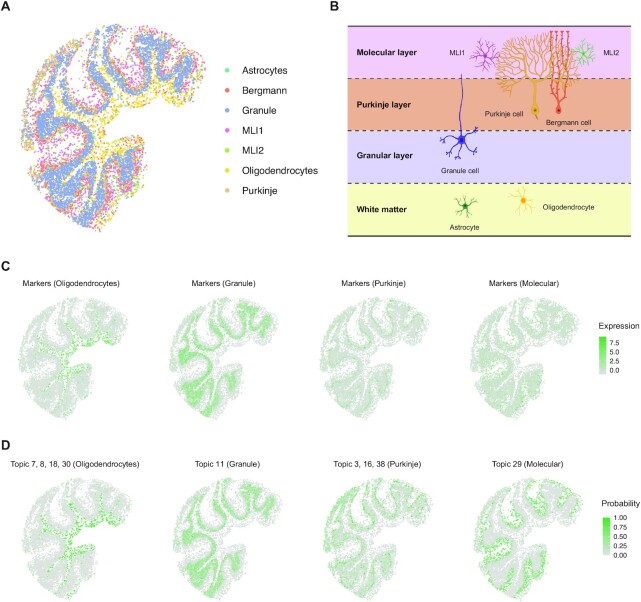
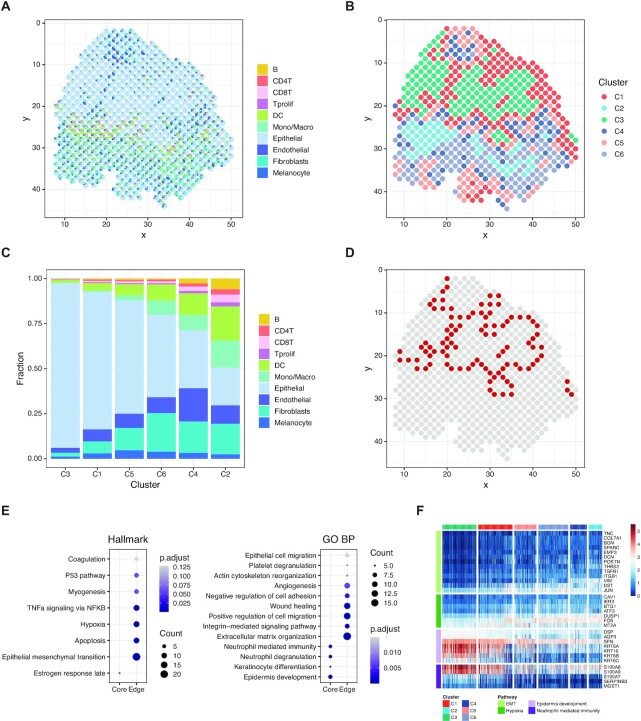
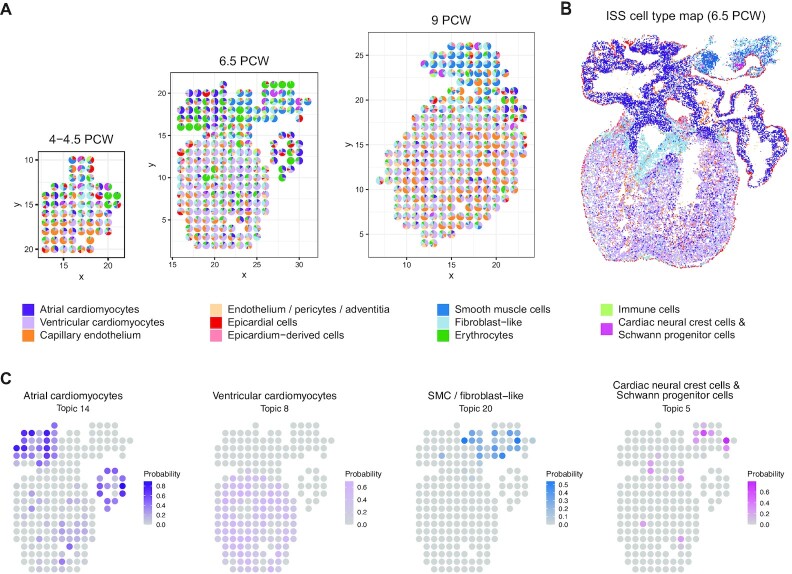
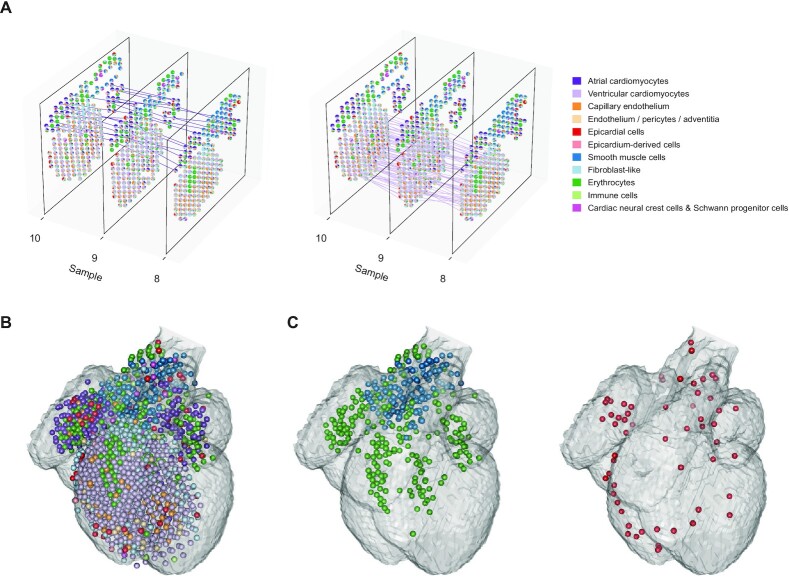
The recent advances in spatial transcriptomics have brought unprecedented opportunities to understand the cellular heterogeneity in the spatial context. However, the current limitations of spatial technologies hamper the exploration of cellular localizations and interactions at single-cell level. Here, we present spatial transcriptomics deconvolution by topic modeling (STRIDE), a computational method to decompose cell types from spatial mixtures by leveraging topic profiles trained from single-cell transcriptomics. STRIDE accurately estimated the cell-type proportions and showed balanced specificity and sensitivity compared to existing methods. We demonstrated STRIDE's utility by applying it to different spatial platforms and biological systems. Deconvolution by STRIDE not only mapped rare cell types to spatial locations but also improved the identification of spatially localized genes and domains. Moreover, topics discovered by STRIDE were associated with cell-type-specific functions and could be further used to integrate successive sections and reconstruct the three-dimensional architecture of tissues. Taken together, STRIDE is a versatile and extensible tool for integrated analysis of spatial and single-cell transcriptomics and is publicly available at https://github.com/wanglabtongji/STRIDE.


Figures

Figure 1.
Figure 1.
Schematic representation of the STRIDE workflow First, STRIDE estimates the gene-by-topic distribution and the topic-by-cell distribution from scRNA-seq. The topic-by-cell distribution is then summarized to the cell-type-by-topic distribution by Bayes’ Theorem. Next, the pre-trained topic model is applied to infer the topic distributions of each location in spatial transcriptomics. By combining cell-type-by-topic distribution and topic-by-location distribution, the cell-type fractions of each spatial location could be inferred. STRIDE also provides several downstream analysis functions, including signature detection and visualization, spatial domain identification and reconstruction of spatial architecture from sequential ST slides of the same tissue.
Figure 2.
Figure 2.
Benchmarking STRIDE’s performance using simulated data. (A) The cell-type-by-topic distribution estimated by STRIDE. The color represents the probability that one topic exists in one given cell type. (B) Validation of the trained topic model on the scRNA-seq used for training. The confusion matrix reflects the consistency between the prediction and the truth for the cell-type assignment of scRNA-seq data. The value represents the number of cells that belong to one cell type and are predicted to all different cell types. The color represents the proportion of cells belonging to the cell type on the y-axis and classified as the cell type on the x-axis. (C) Benchmark of STRIDE’s performance on different gene sets. The box plot reflects the distribution of Pearson’s correlation calculated between the predicted cell-type proportion and the ground truth for each spot. (D) Benchmark of STRIDE’s accuracy against different deconvolution methods. The box plot reflects the overall distribution of Pearson's correlation calculated in each spot for each method. (E) Benchmark of STRIDE’s sensitivity and specificity against different deconvolution methods. In each simulated location, the cell types were divided into two groups according to the presence (blue) and absence (pink), and RMSE was calculated within each group separately. The box plot reflects the distribution of RMSE in different methods. (F) Benchmark of the ability to distinguish diverse cell types across different deconvolution methods. Pearson’s correlation between the predicted proportions and the ground truth was calculated for each cell type. The black line in each column indicates the median of different cell types’ correlation for each method. (G) Benchmark of STRIDE’s robustness against different deconvolution methods on the simulated dataset with different sequencing depths.
Figure 3.
Figure 3.
Application of STRIDE on the mouse cerebellum. (A) The spatial distribution of the seven most common cell types predicted by STRIDE. Each point represents the pixel captured by Slide-seq V2, and colors represent different cell types. (B) The schematic of the layered structure of the mouse cerebellum (created with BioRender.com). The cerebellum cortex is divided into three layers. At the top lies the molecular layer which contains two types of molecular layer interneurons, MLI1 and MLI2, along with the dendritic trees of Purkinje cells. At the middle lies the Purkinje layer which contains the body of Purkinje cells and Bergmann cells. At the bottom lies the granular layer which contains the granule cells. Below the cortex is the region of white matter enriched with oligodendrocytes and astrocytes. (C) The expression patterns of cell-type-specific marker genes for oligodendrocytes, granule cells, Purkinje cells and MLIs. The color represents the summed expression values of top 100 marker genes. (D) The distribution of cell-type-associated topics for oligodendrocytes, granule cells, Purkinje cells and MLIs. The color represents the summed probability of associated topics in each pixel.
Figure 4.
Figure 4.
Characterizing the heterogeneity of microenvironment in human squamous cell carcinoma. (A) The scatter pie plot to show the spatial locations of different cell types predicted by STRIDE. Each scatter represents a spot in the ST slide. The pie chart is used to reflect the proportions of different cell types within each spot. Colors represent different cell types. (B) The k-means clustering of spots based on the cell-type compositions and surrounding cell populations. Colors represent the cluster labels. (C) The cell-type composition of each cluster. The cell-type proportions of all spots in each cluster were averaged to represent the cluster's cell-type composition. (D) Spatial location of the tumor-edge region. Spots in the tumor-edge region are highlighted with red. (E) Hallmark (left) and GO (right) enrichment analysis on the up-regulated genes of epithelial cells in each region. The size of the dot represents the number of genes enriched in the term, and the color represents the enrichment significance. (F) The expression profile of genes associated with different pathways in epithelial cells mapped to each region. Pathways include EMT, hypoxia, epidermis development and neutrophil-mediated immunity.
Figure 5.
Figure 5.
Application of STRIDE on the developing human heart. (A) The deconvolution result of sample 3, 9 and 16 from 4.5–5 PCW, 6.5 PCW and 9 PCW, respectively. Each scatter represents a spot in the ST slide. The pie chart is used to reflect the proportions of different cell types within each spot. Colors represent different cell types. (B) The spatial cell-type map created through the integration of ISS and scRNA-seq by the original study. (C) The distribution of topics associated with atrial and ventricular cardiomyocytes, SMC or fibroblast-like cells, and cardiac neural crest cells & Schwann progenitor cells. The colors represent the probability of topics in each spot.
Figure 6.
Figure 6.
3D model reconstruction of the developing human heart. (A) The alignment between adjacent tissue samples. Each pair of spots is connected by a line if they are matched according to the slide alignment. The left and right show the matching between spots dominated by ventricular and atrial cardiomyocytes, respectively (the matching of other cell types are shown in Supplementary Figure S5A). (B) 3D model representation of the 6.5 PCW human heart constructed by STRIDE. Nine sequential samples from the 6.5 PCW heart were aligned and integrated together. Each sphere represents a spot in the ST slide, which is colored according to the cell type with the highest proportion. The translucent outline shows the 3D atlas of the developing human heart (Carnegie stage 18). (C) Left, the spatial distribution of SMCs and erythrocytes. Right, the spatial distribution of epicardial cells.

Similar articles

Cited by

References

    1. Tang F., Barbacioru C., Wang Y., Nordman E., Lee C., Xu N., Wang X., Bodeau J., Tuch B.B., Siddiqui A.et al. .. mRNA-Seq whole-transcriptome analysis of a single cell. Nat. Methods. 2009; 6:377–382. - PubMed
    1. Macosko E.Z., Basu A., Satija R., Nemesh J., Shekhar K., Goldman M., Tirosh I., Bialas A.R., Kamitaki N., Martersteck E.M.et al. .. Highly parallel Genome-wide expression profiling of individual cells using nanoliter droplets. Cell. 2015; 161:1202–1214. - PMC - PubMed
    1. Klein A.M., Mazutis L., Akartuna I., Tallapragada N., Veres A., Li V., Peshkin L., Weitz D.A., Kirschner M.W.. Droplet barcoding for single-cell transcriptomics applied to embryonic stem cells. Cell. 2015; 161:1187–1201. - PMC - PubMed
    1. Lin G.L., Hankenson K.D.. Integration of BMP, wnt, and notch signaling pathways in osteoblast differentiation. J. Cell. Biochem. 2011; 112:3491–3501. - PMC - PubMed
    1. Junttila M.R., de Sauvage F.J.. Influence of tumour micro-environment heterogeneity on therapeutic response. Nature. 2013; 501:346–354. - PubMed