

Intra-epithelial non-canonical Activin A signaling safeguards prostate progenitor quiescence
- PMID: 35253958
- PMCID: PMC9066067
- DOI: 10.15252/embr.202154049
Intra-epithelial non-canonical Activin A signaling safeguards prostate progenitor quiescence
Abstract
The healthy prostate is a relatively quiescent tissue. Yet, prostate epithelium overgrowth is a common condition during aging, associated with urinary dysfunction and tumorigenesis. For over thirty years, TGF-β ligands have been known to induce cytostasis in a variety of epithelia, but the intracellular pathway mediating this signal in the prostate, and its relevance for quiescence, have remained elusive. Here, using mouse prostate organoids to model epithelial progenitors, we find that intra-epithelial non-canonical Activin A signaling inhibits cell proliferation in a Smad-independent manner. Mechanistically, Activin A triggers Tak1 and p38 ΜAPK activity, leading to p16 and p21 nuclear import. Spontaneous evasion from this quiescent state occurs upon prolonged culture, due to reduced Activin A secretion, a condition associated with DNA replication stress and aneuploidy. Organoids capable to escape quiescence in vitro are also able to implant with increased frequency into immunocompetent mice. This study demonstrates that non-canonical Activin A signaling safeguards epithelial quiescence in the healthy prostate, with potential implications for the understanding of cancer initiation, and the development of therapies targeting quiescent tumor progenitors.
Keywords: MAP3K7; Activin A; TGF-β; organoids; prostate.
© 2022 The Authors. Published under the terms of the CC BY NC ND 4.0 license.
Figures
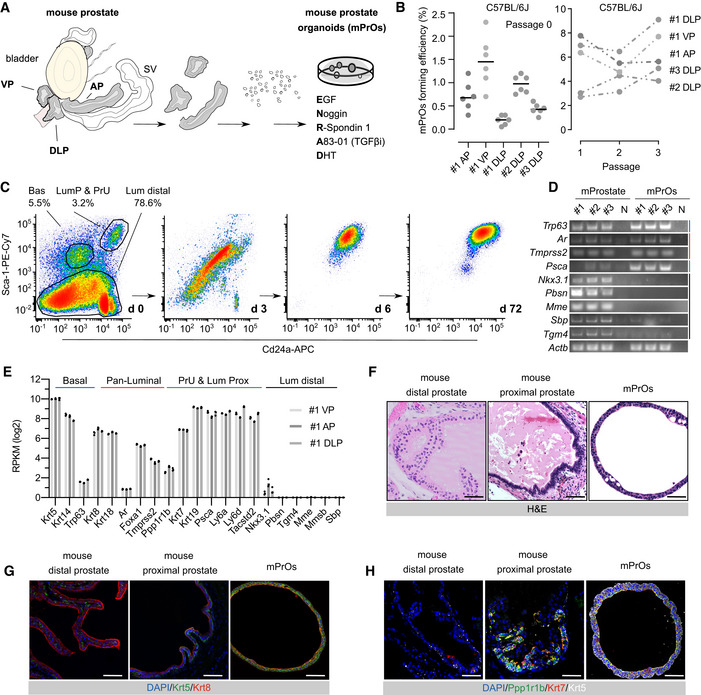
Schematic diagram describing organoid culture derivation (AP, Anterior Prostate; DLP, Dorso‐Lateral Prostate; VP, Ventral Prostate; SV, Seminal Vesicle; DHT, dihydrotestosterone).
Mouse prostate organoid forming efficiency. Efficiency at derivation (left; n = 6 biological replicates, data points are shown with crossing line representing mean value). Efficiency at passage 1‐3 (right; n ≥ 3 biological replicates per organoid line/passage; data are presented as mean).
Representative longitudinal flow cytometry analysis of dissociated organoid cells (Bas, Basal; LumP, Luminal Proximal; PrU, Periurethral; Lum Distal, Luminal Distal).
End‐point RT–PCR analysis for selected marker genes (n = 3 biological replicates).
Bulk‐RNAseq analysis (n = 3 biological replicates; individual data points are shown with bar graphs representing mean value).
Representative hematoxylin‐eosin (H&E) staining of mouse prostate tissue and organoid sections (scale bars = 50 μm).
Representative immunofluorescence (IF) analysis for selected markers in mouse prostate tissue and organoid sections (scale bars = 50 μm).
IF staining for selected markers in mouse prostate tissue and organoid sections (scale bars = 50 μm).

Immunofluorescence analysis for selected markers in mouse prostate tissue and organoid sections. Scale bars = 50 µm.
Stereoscopic images of mouse prostate organoids experiencing transient DHT removal (androgen cycling). Lumen formation necessitates androgen signaling. Scale bar = 1 mm.
Western blot analysis for androgen receptor (Ar) expression in mouse prostate organoids experiencing androgen cycling, and control cell lines expressing (LNCaP) or not expressing (PC3) the receptor.
qRT–PCR mRNA expression analysis for selected androgen‐responsive genes in the presence or absence of DHT. Data points are shown with crossing line representing mean value (n = 3 biological replicates; Student's t‐test, two‐tailed, P‐value *< 0.05, **< 0.01, ***< 0.001).
Western blot analysis for apoptotic markers (Cleaved Caspase 3, Full‐length, and Cleaved Parp) expression in mouse prostate organoids cultured with or without DHT (n = 2 biological replicates).
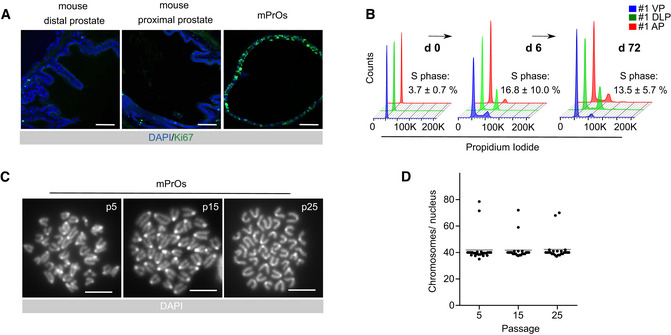
Immunofluorescence staining for Ki67 in mouse prostate tissue and organoid sections. Scale bars = 50 µm.
Flow cytometry analysis for DNA content.
Representative karyotypes. Scale bars = 10 µm.
Quantification of karyotype analysis. Data points are shown with crossing line representing mean value (n = 25 metaphases/passage).
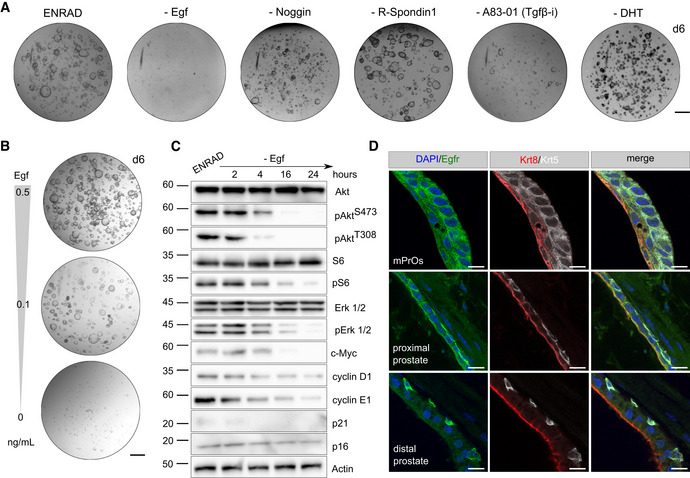
Representative stereoscopic images of mouse prostate organoid grown in complete medium (ENRAD) vs. medium depleted of individual growth factors/inhibitors. Mouse prostate organoids necessitate of both Egf and the Tgf‐β inhibitor A83‐01 for continuous expansion. Within the period of observation, removal of Noggin or R‐Spondin 1 has no clear consequence in culture. Please note that organoids failed to form a lumen in the absence of DHT. Scale bar = 1 mm.
Stereoscopic images of mouse prostate organoids cultured in the presence of reduced levels (0.5, 0.1 ng/ml) or in the absence of Egf. Scale bar = 1 mm.
Western blot analysis in mouse prostate organoids for selected signaling mediator and cell cycle regulator proteins.
Immunofluorescence analysis for selected markers in mouse prostate tissue and organoid sections. Scale bars = 10 µm.
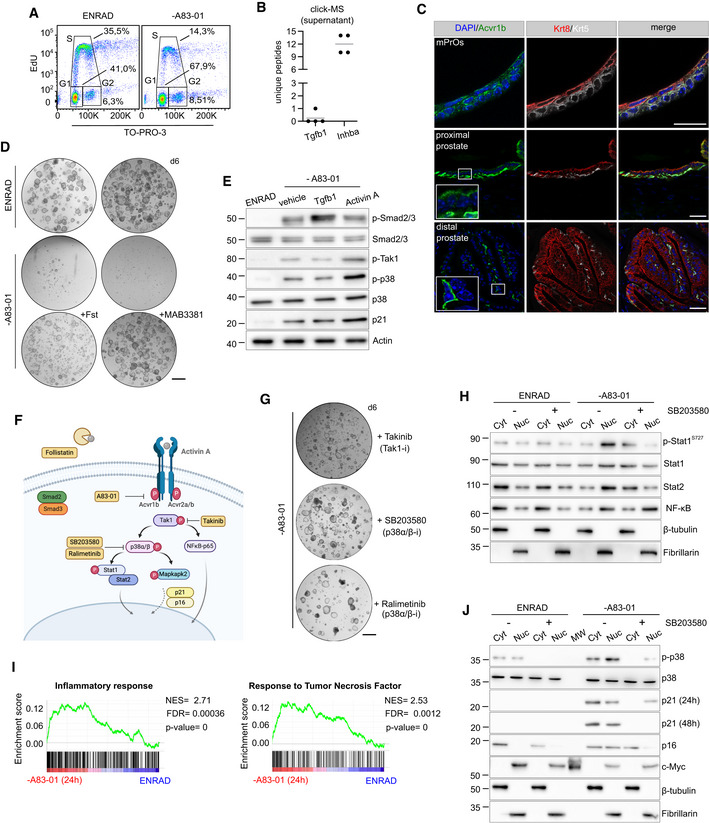
Cell cycle analysis by flow cytometry (EdU vs. TO‐PRO‐3) in complete medium (ENRAD) or in the absence of A83‐01 (24 h).
Detection of proteins secreted by mouse prostate organoids in culture based on click‐chemistry enrichment and mass spectrometry analysis (n = 4 biological replicates; data points are shown with crossing line representing mean value).
IF analysis for selected markers in mouse prostate tissue and organoid sections (scale bar = 50 μm).
Representative stereoscopic images of mouse prostate organoids cultured in the absence of A83‐01, with or without Follistatin (Fst, 500 ng/ml, 6 days), or with or without the Activin A neutralizing antibody MAB3381 (1 μg/ml, 6 days). Scale bar = 1 mm.
Western blot (WB) analysis in mouse prostate organoids for selected canonical and non‐canonical Tgf‐β signaling mediators, and the cell cycle inhibitor p21 (Activin A, 50 ng/ml; Tgfb1, 500 ng/ml; 24 h).
Schematic view of the non‐canonical Activin A pathway, including inhibitors used for the experiments described in this figure.
Representative stereoscopic images of mouse prostate organoids following treatment with Takinib (Tak1 inhibitor; 5 μM, 6 days), SB203580 (p38α/β inhibitor; 10 μM, 6 days) or the structurally unrelated Ralimetinib (p38α/β inhibitor; 1 μM, 7 days). Scale bar = 1 mm.
Nuclear/Cytoplasmic fractionation and Western blot analysis in mouse prostate organoids for selected signaling mediators in the presence or absence of SB203580 (p38α/β inhibitor; 10 μM, 24 h).
Gene set enrichment analysis (GSEA) plots displaying significant enrichment for inflammatory response and tumor necrosis factor (TNF) signaling in mouse prostate organoids cultured without A83‐01 (24 h) vs. complete medium (ENRAD).
Nuclear/Cytoplasmic fractionation and western blot analysis in mouse prostate organoids for selected cell cycle regulators, in the presence or absence of SB203580 (p38α/β inhibitor; 10 μM, 24 or 48 h).
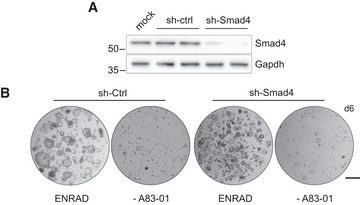
Western blot analysis for Smad4 in mouse prostate organoids upon short‐hairpin RNA mediated knockdown (sh‐Smad4) and in control conditions (sh‐Ctrl).
Representative stereoscopic images of control (sh‐Ctrl) and Smad4 knocked down (sh‐Smad4) mouse prostate organoids in normal growth condition (ENRAD) and following A83‐01 withdrawal (‐A83‐01). Scale bar = 1 mm.
- A
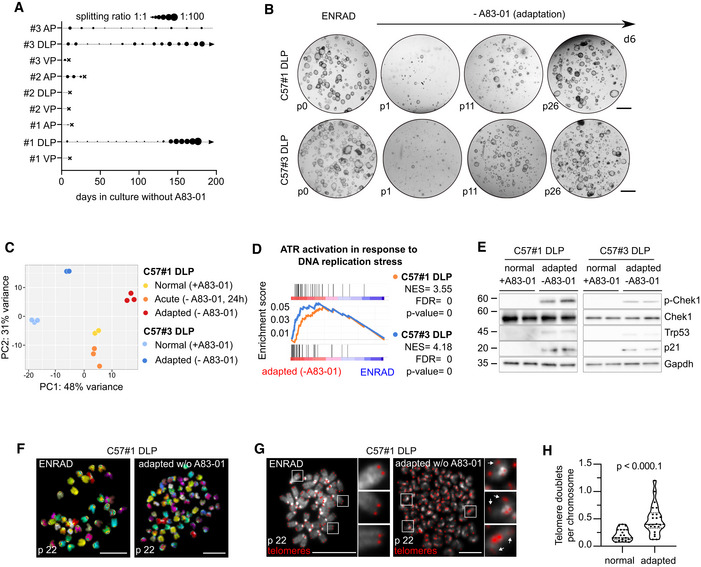
Diagram depicting the expansion of mouse prostate organoid cultures in the absence of the Tgf‐β ligand inhibitor A83‐01 (n = 3 biological replicates per lobe‐specific organoid culture; arrow = continuous expansion; dot = passage; cross = culture loss).
- B
Representative stereoscopic images of C57BL/6J DLP #1 and #3 mouse prostate organoid lines during adaptation in the absence of A83‐01. Scale bar = 1 mm.
- C
Principal component analysis (PCA) based on bulk RNA‐sequencing of C57#1 DLP and C57#3 DLP mouse prostate organoids cultured in normal conditions (ENRAD; n = 3 biological replicates, C57#1 DLP; n = 3 biological replicates, C57#3 DLP), upon acute A83‐01 depletion (‐A83‐01, 24 h; n = 3 biological replicates, C57#1 DLP only) or adaptation (‐A83‐01, long‐term; n = 3 biological replicates, C57#1 DLP; n = 3 biological replicates, C57#3 DLP).
- D
Gene set enrichment analysis (GSEA) plot displaying significant enrichment for activation of ATR signaling in mouse prostate organoid lines (C57#1 DLP, top; C57#3 DLP, bottom) adapted to grow in the absence of A83‐01 vs. normal control organoids cultured in complete medium (ENRAD).
- E
Western blot analysis in C57#1 and C57#3 DLP mouse prostate organoid lines adapted to grow in the absence of A83‐01 vs. normal control organoids cultured in complete medium (ENRAD). Immunoblots are displayed for Chek1 (ATR signaling mediator), Trp53 and p21.
- F
Representative spectral karyotype (SKY) images of metaphase spreads obtained from C57#1 DLP mouse prostate organoids cultured in normal conditions (ENRAD) or upon adaptation without A83‐01. Widespread genomic instability is observed following adaptation. Scale bars = 5 µm.
- G, H
Representative telomere FISH images—and quantification (n = 2 biological replicates, 20 metaphases per condition)—in C57#1 DLP mouse prostate organoids cultured in normal conditions (ENRAD) or upon adaptation without A83‐01. Widespread telomeric instability is observed following adaptation (arrows indicate telomere doublets, one‐way ANOVA, scale bars = 10 µm).
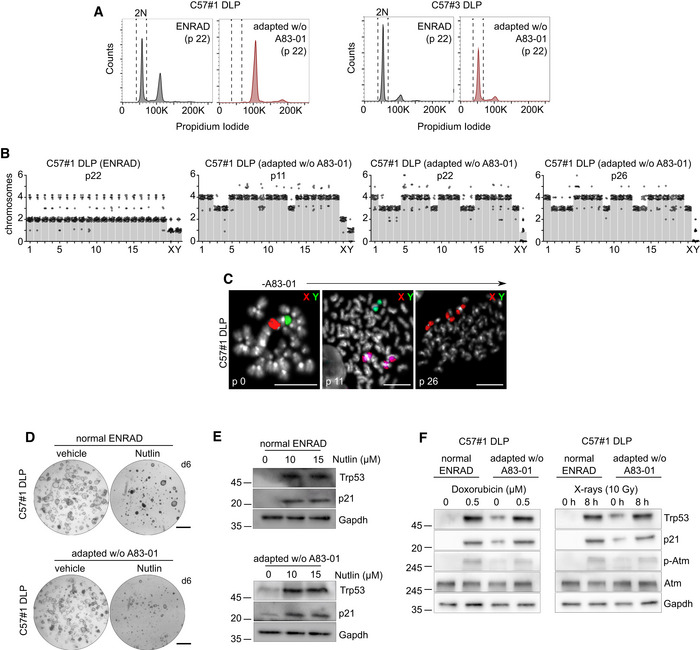
DNA content analysis in C57#1 DLP and C57#3 DLP mouse prostate organoid lines.
Quantification of spectral karyotype (SKY) longitudinal analysis in C57#1 DLP mouse prostate organoids undergoing adaptation to the absence of A83‐01 in culture (related to Fig 3F). During adaptation, an early genome duplication event is observed followed by selective chromosome loss and gains, and leading to subtetraploidy (n = 2 biological replicates, 25 metaphases/condition).
Representative dual‐color FISH images for X and Y chromosomes in C57#1 DLP mouse prostate organoids during adaptation to the absence of A83‐01 in culture. This analysis confirmed a progressive sex chromosome imbalance during adaptation. Scale bars = 5 μm.
Representative stereoscopic images of C57#1 DLP mouse prostate organoids treated with Nutlin, or vehicle as control. Scale bar = 1 mm.
Western blot analysis of C57#1 DLP mouse prostate organoids described in (D).
Western blot analysis in C57#1 DLP mouse prostate organoids treated with doxorubicin or X‐rays. C57#1 DLP mouse prostate organoids retain a functional p53 pathway.
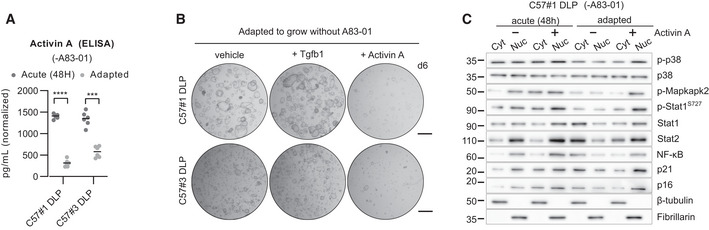
Enzyme‐linked immunosorbent assay (ELISA) for Activin A expression in the supernatant of C57#1 and C57#3 DLP mouse prostate organoid lines, upon acute A83‐01 removal (48 h) or long‐term adaptation (n = 6 biological replicates). Two‐way ANOVA, Sidak's test, P‐value *** (< 0.001), **** (< 0.0001).
Representative stereoscopic images of C57#1 and C57#3 DLP mouse prostate organoid lines adapted to the absence of A83‐01 and subsequently treated with either Tgfb1 (500 ng/ml, 6 days) or Activin A (50 ng/ml, 6 days). Scale bar = 1 mm.
Western blot analysis in the C57#1 DLP mouse prostate organoid line upon acute removal (24 h) or long‐term adaptation to A83‐01 removal, in the presence or absence of Activin A (50 ng/ml, 24 h).
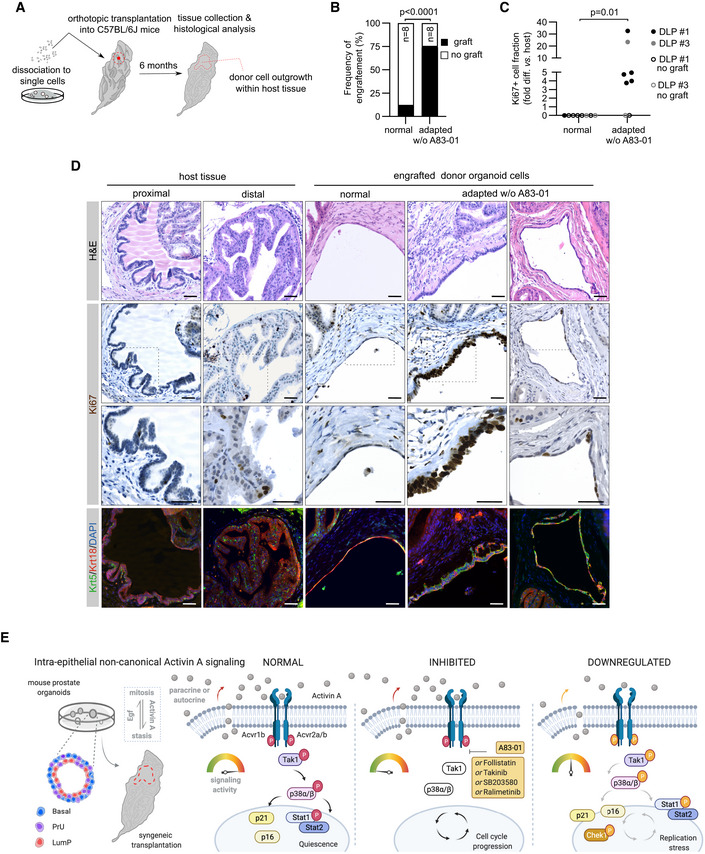
Schematic view of the orthotopic transplantation strategy into the anterior prostate lobe of immunocompetent syngeneic C57BL/6J mice.
Frequency of engraftment (%) of mouse prostate organoid lines (C57#1 DLP and C57#3 DLP) expanded in complete medium (normal C57#1 n = 8 mice, normal C57#3 n = 2 mice) or adapted to the absence of A83‐01 (adapted C57#1 n = 8 mice, adapted C57#3 n = 2 mice; Binomial test, two‐tailed).
Normalized mitotic (Ki67+) cell index in grafts of mouse prostate organoid lines (C57#1 DLP and C57#3 DLP) expanded incomplete medium conditions (normal) or adapted to the absence of A83‐01 (non‐parametric Mann–Whitney test).
Representative H&E, IF, and immunohistochemistry (IHC) analyses of host prostate tissue and engrafted donor organoid cells. Scale bar = 50 μm.
Model of the molecular pathway primed by Activin A to safeguard quiescence in adult prostate progenitors.
References
-
- Bailey P, Chang DK, Nones K, Johns AL, Patch A‐M, Gingras M‐C, Miller DK, Christ AN, Bruxner TJC, Quinn MC et al (2016) Genomic analyses identify molecular subtypes of pancreatic cancer. Nature 531: 47–52 - PubMed
-
- Berardinelli F, Tanori M, Muoio D, Buccarelli M, di Masi A, Leone S, Ricci‐Vitiani L, Pallini R, Mancuso M, Antoccia A (2019) G‐quadruplex ligand RHPS4 radiosensitizes glioblastoma xenograft in vivo through a differential targeting of bulky differentiated‐ and stem‐cancer cells. J Exp Clin Cancer Res 38: 311 - PMC - PubMed
-
- de Bono JS, Guo C, Gurel B, De Marzo AM, Sfanos KS, Mani RS, Gil J, Drake CG, Alimonti A (2020) Prostate carcinogenesis: inflammatory storms. Nat Rev Cancer 20: 455–469 - PubMed
Publication types
MeSH terms
Substances
Grants and funding
LinkOut - more resources
Full Text Sources
Research Materials
Miscellaneous
