

An engineered bacterial therapeutic lowers urinary oxalate in preclinical models and in silico simulations of enteric hyperoxaluria
- PMID: 35253995
- PMCID: PMC8899768
- DOI: 10.15252/msb.202110539
An engineered bacterial therapeutic lowers urinary oxalate in preclinical models and in silico simulations of enteric hyperoxaluria
Abstract
Enteric hyperoxaluria (EH) is a metabolic disease caused by excessive absorption of dietary oxalate leading to the formation of chronic kidney stones and kidney failure. There are no approved pharmaceutical treatments for EH. SYNB8802 is an engineered bacterial therapeutic designed to consume oxalate in the gut and lower urinary oxalate as a potential treatment for EH. Oral administration of SYNB8802 leads to significantly decreased urinary oxalate excretion in healthy mice and non-human primates, demonstrating the strain's ability to consume oxalate in vivo. A mathematical modeling framework was constructed that combines in vitro and in vivo preclinical data to predict the effects of SYNB8802 administration on urinary oxalate excretion in humans. Simulations of SYNB8802 administration predict a clinically meaningful lowering of urinary oxalate excretion in healthy volunteers and EH patients. Together, these findings suggest that SYNB8802 is a promising treatment for EH.
Keywords: engineered bacteria; enteric hyperoxaluria; in silico modeling; oxalate; synthetic biology.
© 2022 Synlogic. Published under the terms of the CC BY 4.0 license.
Figures
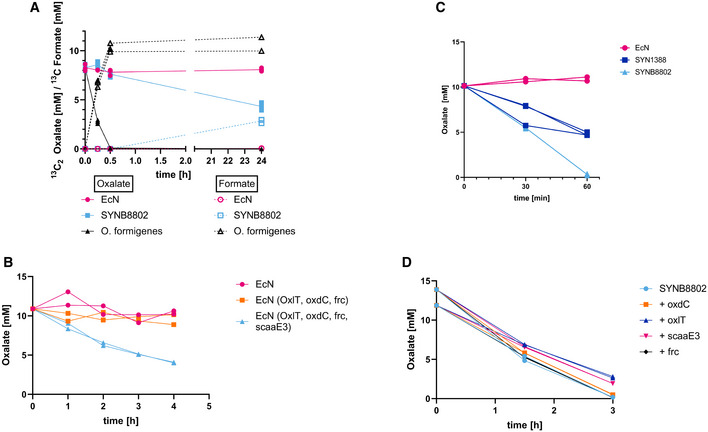
SYNB8802 vs. Oxalobacter formigenes. Left y‐axis: 13C2‐oxalate in mM, 13C‐formate in mM, x‐axis: time in hours. Oxalobacter formigenes (black, triangle, solid line: oxalate, dotted line: formate). SYNB8802 (light blue, square, solid line: oxalate, dotted line: formate). The control EcN (pink, circle, solid line: oxalate, dotted line: formate). Biological triplicates were run and plotted separately.
Scaae3 is needed for oxalate degradation in EcN. Y‐axis shows oxalate in mM. X‐axis: time in hours. Wild type EcN (pink, circle). EcN expressing the OF genes oxdC, oxlT, and frc on p15a (orange, square). EcN expressing the OF genes including scaaE3 on p15a (light blue, triangle). Biological duplicates were run and plotted separately.
SYNB8802 vs. SYN1388. Y‐axis shows oxalate in mM. X‐axis: time in minutes. Wild type EcN (pink, circle). Prototype strain SYN1388 (blue, square). SYNB8802 (light blue, triangle). Biological duplicates were run and plotted separately.
Overexpression of individual pathway components. Y‐axis shows oxalate in mM. X‐axis: time in hours. SYNB8802 (blue, circle). SYNB8802, with added plasmid‐based expression of oxdC (orange, square). SYNB8802, with added plasmid‐based expression of oxlT (blue, triangle). SYNB8802, with added plasmid‐based expression of scaaE3 (pink, triangle). SYNB8802, with added plasmid‐based expression of frc (black, diamond). Biological duplicates were run and plotted separately.
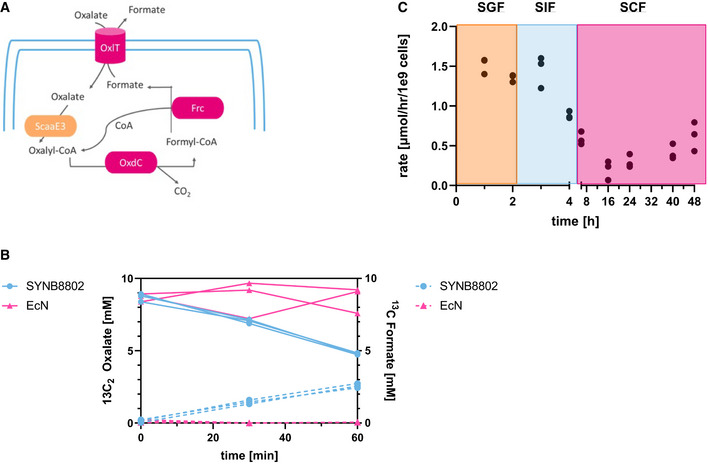
Schematic depicting SYNB8802 oxalate degradation pathway Abbreviations: CO2 = carbon dioxide; Frc = formyl‐CoA transferase; OxdC = oxalate decarboxylase; OxlT = oxalate/formate antiporter; ScaaE3 = oxalyl‐CoA synthetase.
In vitro activity. Left y‐axis: 13C2‐oxalate in mM, right y‐axis: 13C‐formate in mM, x‐axis: time in minutes. SYNB8802 (blue, circles, solid line: oxalate, dotted line: formate). The control EcN (pink, triangle, solid line: oxalate, dotted line: formate). Three biological replicates were run and plotted separately.
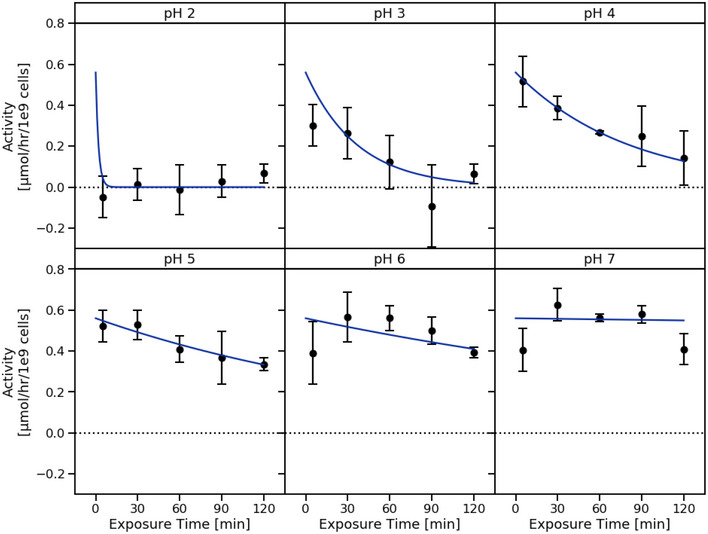
In vitro simulation (IVS). Left y‐axis: Rate of oxalate degradation in μmol/h/109 cells. X‐axis = time in hours. Left X‐axis 0–4 h, Right X‐axis 6–48 h. Three biological replicates were run and plotted separately. Data points in the orange box represent incubation in simulated gastric fluid. Data points in the light blue box represent incubation in simulated intestinal fluid. Data points in the pink box represent incubation in simulated colonic fluid.
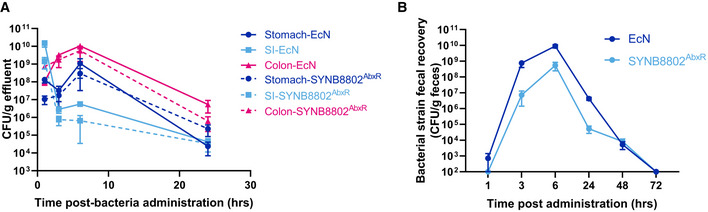
EcN and SYNB8802AbxR in vivo kinetics. Abundance of EcN or SYNB8802AbxR in gut effluents of healthy mice following single oral dose of bacteria. Data represented as mean ± SEM, n = 4/group/timepoint. Full lines represent EcN and hatched lines represent SYNB8802AbxR.
EcN and SYNB8802AbxR fecal clearance. Abundance of EcN or SYNB8802AbxR in fecal pellets of healthy mice following single oral dose of bacteria. Data represented as mean ± SEM, n = 5/group. Dark blue curve represents EcN and light blue curve represent SYNB8802AbxR.
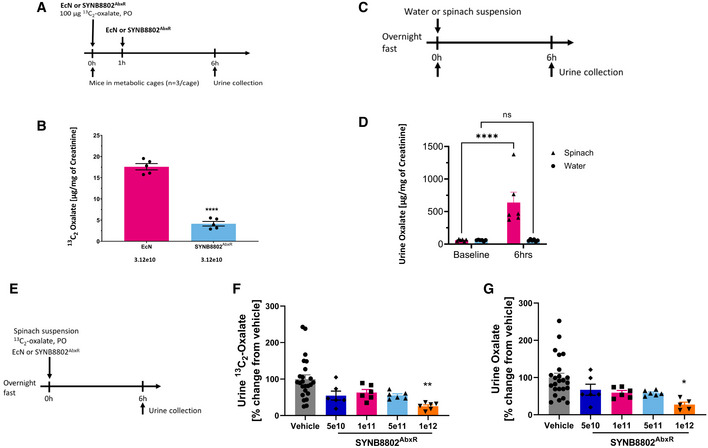
Acute mouse study design.
Acute mouse study of UOx lowering with SYNB8802. The y‐axis shows the urinary 13C2‐oxalate normalized to creatine. The x‐axis shows the two groups, EcN (control, pink) versus SYNB8802AbxR (light blue; n = 15 mice per group). Individual dots represent each metabolic cage (n = 3 mice per metabolic cage). Error bars are calculated as SEM (unpaired t‐test with Welch's correction, ****P < 0.0001).
Non‐human primate model development study design.
Non‐human primate model development study. The y‐axis shows urinary oxalate (UOx) normalized to creatine. X‐axis shows baseline UOx levels after overnight fast, and UOx measured 6 h post‐administration of either a spinach preparation (triangle, pink) or water (circle, blue) (n = 6 for each group). Individual dots represent individual animals. Error bars are calculated as SEM (two‐way ANOVA followed by Sidak's multiple comparison analysis, ****P < 0.0001).
Study design for urinary recovery of oxalate in non‐human primates.
Urinary recovery of oxalate in non‐human primates. The y‐axis shows change in UOx from vehicle control. The x‐axis shows vehicle (control, grey) and increasing doses of SYNB8802AbxR (n = 24 for vehicle, n = 6 for treatment groups). Individual dots represent normalized UOx for each individual animal. Error bars are calculated as SEM (One‐way ANOVA followed by Tukey's multiple comparison analysis, *P < 0.05).
Urinary recovery of 13C2 oxalate in non‐human primates. The y‐axis shows change in urinary 13C2‐oxalate from vehicle control. The x‐axis shows vehicle (control, grey) and increasing doses of SYNB8802AbxR (n = 24 for vehicle, n = 6 for treatment groups). Individual dots represent normalized urinary 13C2‐oxalate for each individual animal. Error bars are calculated as SEM (one‐way ANOVA followed by Tukey's multiple comparison analysis, **P < 0.01).
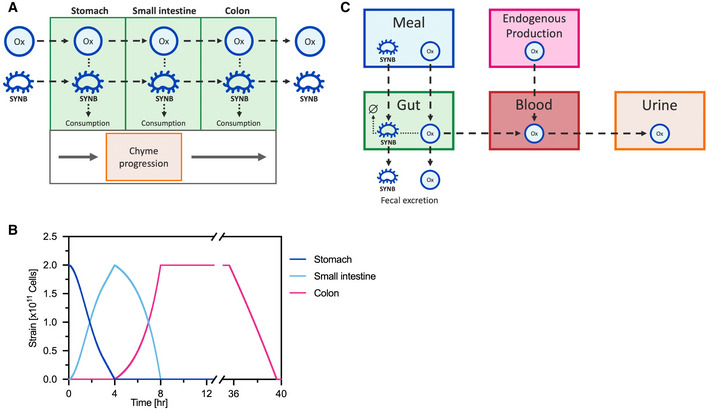
Oxalate and SYNB8802 transit through the stomach, small intestine, and colon are modeled according to a physiological function of chyme progression. Oxalate absorption and consumption occur sequentially in as chyme transits through the three compartments.
SYNB8802 begins in the stomach and empties into the small intestine during the first 4 h post‐meal. From 4 to 8 h post‐meal, SYNB8802 empties from the small intestine into the colon. Approximately 36 h post‐meal, SYNB8802 begins to empty from the colon via fecal excretion.
ISS connects in vitro strain activity knowledge to host and disease biology. The strain‐side model (green) simulates the consumption of oxalate by SYNB8802 within the gastrointestinal physiology. The host‐side model (overall schematic) simulates the impact of consumption by SYNB8802 on the distribution of oxalate throughout the body.
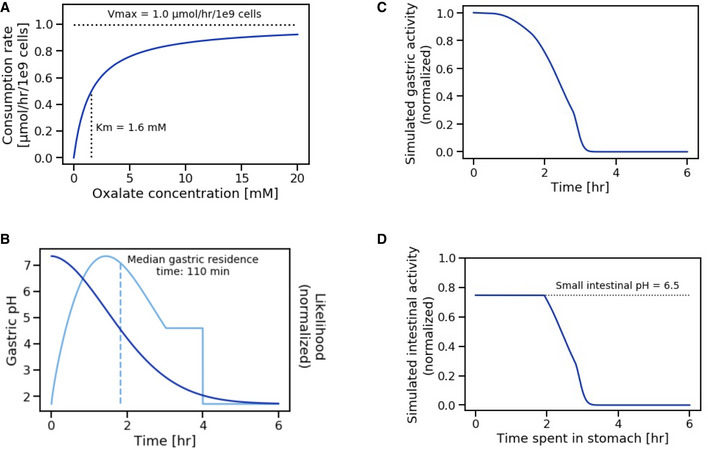
Michaelis–Menten model of strain activity kinetics. Vmax defines the maximal strain activity velocity (consumption rate of oxalate by SYNB8802). Km defines the oxalate concentration at which half‐maximal strain activity velocity occurs. Vmax and Km were determined through in vitro simulation.
Simulated gastric pH as a function of time following a solid meal (dark blue). This function is a power exponential decay with a half‐life of 110 min and a shape parameter equal to 1.81. Likelihood of time spent in the stomach based on gastric residence time distribution (light blue). The distribution is truncated to a maximum of 4 h and the median gastric residence time is 110 min.
Simulated normalized SYNB8802 activity in the stomach as a function of time.
Simulated normalized SYNB8802 activity in the small intestine as a function of time previously spent in the stomach. Function is equivalent to gastric function with an upper limit imposed based on intestinal pH.
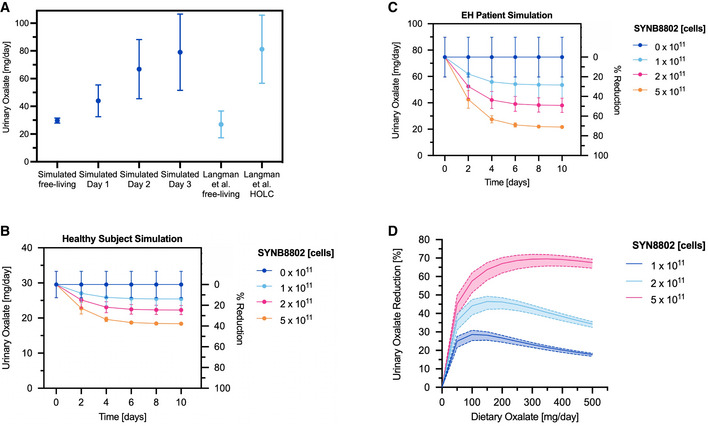
Validation of simulated UOx excretion against clinical data. Simulated UOx on a free‐living diet and on 3 days of a high‐oxalate diet (dark blue). Observed UOx on a free‐living diet and on 3 days of a high‐oxalate, low‐calcium (HOLC) diet (light blue); points and error bars represent mean and standard deviation, respectively, across 30 simulated healthy subjects.
Simulated UOx and UOx reduction for healthy subjects consuming 200 mg/day dietary oxalate without SYNB8802 and with 1 × 10¹¹, 2 × 10¹¹, and 5 × 10¹¹ SYNB8802 cells TID over 10 days. Points represent simulations under a baseline assumption of dietary oxalate absorption in healthy subjects (Holmes et al, 2001) (See Materilas and Methods for a detailed description). Error bars represent a simulated range of dietary oxalate absorption (two simulations: 0.75× baseline and 1.25× baseline).
Simulated UOx and UOx reduction for enteric hyperoxaluria patients consuming 200 mg/day dietary oxalate without SYNB8802 and with 1 × 10¹¹, 2 × 10¹¹, and 5 × 10¹¹ SYNB8802 cells TID over 10 days. Points represent simulations under a baseline assumption of increased dietary oxalate absorption in HOX patients (4× healthy absorption). Error bars represent a simulated range of increased dietary oxalate absorption (two simulations: 3× healthy absorption and 5× healthy absorption).
Simulated UOx reduction for enteric hyperoxaluria patients after 5 days dosing with 1 × 10¹¹, 2 × 10¹¹, and 5 × 10¹¹ SYNB8802 cells TID as a function of dietary intake of oxalate. Solid curves represent simulations under a baseline assumption of increased dietary oxalate absorption in HOX patients (4× healthy absorption). Shaded regions represent a simulated range of increased dietary oxalate absorption (two simulations: 3× healthy absorption and 5× healthy absorption).
Similar articles
-
Subsequent urinary stone events are predicted by the magnitude of urinary oxalate excretion in enteric hyperoxaluria.Nephrol Dial Transplant. 2021 Dec 2;36(12):2208-2215. doi: 10.1093/ndt/gfaa281. Nephrol Dial Transplant. 2021. PMID: 33367720 Free PMC article.
-
The Effect of Calcium and Vitamin B6 Supplementation on Oxalate Excretion in a Rodent Gastric Bypass Model of Enteric Hyperoxaluria.Urology. 2019 Feb;124:310.e9-310.e14. doi: 10.1016/j.urology.2018.06.061. Epub 2018 Nov 7. Urology. 2019. PMID: 30412704
-
Plasma oxalate in relation to eGFR in patients with primary hyperoxaluria, enteric hyperoxaluria and urinary stone disease.Clin Biochem. 2017 Dec;50(18):1014-1019. doi: 10.1016/j.clinbiochem.2017.07.017. Epub 2017 Jul 29. Clin Biochem. 2017. PMID: 28764885 Free PMC article.
-
Pathophysiology and management of enteric hyperoxaluria.Clin Res Hepatol Gastroenterol. 2024 May;48(5):102322. doi: 10.1016/j.clinre.2024.102322. Epub 2024 Mar 19. Clin Res Hepatol Gastroenterol. 2024. PMID: 38503362 Review.
-
Enteric hyperoxaluria: role of microbiota and antibiotics.Curr Opin Nephrol Hypertens. 2019 Jul;28(4):352-359. doi: 10.1097/MNH.0000000000000518. Curr Opin Nephrol Hypertens. 2019. PMID: 31145706 Review.
Cited by
-
Robust performance of a live bacterial therapeutic chassis lacking the colibactin gene cluster.PLoS One. 2023 Feb 2;18(2):e0280499. doi: 10.1371/journal.pone.0280499. eCollection 2023. PLoS One. 2023. PMID: 36730255 Free PMC article.
-
Engineered microorganisms: A new direction in kidney stone prevention and treatment.Synth Syst Biotechnol. 2024 Mar 8;9(2):294-303. doi: 10.1016/j.synbio.2024.02.005. eCollection 2024 Jun. Synth Syst Biotechnol. 2024. PMID: 38510204 Free PMC article. Review.
-
Role of oxalic acid in fungal and bacterial metabolism and its biotechnological potential.World J Microbiol Biotechnol. 2024 Apr 25;40(6):178. doi: 10.1007/s11274-024-03973-5. World J Microbiol Biotechnol. 2024. PMID: 38662173 Free PMC article. Review.
-
A Review of Clinical Trials Involving Genetically Modified Bacteria, Bacteriophages and Their Associated Risk Assessments.Appl Biosaf. 2024 Dec 16;29(4):186-206. doi: 10.1089/apb.2024.0002. eCollection 2024 Dec. Appl Biosaf. 2024. PMID: 39735407 Free PMC article. Review.
-
Next-generation probiotics and engineered BEVs for precision therapeutics in osteoporosis.Front Nutr. 2025 Jul 1;12:1581971. doi: 10.3389/fnut.2025.1581971. eCollection 2025. Front Nutr. 2025. PMID: 40667443 Free PMC article. Review.
References
MeSH terms
Substances
Associated data
- Actions
LinkOut - more resources
Full Text Sources
Other Literature Sources
