. 2022 Apr 20;60(4):e0242921.
doi: 10.1128/jcm.02429-21. Epub 2022 Mar 7.

Prevalence and Mortality Associated with Bloodstream Organisms: a Population-Wide Retrospective Cohort Study

Affiliations

Prevalence and Mortality Associated with Bloodstream Organisms: a Population-Wide Retrospective Cohort Study

Mark Verway et al. J Clin Microbiol. .

Abstract

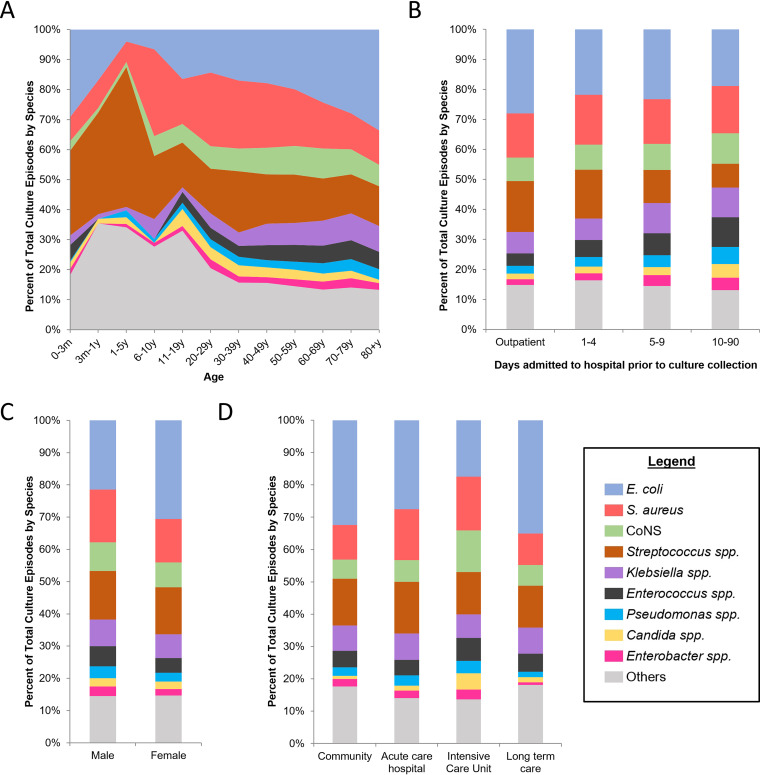
Bloodstream infections (BSIs) represent a substantial mortality risk, yet most studies are limited to select pathogens or populations. The aim of this study was to describe the population-wide prevalence of BSIs and examine the associated mortality risk for the responsible microorganisms. We conducted a population-wide retrospective cohort study of BSIs in Ontario in 2017. Blood culture data was collected from almost all microbiology laboratories in Ontario and linked to data sets of patient characteristics. For each organism, we determined the prevalence and crude mortality risk, and using logistic regression models, the adjusted odds of 30-day mortality was calculated relative to patients with negative blood cultures and matched patients without blood culture testing. From 531,065 blood cultures, we identified 22,935 positive BSI episodes in 19,326 patients, for an incidence of 150 per 100,000 population. The most frequently isolated organisms were Escherichia coli, Staphylococcus aureus, coagulase-negative staphylococci, Klebsiella species, and Enterococcus species with 40.2, 22.4, 12.1, 11.1, and 7.1 episodes per 100,000 population respectively. BSI episodes were associated with 17.0% mortality at 30 days. Compared to patients with negative cultures, the adjusted 30-day mortality risk for positive BSIs was 1.47 (95% confidence interval (CI), 1.41 to 1.54) and compared to matched patients without blood culture testing was 2.62 (95% CI, 2.52 to 2.73). Clostridium species were associated with the highest adjusted odds of mortality compared to that of negative cultures (adjusted odds ratio, 5.81; 95% CI, 4.00 to 8.44). Among high incidence pathogens, Staphylococcus aureus had the highest odds ratio of mortality (adjusted odds ratio, 2.14; 95% CI, 1.94 to 2.36). BSIs are associated with increased mortality risk, varying across organisms.

Keywords: bacteremia; bloodstream infection; population; surveillance.


Conflict of interest statement

The authors declare no conflict of interest.

Figures

FIG 1
FIG 1
Flow diagram of blood culture data processing. Blood culture data collected was first clustered into episodes, followed by exclusion of episodes for which there was incomplete or incorrect data. Remaining episodes were divided into negative or positive episodes. Percentages are expressed relative to the preceding total.
FIG 2
FIG 2
Distribution of microorganisms by demographic characteristics. (A) Plot of microorganisms against age. (B) Bar graphs of microorganisms for outpatient (community and long-term care) and patients admitted to acute care and ICU over the course of hospitalization (1 to 90+ days). (C) Bar graphs comparing microorganisms between men and women. (D) Bar graphs comparing microorganisms by location of culture collection. For panels A to D, data in each column is expressed as a proportion of total positive culture episodes, with legend in bottom right identifying corresponding microorganisms. All microorganisms which each comprised less than 2.5% of total culture episodes are clustered together as “Others.”
FIG 3
FIG 3
Incidence and lethality of bloodstream infection (BSI) organisms. In this bubble plot, microorganisms are plotted by total number of BSI episodes (x axis) against crude percent mortality at 30 days (y axis) following culture episodes yielding that microorganism. Bubble areas are scaled to total number of deaths at 30 days associated with the listed microorganism as expressed in the legend. Color scaling represents the adjusted odds ratio (OR) for 30-day mortality relative to patients with a negative culture episode, calculated by generalized linear mixed models (GLMM), with increasing blue hue when close to or less than an OR of 1 and transitioning through white and red for an increasing OR as expressed in the legend.

References

    1. Goto M, Al-Hasan MN. 2013. Overall burden of bloodstream infection and nosocomial bloodstream infection in North America and Europe. Clin Microbiol Infect 19:501–509. 10.1111/1469-0691.12195. - DOI - PubMed
    1. Diekema DJ, Hsueh P-R, Mendes RE, Pfaller MA, Rolston KV, Sader HS, Jones RN. 2019. The microbiology of bloodstream infection: 20-year trends from the SENTRY antimicrobial surveillance program. Antimicrob Agents Chemother 63:e00355-19. 10.1128/AAC.00355-19. - DOI - PMC - PubMed
    1. Søgaard M, Nørgaard M, Dethlefsen C, Schønheyder HC. 2011. Temporal changes in the incidence and 30-day mortality associated with bacteremia in hospitalized patients from 1992 through 2006: a population-based cohort study. Clin Infect Dis 52:61–69. 10.1093/cid/ciq069. - DOI - PubMed
    1. Nielsen SL, Lassen AT, Gradel KO, Jensen TG, Kolmos HJ, Hallas J, Pedersen C. 2015. Bacteremia is associated with excess long-term mortality: a 12-year population-based cohort study. J Infect 70:111–126. 10.1016/j.jinf.2014.08.012. - DOI - PubMed
    1. Skogberg K, Lyytikäinen O, Ollgren J, Nuorti JP, Ruutu P. 2012. Population-based burden of bloodstream infections in Finland. Clin Microbiol Infect 18:E170–E176. 10.1111/j.1469-0691.2012.03845.x. - DOI - PubMed

Publication types