. 2022 Apr 26;13(2):e0293321.
doi: 10.1128/mbio.02933-21. Epub 2022 Mar 7.

An Alanine Aminotransferase Is Required for Biofilm-Specific Resistance of Aspergillus fumigatus to Echinocandin Treatment

Affiliations

An Alanine Aminotransferase Is Required for Biofilm-Specific Resistance of Aspergillus fumigatus to Echinocandin Treatment

Joshua D Kerkaert et al. mBio. .

Abstract

Alanine metabolism has been suggested as an adaptation strategy to oxygen limitation in organisms ranging from plants to mammals. Within the pulmonary infection microenvironment, Aspergillus fumigatus forms biofilms with steep oxygen gradients defined by regions of oxygen limitation. An alanine aminotransferase, AlaA, was observed to function in alanine catabolism and is required for several aspects of A. fumigatus biofilm physiology. Loss of alaA, or its catalytic activity, results in decreased adherence of biofilms through a defect in the maturation of the extracellular matrix polysaccharide galactosaminogalactan (GAG). Additionally, exposure of cell wall polysaccharides is also impacted by loss of alaA, and loss of AlaA catalytic activity confers increased biofilm susceptibility to echinocandin treatment, which is correlated with enhanced fungicidal activity. The increase in echinocandin susceptibility is specific to biofilms, and chemical inhibition of alaA by the alanine aminotransferase inhibitor β-chloro-l-alanine is sufficient to sensitize A. fumigatus biofilms to echinocandin treatment. Finally, loss of alaA increases susceptibility of A. fumigatus to in vivo echinocandin treatment in a murine model of invasive pulmonary aspergillosis. Our results provide insight into the interplay of metabolism, biofilm formation, and antifungal drug resistance in A. fumigatus and describe a mechanism of increasing susceptibility of A. fumigatus biofilms to the echinocandin class of antifungal drugs. IMPORTANCE Aspergillus fumigatus is a ubiquitous filamentous fungus that causes an array of diseases depending on the immune status of an individual, collectively termed aspergillosis. Antifungal therapy for invasive pulmonary aspergillosis (IPA) or chronic pulmonary aspergillosis (CPA) is limited and too often ineffective. This is in part due to A. fumigatus biofilm formation within the infection environment and the resulting emergent properties, particularly increased antifungal resistance. Thus, insights into biofilm formation and mechanisms driving increased antifungal drug resistance are critical for improving existing therapeutic strategies and development of novel antifungals. In this work, we describe an unexpected observation where alanine metabolism, via the alanine aminotransferase AlaA, is required for several aspects of A. fumigatus biofilm physiology, including resistance of A. fumigatus biofilms to the echinocandin class of antifungal drugs. Importantly, we observed that chemical inhibition of alanine aminotransferases is sufficient to increase echinocandin susceptibility and that loss of alaA increases susceptibility to echinocandin treatment in a murine model of IPA. AlaA is the first gene discovered in A. fumigatus that confers resistance to an antifungal drug specifically in a biofilm context.

Keywords: Aspergillus fumigatus; alanine; antifungal drugs; biofilm; biofilms; cell wall; echinocandin; echinocandins; extracellular matrix; galactosaminogalactan; hypoxia; metabolism.


Conflict of interest statement

The authors declare no conflict of interest.

Figures

FIG 1
FIG 1
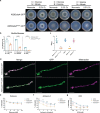
An alanine aminotransferase is required for alanine catabolism and normal biofilm physiology. (A) Reaction catalyzed by AlaA and its position in central carbon and nitrogen metabolism. (B) Growth of Af293ΔalaA strain on minimal medium containing the indicated sole carbon and nitrogen sources in ambient oxygen (normoxia) and 0.2% oxygen environments. Images are representative of four replicate cultures. (C) Dry biomass of biofilms grown in minimal medium containing the indicated sole carbon and nitrogen sources for 24 h (n = 4). Each replicate is shown along with the means ± standard deviations (SD). (D) Representative static growth assay of Af293ΔalaA strain over 24 h of biofilm growth (n = 6 technical replicates). The experiment was repeated at least three times with similar results. (E) Crystal violet adherence assay of biofilms grown for 12, 18, 24, and 30 h (n = 3). (F) Oxygen concentration as a function of distance from the air-liquid interface in 24-h biofilms (n ≥ 7). Culture volumes are approximately 3,000 μm in depth. **, P < 0.01; ***, P < 0.001; ****, P < 0.0001; ns, not significant by either two-way analysis of variance (ANOVA) with a Tukey’s multiple-comparison test (C, E, and F) or one-way ANOVA with a Tukey’s multiple-comparison test (D). All graphs show the means ± SD unless otherwise stated.
FIG 2
FIG 2
Catalytic activity of AlaA is required for alanine catabolism, adherence of biofilms, and mitochondrial function. (A) Growth of Af293alaAK322A-GFP strain on minimal medium containing the indicated sole carbon and nitrogen sources in ambient oxygen (normoxia) and 0.2% oxygen environments. Images are representative of four replicate cultures. (B) Dry biomass of biofilms grown in minimal medium containing the indicated sole carbon and nitrogen sources (n ≥ 3). Each replicate along with the means ± SD are shown. ****, P < 0.0001 as determined by two-way ANOVA with a Tukey’s multiple-comparison test. (C) Crystal violet adherence assay of 24-h biofilms (n = 6). Each replicate along with the means ± SD are shown. a versus b, P < 0.0001 in all comparisons as determined by one-way ANOVA with a Tukey’s multiple-comparison test. (D) Representative micrographs of germlings containing C-terminal GFP-tagged AlaA alleles (green) stained with MitoTracker Deep Red FM (magenta). (E to G) Twenty-four-hour biofilms were established in the absence of drug and treated with rotenone (E), antimycin A (F), or KCN (G) at the indicated concentrations for 3 h, and viability was determined by XTT assay. Means ± SD are shown for n = 4 for each experiment. *, P < 0.05; **, P < 0.01; ***, P < 0.001; ****, P < 0.0001 as determined by two-way ANOVA with a Tukey’s multiple-comparison test. The highest P value for Af293ΔalaA strain compared to both Af293 and Af293alaArec strains is shown.
FIG 3
FIG 3
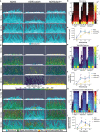
Loss of alaA alters extracellular matrix staining by the galactosaminogalactan binding lectin SBA. (A) Representative image renderings of biovolume in the first 300 μm of biofilms grown for 12, 18, 24, and 30 h. Biofilms were stained with calcofluor white and FITC-SBA, followed by fixing with paraformaldehyde. Biovolume was determined by segmentation of the calcofluor white stain of each image. (B) Heatmap of biovolume as a function of height from the base of the biofilm. (C) Global segmented biovolume quantifications of each biofilm. (D) Representative image renderings of FITC-SBA staining intensity corresponding to biomass images in panel A. Renderings show FITC-SBA matrix intensity mapped onto the segmented FITC-SBA stain. a.u., arbitrary units. (E) Heatmap of FITC-SBA intensity as a function of height from the base of the biofilm. (F) Sum intensity quantification of FITC-SBA staining for each biofilm. (G) Representative merged image renderings of the segmented biovolume (calcofluor white), shown in blue, and segmented FITC-SBA stain, shown in orange. Hyphal associated SBA staining will appear green as a result of the overlap between the two channels. SBA was considered hyphal associated or non-hyphal associated based on overlap in the segmented biomass. (H) Heatmap of hyphal associated FITC-SBA intensity as a function of height from the base of the biofilm. (I) Sum intensity quantification of hyphal associated FITC-SBA staining for each biofilm. Each graph and heatmap shows the individual replicates for each time point (n = 6). For panels C, F, and I, the line goes through the mean of each time point. *, P < 0.05; ***, P < 0.001; ****, P < 0.0001; ns, not significant as determined by two-way ANOVA with a Tukey’s multiple comparison test (C, F, and I).
FIG 4
FIG 4
alaA is required for proper deacetylation of galactosaminogalactan. (A) Monosaccharide analysis of extracellular matrix polysaccharides (n = 3). *, P < 0.05; ns, not significant by two-way ANOVA with a Tukey’s multiple-comparison test. (B) Enzyme-linked lectin assay (ELLA) of biofilm extracellular matrix left untreated or treated with recombinant Agd3. a versus b, P < 0.05 for all comparisons as determined by two-way ANOVA with a Tukey’s multiple-comparison test. (C and D) Expression of uge3 (C) and agd3 (D) in 24-h biofilm cultures as determined by RT-qPCR. *, P < 0.05; ***, P < 0.001 as determined by one-way ANOVA with a Tukey’s multiple-comparison test for panels C and D. For all graphs, each replicate along with the means ± SD are shown.
FIG 5
FIG 5
Loss of alaA leads to cell wall changes and increased susceptibility of biofilms to echinocandins. Germlings were stained with calcofluor white to quantify total chitin content (A), FITC-wheat germ agglutinin (WGA) to quantify surface exposed chitin (B), and Dectin-1 Fc to quantify surface-exposed β-glucans (C). Each data point represents an individual germling across three independent cultures per strain for each cell wall stain, and the lines correspond to the means. *, P < 0.05; ****, P < 0.0001; ns, not significant as determined by one-way ANOVA with a Tukey’s multiple-comparison test. (D to F) Twenty-four-hour biofilms were established in the absence of drug and treated with calcofluor white (D), caspofungin (E), or micafungin (F) at the indicated concentrations for 3 h, and viability was determined by XTT assay. Means ± SD are shown for n ≥ 3 experiments. ****, P < 0.0001 as determined by two-way ANOVA with a Tukey’s multiple-comparison test. The highest P value for Af293ΔalaA strain compared to both Af293 and Af293alaArec strains is shown. (G) Af293alaAK322A-GFP biofilms were grown for 24 h and treated with caspofungin at the indicated concentrations for 3 h, and viability was determined by XTT assay. Means ± SD are shown for n = 3 replicates. ****, P < 0.0001 as determined by two-way ANOVA with a Tukey’s multiple-comparison test. The highest P values for Af293alaAK322A-GFP strain and Af293ΔalaA strain compared to Af293alaA-GFP strain are shown. No significant difference was observed between Af293alaAK322A-GFP strain and Af293ΔalaA strain. (H) CEA10ΔalaA biofilms were grown for 24 h and treated with caspofungin at the indicated concentrations for 3 h, and viability was determined by XTT assay. Means ± SD are shown for n = 3 replicates. ***, P < 0.001; ****, P < 0.0001 as determined by two-way ANOVA with a Tukey’s multiple-comparison test. The highest P values for CEA10ΔalaA strain compared to both CEA10 and CEA10alaArec strains are shown. (I) Adenylate kinase release assay as a quantification of cell lysis. Twenty-four-hour biofilms were treated with 1 μg/mL caspofungin (left) or micafungin (right) for 3 h, and supernatant adenylate kinase activity was quantified. Each replicate and the means are shown (n = 4). **, P < 0.01; ***, P < 0.001 as determined by two-way ANOVA with a Tukey’s multiple-comparison test.
FIG 6
FIG 6
Chemical inhibition of AlaA by β-chloro-l-alanine is sufficient to decrease adherence and increase susceptibility of biofilms to caspofungin. (A and B) Crystal violet adherence assay of 24-h biofilms grown in the presence of increasing concentrations of β-chloro-l-alanine. Each replicate is shown (n = 3) along with a nonlinear regression using a dose-response model (line) ± 95% confidence interval (shaded area). (C) Susceptibility of 24-h biofilms of Af293 (left), Af293ΔalaA (middle), and Af293alaArec (right) strains established in the presence of 0, 10, or 100 μM β-chloro-l-alanine. Biofilms were treated with the indicated concentrations of caspofungin for 3 h, and viability was assessed by XTT assay. Means ± SD are shown (n = 3).
FIG 7
FIG 7
alaA is required for echinocandin resistance in vivo. (A) Experimental outline for determining in vivo echinocandin resistance using a chemotherapy model of invasive aspergillosis. Outbred CD1 mice were immunosuppressed with 150 mg/kg cyclophosphamide 48 h prior to fungal challenge and 40 mg/kg triamcinolone 24 h prior to fungal challenge. Mice were challenged with A. fumigatus or PBS (mock) at day 0 (D0), and infection was allowed to establish for 24 h. Mice were treated with either 1 mg/kg micafungin or 0.9% NaCl every 24 h from D1 to D3; 12 h after the final micafungin treatment, mice were sacrificed for fungal burden determination by qPCR. (B) qPCR quantification of total nanograms of fungal DNA in lungs of mice challenged with the indicated A. fumigatus strains and left untreated or treated with 1 mg/kg micafungin according to the design in panel A. Each data point and the means are shown (n ≥ 12 for each experimental group and n = 5 for mock-infected mice across two independent experiments). *, P < 0.05; ns, not significant as determined by Kruskal-Wallis with a Dunn’s multiple-comparison test.

References

    1. Gugnani HC. 2003. Ecology and taxonomy of pathogenic aspergilli. Front Biosci 8:346–357. doi:10.2741/1002. - DOI - PubMed
    1. Di Piazza S, Houbraken J, Meijer M, Cecchi G, Kraak B, Rosa E, Zotti M. 2020. Thermotolerant and thermophilic mycobiota in different steps of compost maturation. Microorganisms 8:880–889. doi:10.3390/microorganisms8060880. - DOI - PMC - PubMed
    1. Sánchez ÓJ, Ospina DA, Montoya S. 2017. Compost supplementation with nutrients and microorganisms in composting process. Elsevier Ltd., New York, NY. - PubMed
    1. Bhabhra R, Askew DS. 2005. Thermotolerance and virulence of Aspergillus fumigatus: role of the fungal nucleolus. Med Mycol 43:87–93. doi:10.1080/13693780400029486. - DOI - PubMed
    1. Ries LNA, Beattie S, Cramer RA, Goldman GH. 2018. Overview of carbon and nitrogen catabolite metabolism in the virulence of human pathogenic fungi. Mol Microbiol 107:277–297. doi:10.1111/mmi.13887. - DOI - PMC - PubMed

Publication types

LinkOut - more resources