. 2022 Apr 30;14(4):mfac007.
doi: 10.1093/mtomcs/mfac007.

Multimodal imaging of hemorrhagic transformation biomarkers in an ischemic stroke model

Affiliations

Multimodal imaging of hemorrhagic transformation biomarkers in an ischemic stroke model

M J Pushie et al. Metallomics. .

Abstract

Hemorrhagic transformation of ischemic stroke has devastating consequences, with high mortality and poor functional outcomes. Animal models of ischemic stroke also demonstrate the potential for hemorrhagic transformation, which complicates biochemical characterization, treatment studies, and hinders poststroke functional outcomes in affected subjects. The incidence of hemorrhagic transformation of ischemic stroke in animal model research is not commonly reported. The postmortem brain of such cases presents a complex milieu of biomarkers due to the presence of healthy cells, regions of varying degrees of ischemia, dead and dying cells, dysregulated metabolites, and blood components (especially reactive Fe species released from lysed erythrocytes). To improve the characterization of hemorrhage biomarkers on an ischemic stroke background, we have employed a combination of histology, X-ray fluorescence imaging (XFI), and Fourier transform infrared (FTIR) spectroscopic imaging to assess 122 photothrombotic (ischemic) stroke brains. Rapid freezing preserves brain biomarkers in situ and minimizes metabolic artifacts due to postmortem ischemia. Analysis revealed that 25% of the photothrombotic models had clear signs of hemorrhagic transformation. The XFI and FTIR metabolites provided a quantitative method to differentiate key metabolic regions in these models. Across all hemorrhage cases, it was possible to consistently differentiate otherwise healthy tissue from other metabolically distinct regions, including the ischemic infarct, the ischemic penumbra, blood vessels, sites of hemorrhage, and a region surrounding the hemorrhage core that contained elevated lipid oxidation. Chemical speciation of deposited Fe demonstrates the presence of heme-Fe and accumulation of ferritin.

Keywords: FTIR imaging; Fe speciation; XFI; hemorrhage; oxidative damage; stroke.


Conflict of interest statement

The authors declare no conflicts of interest.

Figures

Graphical Abstract
Graphical Abstract
Hemorrhage biomarkers provide insights into the extent of heme biotransformation during recovery as well as the extent of hemorrhage-induced oxidative damage.
Fig. 1
Fig. 1
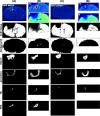
Representative results obtained from spontaneous hemorrhagic transformation of ischemic stroke in the photothrombotic mouse model. Schematic representation of a coronal section through the stroke lesion, highlighting key areas in the corresponding images (A). Unstained tissue (B) demonstrates significant dark red patches, indicative of erythrocyte extravasation around the site of hemorrhage. (C) Hematoxylin and eosin (H&E) staining of (B) highlights the ischemic infarct, while the hemorrhage is less pronounced. (D) X-ray fluorescence imaging of Fe Kα fluorescence of a section adjacent to (B) demonstrates the extent of iron deposition in the tissues. Fourier transform infrared spectroscopic imaging of (B), prior to H&E staining. (E) Multiple chemical signatures that allow the site of the hemorrhage to be readily differentiated from the surrounding tissue as well as from the stroke lesion. cc, corpus callosum; CTX, cortex. Scale bars in (B), (D), and (E) = 1 mm.
Fig. 2
Fig. 2
Comparison of contrast-enhanced magnetic resonance imaging (MRI) and X-ray fluorescence imaging (XFI). (A) MRI included T1-weighted anatomic images, demonstrating gadolinium-based contrast enhancement, T2 constructive interference steady state, and fluid-attenuated inversion recovery. (B) Schematic image based on light microscopy of the thin tissue section prepared from the brain shown in (A), with select elemental distributions from XFI highlighting the ischemic infarct, region of intracerebral hemorrhage, and the localization of contrast (Gd). Scale bar in (B) = 1 mm.
Fig. 3
Fig. 3
Representative clustering results. Clustering of Fourier transform infrared (FTIR) imaging (A) and X-ray fluorescence imaging (XFI) (B) data for a 72 h post-photothrombotic (PT) stroke specimen with elevated lipid peroxidation; FTIR imaging (C) and XFI (D) for an age-matched 72 h post-PT stroke specimen without evidence of lipid peroxidation. White pixels in cluster maps correspond to regions of interest (ROIs) used in analysis, except for cortex reference values in stroke animals—these ROIs are generated from the cortex of the bulk tissue cluster in the location contralateral to the PT lesion.
Fig. 4
Fig. 4
Fe maps and chemical speciation μXAS at points of interest from a 72 h poststroke specimen. (A) Schematic image from microscopy. The Fe survey map (B) is the same data shown in Fig. 1D with a higher threshold, boxed areas indicate regions selected for fine X-ray fluorescence imaging mapping, shown in panels (a) (hemorrhage core), (b) (overlap of the penumbra and PHZ), and (c) (contralateral cortex). Reference X-ray absorption spectroscopy (XAS) spectra for heme-Fe and ferritin are shown (lower left). (C) Fe μXAS data for each of the circled regions of interest (ROIs) in (a)–(c) are shown in (D)–(F), respectively, and include the best-fitting reference spectrum to the experimental data. Survey Fe map (B) scale bar = 600 μm. Fine-scan Fe maps (a)–(c) scale bar = 40 μm. Additional μXAS from 24, 48, and 72 h poststroke specimens in Fig. S1. LV, lateral ventricles; cc, corpus callosum.
Fig. 5
Fig. 5
Biomarker summary for all regions of interest (ROIs) (summarized in the inset scheme) used in the analysis. (A) ROIs include the infarct core (Infarct), ischemic penumbra (Penumbra), deep middle cerebral vein (BV), hemorrhagic core (HC), and peri-hemorrhage zone (PHZ), with the radial wedge from the center of the HC used to define the radial profile in (C). Reference values are taken from the cortex of age-matched shams (Sham) as well as the contralateral cortex of PT stroke specimens (Contra). (B) X-ray fluorescence imaging elemental levels (Fig. S2) and Fourier transform infrared biomarkers (Fig. S3) for each ROI, as well as all P-values (Tables S1 and S2, respectively) are summarized in the Supplementary Material. Color-coded asterisks indicate a significant difference vs. the ROI of the corresponding color. (C) Representative plot of the radial distribution of several key markers (Fe, total protein, plasma lipids, and fibrinogen) are also plotted, demonstrating the localization of Fe, protein, plasma lipids, and fibrinogen is highest at the origin of the HC, with the levels diminishing toward the background farther from the origin.

References

    1. An S. J., Kim T. J., Yoon B.-W., Epidemiology, risk factors, and clinical features of intracerebral hemorrhage: an update, J. Stroke, 2017, 19 (1), 3–10. - PMC - PubMed
    1. van Asch C. J. J., Luitse M. J. A., Rinkel G. J. E., van der Tweel I., Algra A., Klijn C. J. M., Incidence, case fatality, and functional outcome of intracerebral haemorrhage over time, according to age, sex, and ethnic origin: a systematic review and meta-analysis, Lancet Neurol., 2010, 9 (2), 167–176. - PubMed
    1. Hansen A. J., Nedergaard M., Brain ion homeostasis in cerebral ischemia, Neurochem. Pathol., 1988, 9, 195–209. - PubMed
    1. Sun D., Kahle K. T., Dysregulation of diverse ion transport pathways controlling cell volume homoestasis contribute to neuroglial cell injury following ischemic stroke, Transl. Stroke Res., 2014, 5 (1), 1–2. - PMC - PubMed
    1. Khanna A., Kahle K. T., Walcott B. P., Gerzanich V., Simard M. J., Disruption of ion homeostasis in the neurogliovascular unit underlies the pathogenesis of ischemic cerebral edema, Transl. Stroke Res., 2014, 5 (1), 3–16. - PMC - PubMed

Publication types