

Normal values for 18F-FDG uptake in organs and tissues measured by dynamic whole body multiparametric FDG PET in 126 patients
- PMID: 35254514
- PMCID: PMC8901901
- DOI: 10.1186/s13550-022-00884-0
Normal values for 18F-FDG uptake in organs and tissues measured by dynamic whole body multiparametric FDG PET in 126 patients
Abstract
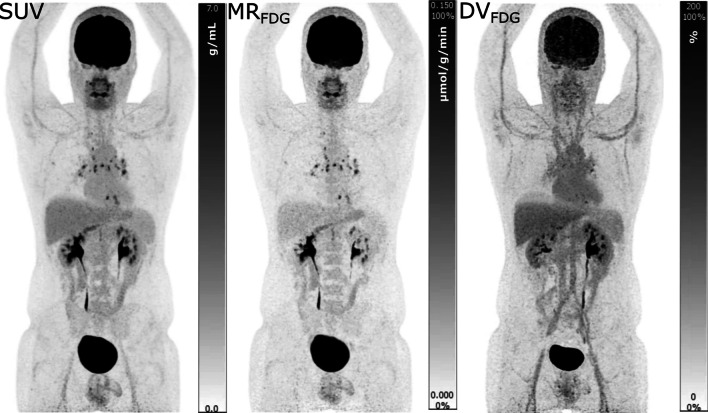
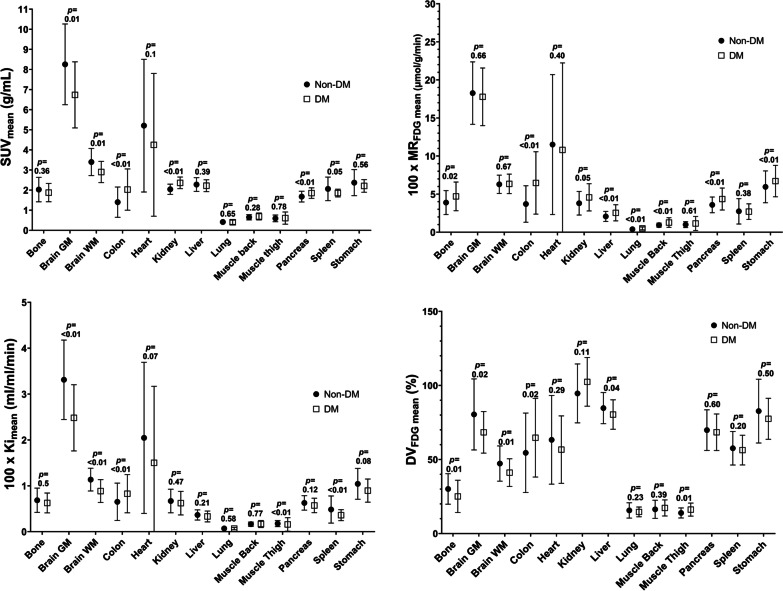
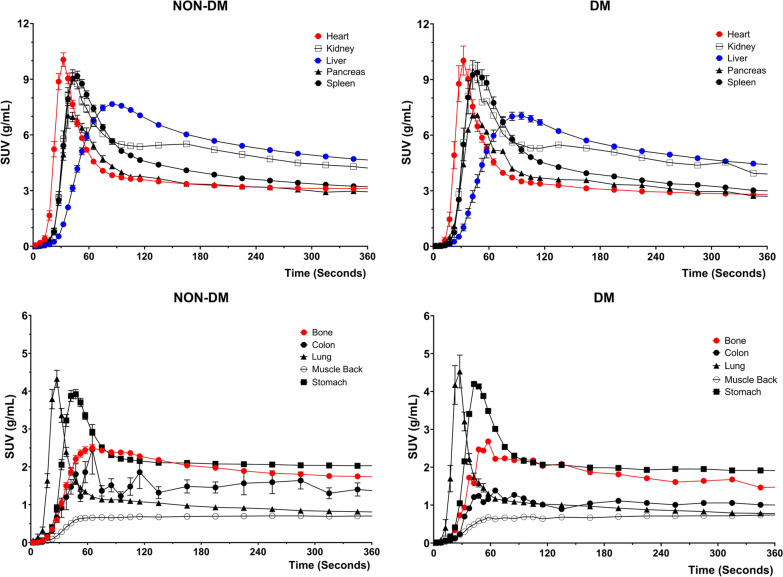
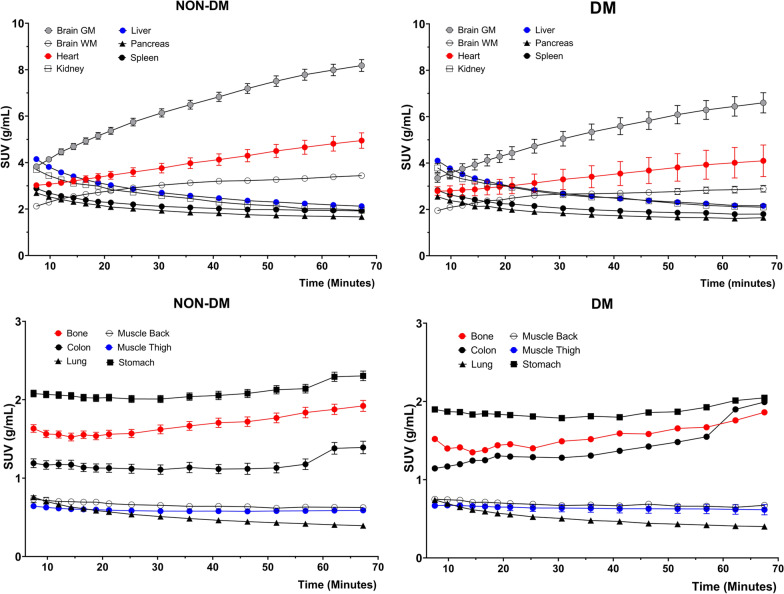
Background: Dynamic whole-body (D-WB) FDG PET/CT is a recently developed technique that allows direct reconstruction of multiparametric images of metabolic rate of FDG uptake (MRFDG) and "free" FDG (DVFDG). Multiparametric images have a markedly different appearance than the conventional SUV images obtained by static PET imaging, and normal values of MRFDG and DVFDG in frequently used reference tissues and organs are lacking. The aim of this study was therefore to: (1) provide an overview of normal MRFDG and DVFDG values and range of variation in organs and tissues; (2) analyse organ time-activity curves (TACs); (3) validate the accuracy of directly reconstructed MRFDG tissue values versus manually calculated Ki (and MRFDG) values; and (4) explore correlations between demographics, blood glucose levels and MRFDG values. D-WB data from 126 prospectively recruited patients (100 without diabetes and 26 with diabetes) were retrospectively analysed. Participants were scanned using a 70-min multiparametric PET acquisition protocol on a Siemens Biograph Vision 600 PET/CT scanner. 13 regions (bone, brain grey and white matter, colon, heart, kidney, liver, lung, skeletal muscle of the back and thigh, pancreas, spleen, and stomach) as well as representative pathological findings were manually delineated, and values of static PET (SUV), D-WB PET (Ki, MRFDG and DVFDG) and individual TACs were extracted. Multiparametric values were compared with manual TAC-based calculations of Ki and MRFDG, and correlations with blood glucose, age, weight, BMI, and injected tracer dose were explored.
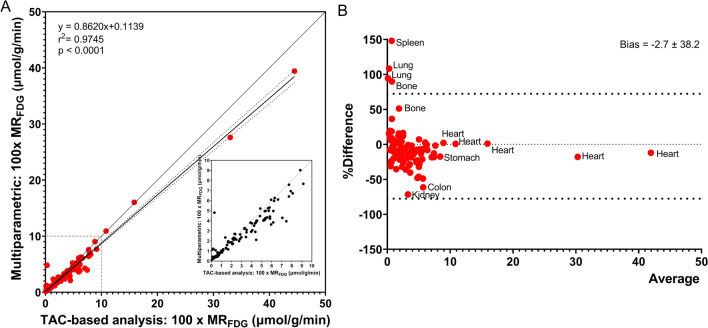
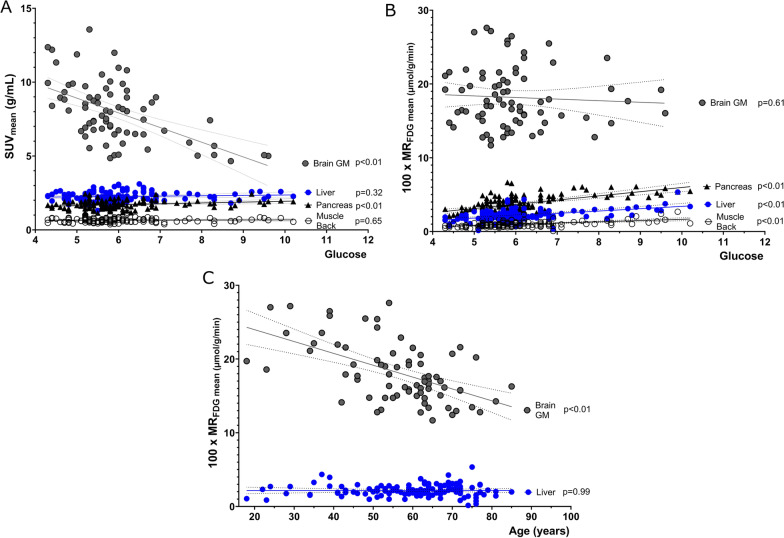
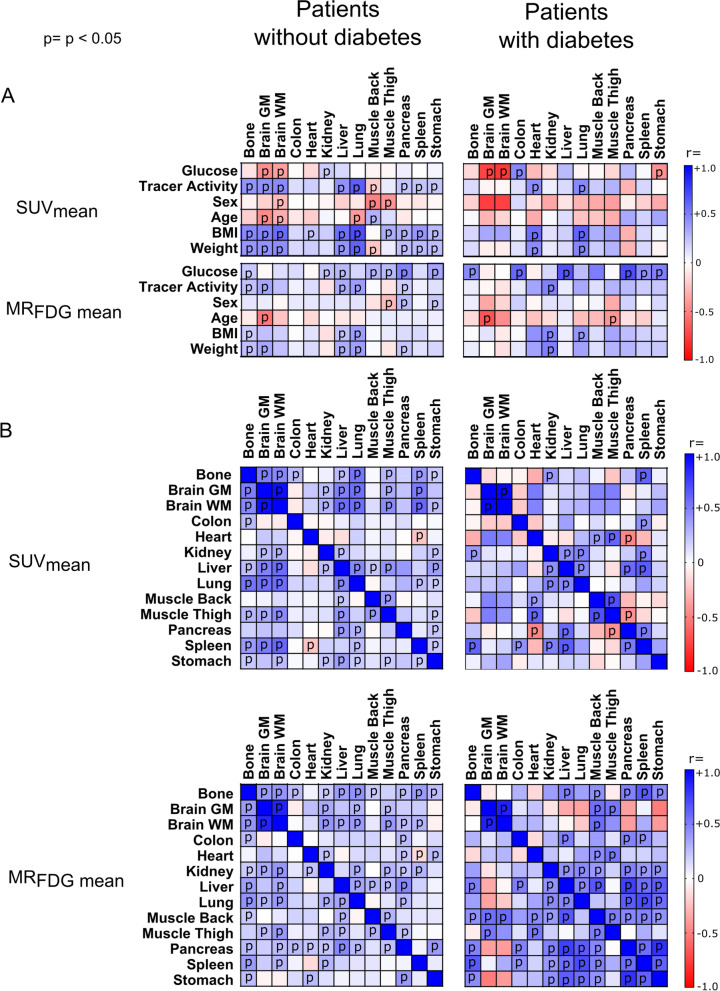
Results: Tissue and organ MRFDG values showed little variation, comparable to corresponding SUV variation. All regional TACs were in line with previously published FDG kinetics, and the multiparametric metrics correlated well with manual TAC-based calculations (r2 = 0.97, p < 0.0001). No correlations were observed between glucose levels and MRFDG in tissues known not to be substrate driven, while tissues with substrate driven glucose uptake had significantly correlated glucose levels and MRFDG values.
Conclusion: The multiparametric D-WB PET scan protocol provides normal MRFDG values with little inter-subject variation and in agreement with manual TAC-based calculations and literature values. The technique therefore facilitates both accurate clinical reports and simpler acquisition of quantitative estimates of whole-body tissue glucose metabolism.
Keywords: Dynamic whole-body PET; Multiparametric imaging; Normal values; Patlak.
© 2022. The Author(s).
Conflict of interest statement
The authors declare that they have no competing interests.
Figures
References
-
- Keyes JW., Jr SUV: standard uptake or silly useless value? J Nucl Med. 1995;36:1836–1839. - PubMed
-
- Boellaard R, Krak NC, Hoekstra OS, Lammertsma AA. Effects of noise, image resolution, and ROI definition on the accuracy of standard uptake values: a simulation study. J Nucl Med. 2004;45:1519–1527. - PubMed
-
- Dimitrakopoulou-Strauss A, Pan L, Sachpekidis C. Kinetic modeling and parametric imaging with dynamic PET for oncological applications: general considerations, current clinical applications, and future perspectives. Eur J Nucl Med Mol Imaging. 2021;48:21–39. doi: 10.1007/s00259-020-04843-6. - DOI - PMC - PubMed
Grants and funding
LinkOut - more resources
Full Text Sources
