. 2022 Mar 15;119(11):e2113386119.
doi: 10.1073/pnas.2113386119. Epub 2022 Mar 7.

Phosphonate production by marine microbes: Exploring new sources and potential function

Affiliations

Phosphonate production by marine microbes: Exploring new sources and potential function

Marianne Acker et al. Proc Natl Acad Sci U S A. .

Abstract

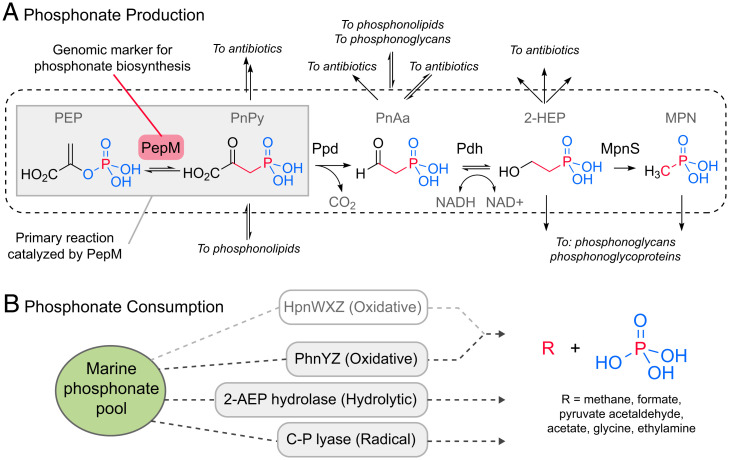
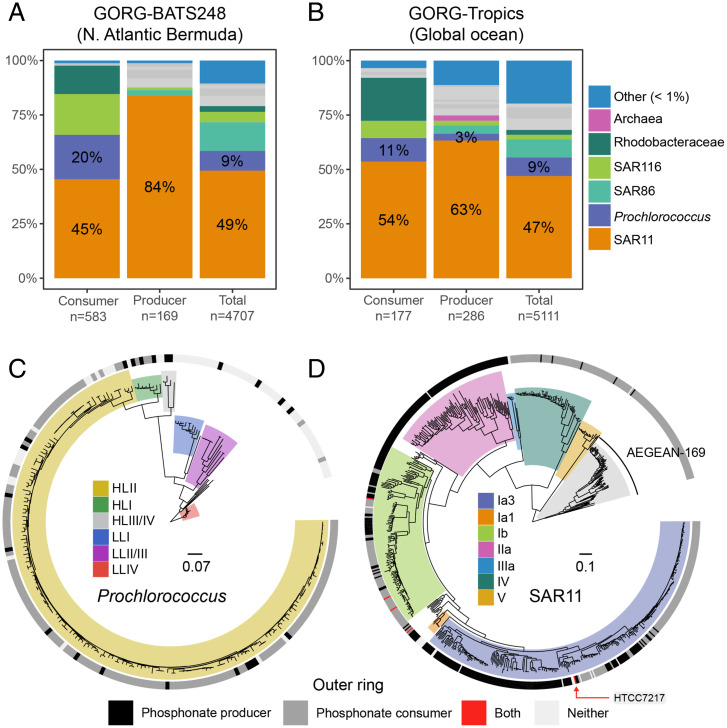
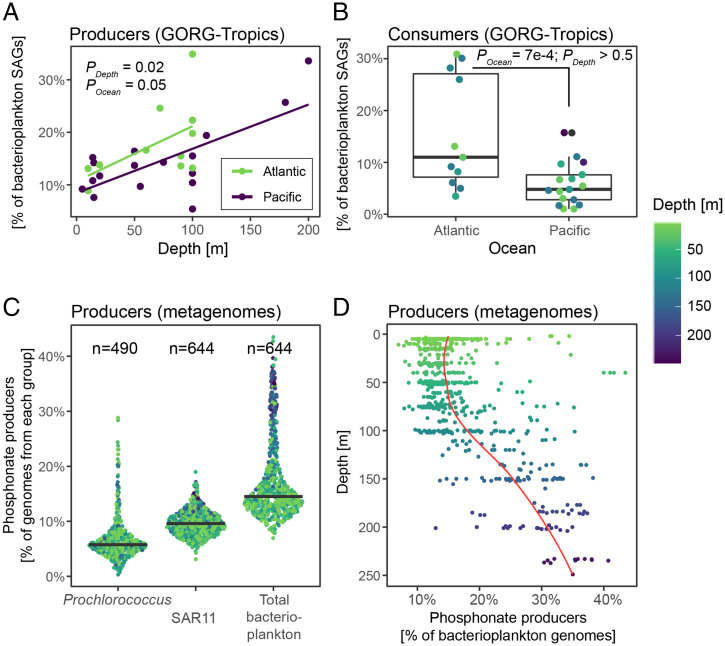
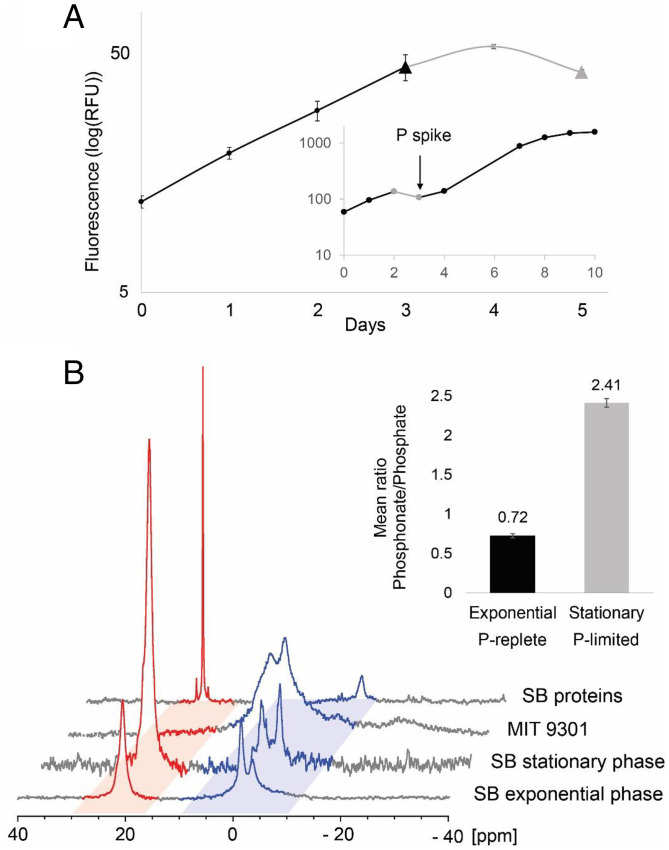
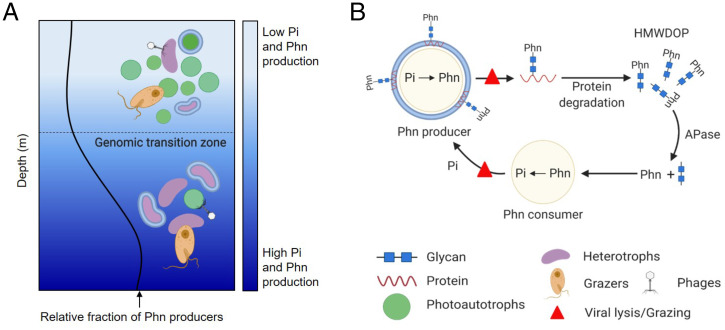
SignificancePhosphonates are a class of phosphorus metabolites characterized by a highly stable C-P bond. Phosphonates accumulate to high concentrations in seawater, fuel a large fraction of marine methane production, and serve as a source of phosphorus to microbes inhabiting nutrient-limited regions of the oligotrophic ocean. Here, we show that 15% of all bacterioplankton in the surface ocean have genes phosphonate synthesis and that most belong to the abundant groups Prochlorococcus and SAR11. Genomic and chemical evidence suggests that phosphonates are incorporated into cell-surface phosphonoglycoproteins that may act to mitigate cell mortality by grazing and viral lysis. These results underscore the large global biogeochemical impact of relatively rare but highly expressed traits in numerically abundant groups of marine bacteria.

Keywords: Prochlorococcus; biogeochemistry; marine; phosphonate; phosphorus.


Conflict of interest statement

The authors declare no competing interest.

Figures

Fig. 1.
Fig. 1.
Phosphonate production and consumption in the marine environment. (A) This schematic emphasizes reaction pathways (e.g., to methylphosphonate [Mpn]) (18) that are most relevant for planktonic ecosystems in the oligotrophic surface ocean. Branch points to additional natural products are indicated where possible. For a comprehensive overview please refer to ref. . The isomerization of phosphoenolpyruvate (PEP) via PEP mutase (PepM, red and gray boxes) produces the phosphonopyruvate (PnPy) precursor from which effectively all known phosphonate compounds are derived. The pepM gene is a robust genomic marker for phosphonate production potential due to this functional conservation. Mpn, a well-known substrate for aerobic marine methane production (18), is produced by 1) the decarboxylation of PnPy to phosphonoacetaldehyde (PnAa) via phosphonopyruvate decarboxylase (Ppd), 2) the dehydrogenation of PnAa to 2-hydroxyethylphosphonic acid (2-HEP) via phosphonoacetaldehyde dehydrogenase (Pdh), and finally 3) transformation of 2-HEP by Mpn synthase (MpnS). (B) Phosphonate degradation via cleavage of the C-P bond proceeds through at least three mechanisms: hydrolytic (2-AEP, named for the representative 2-aminoethylphosphonate degradation pathway via PhnWX), radical (C-P lyase), and oxidative (PhnYZ). The proposed HpnWXZ pathway (greyed) is likely oxidative but is rare in the genomes we examined.
Fig. 2.
Fig. 2.
SAR11 and Prochlorococcus potential for phosphonate production and consumption in the surface ocean. Taxonomic assignments (as percent of total cells) of phosphonate consumers, producers, and all (total) genomes from the following: (A) Bermuda in the North Atlantic Ocean (GORG-BATS248) and (B) the global tropical ocean (GORG-Tropics). The number of genomes in each category are listed on the x-axis. Taxonomic groups with abundance less than 1% of the total are collapsed. Gray bars represent nonfocal taxonomic groups (SI Appendix, Fig. S1). Here, GORG-Tropics contains a random selection of genomes from GORG-BATS248 subsampled to the median per-sample abundance in GORG-Tropics. Genome phylogenies of (C) Prochlorococcus (n = 235) and (D) SAR11 (n = 695) single-cell genomes from GORG-Tropics and isolate genomes. Dominant clades/ecotypes from each group are highlighted. The ring outside each tree displays whether a genome is a phosphonate producer (black), a phosphonate consumer (gray), or both a producer and consumer (red). Isolate genomes with neither pathway are shown in white. For reference, HTCC7217 from the SAR11 clade 1a3 is both a producer and consumer. Prochlorococcus is rooted on the LLIV clade and SAR11 is rooted on the AEGEAN-169 group. Scale bars represent amino acid substitution per site.
Fig. 3.
Fig. 3.
Oceanographic drivers of phosphonate production. (A) The proportion of phosphonate producers significantly increases with depth in the 28 GORG-Tropics samples (beta-binomial regression; Est = 0.004, Err = 0.001, t = 2.604, and P = 0.02; link = logit; log L = −78.179, df = 4, and resid df = 24). Producers are slightly more common in the Atlantic than the Pacific (beta-binomial regression; Est = −0.30, Err = 0.14, t = −2.08, and P = 0.05; link = logit; log L = −78.179, df = 4, and resid df = 24). Each point is a sample (median SAGs per sample = 241). (B) Phosphonate consumers in the Atlantic and Pacific oceans as percent of all SAGs (Est = −1.04, Err = 0.27, t = −3.81, and P = 7 × 10⁻⁴; link = logit; log L = −80.425, df = 4, and resid df = 24). Proportions (%) are total producers or consumers divided by the total number GORG assemblies and are corrected using the estimated sequence recovery from assemblies (Materials and Methods). (C) Percentage of phosphonate producers in the global (sub)tropical surface ocean estimated from BioGEOTRACES and Tara Oceans metagenomes. Total bacterioplankton category includes both Bacteria and Archaea. Black line is the median value for n metagenome samples for each taxonomic group. (D) The relationship between depth and percent of all bacterioplankton with the phosphonate production trait. The red line is a simple Loess regression fit to the data.
Fig. 4.
Fig. 4.
Phosphonate production by cultured Prochlorococcus SB. (A) Prochlorococcus SB growth curve in medium with N/P = 350/1 showing exponential phase (P-replete; black line and symbols) and stationary phase (P-starved; gray line and symbols) due to P-starvation. Triangle data points correspond to the days the cells were harvested in the different growth phases. Error bars are calculated based on the SD between the biological duplicates. The Inset represents the Prochlorococcus SB growth curve in medium with N/P = 350/1 in which inorganic phosphate was added on Day 3 to reach N/P = 16/1. (B) 31P-NMR spectra of exponential (P-replete) and stationary (P-starved) phase Prochlorococcus SB whole cells, P-replete Prochlorococcus MIT9301 whole cells, and the insoluble protein fraction of P-replete Prochlorococcus SB. The phosphonate and phosphate regions of the spectra are indicated in red and blue, respectively. While Prochlorococcus SB produces phosphonate and doubles its relative phosphonate content in P-starved stationary phase, the negative control, MIT9301 only produces phosphates. The histogram (Inset) displays the mean phosphonate/phosphate ratios for Prochlorococcus SB cells harvested in exponential (black) and stationary (gray) phase calculated by integrating the phosphonate and phosphate peaks in Prochlorococcus SB whole-cell 31P-NMR spectra obtained for the duplicates in each growth phase. Error bars correspond to the SD of the biological replicate.
Fig. 5.
Fig. 5.
Hypothesized microbial cycling of phosphonates in the surface ocean. (A) In the surface ocean, phosphate (Pi) is scarce and often limiting. Producing phosphonate (Phn) as a mortality defense may be costly in terms of resource allocation. Therefore, the relative fraction of phosphonate producers in the microbial community is low. As nutrient availability increases through the genomic transition zone (42), the P cost to produce phosphonate decreases and the benefit/cost ratio of phosphonate production, in which the benefit is a decrease in mortality, increases causing phosphonate producers to be relatively more abundant. (B) Microbes with PepM produce cell surface-layer phosphonoglycoproteins to reduce mortality from grazing or viral infection. Upon death of the cell, phosphonoglycoproteins are released into seawater where heterotrophic microbes quickly remineralize proteins leaving phosphonoglycans to accumulate as HMWDOP. Phosphonates are hydrolyzed from glycans by alkaline phosphatase (APase) family enzymes and further hydrolyzed into phosphate by C-P lyase or other hydrolytic pathways. Recycled phosphate can then be used to produce new phosphonates.

References

    1. Dyhrman S. T., “Nutrients and their acquisition: Phosphorus physiology in microalgae” in The Physiology of Microalgae, Borowitzka M. A., Beardall J., Raven J. A., Eds. (Springer International Publishing, 2016), pp. 155–183.
    1. Van Mooy B. A. S., Devol A. H., Assessing nutrient limitation of Prochlorococcus in the North Pacific subtropical gyre by using an RNA capture method. Limnol. Oceanogr. 53, 78–88 (2008).
    1. Dyhrman S. T., et al. , The transcriptome and proteome of the diatom Thalassiosira pseudonana reveal a diverse phosphorus stress response. PLoS One 7, e33768 (2012). - PMC - PubMed
    1. Van Mooy B. A. S., et al. , Phytoplankton in the ocean use non-phosphorus lipids in response to phosphorus scarcity. Nature 458, 69–72 (2009). - PubMed
    1. Martin P., Dyhrman S. T., Lomas M. W., Poulton N. J., Van Mooy B. A. S., Accumulation and enhanced cycling of polyphosphate by Sargasso Sea plankton in response to low phosphorus. Proc. Natl. Acad. Sci. U.S.A. 111, 8089–8094 (2014). - PMC - PubMed

Substances

LinkOut - more resources