The evolution of brain neuron numbers in amniotes
- PMID: 35254911
- PMCID: PMC8931369
- DOI: 10.1073/pnas.2121624119
The evolution of brain neuron numbers in amniotes
Abstract
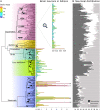
SignificanceThe evolution of brain processing capacity has traditionally been inferred from data on brain size. However, similarly sized brains of distantly related species can differ in the number and distribution of neurons, their basic computational units. Therefore, a finer-grained approach is needed to reveal the evolutionary paths to increased cognitive capacity. Using a new, comprehensive dataset, we analyzed brain cellular composition across amniotes. Compared to reptiles, mammals and birds have dramatically increased neuron numbers in the telencephalon and cerebellum, which are brain parts associated with higher cognition. Astoundingly, a phylogenetic analysis suggests that as few as four major changes in neuron-brain scaling in over 300 million years of evolution pave the way to intelligence in endothermic land vertebrates.
Keywords: brain size; cognition; evolution; intelligence; number of neurons.
Conflict of interest statement
The authors declare no competing interest.
Figures


Similar articles
-
Not all brains are made the same: new views on brain scaling in evolution.Brain Behav Evol. 2011;78(1):22-36. doi: 10.1159/000327318. Epub 2011 Jun 17. Brain Behav Evol. 2011. PMID: 21691045 Review.
-
Birds have primate-like numbers of neurons in the forebrain.Proc Natl Acad Sci U S A. 2016 Jun 28;113(26):7255-60. doi: 10.1073/pnas.1517131113. Epub 2016 Jun 13. Proc Natl Acad Sci U S A. 2016. PMID: 27298365 Free PMC article.
-
Theropod dinosaurs had primate-like numbers of telencephalic neurons.J Comp Neurol. 2023 Jun;531(9):962-974. doi: 10.1002/cne.25453. Epub 2023 Jan 5. J Comp Neurol. 2023. PMID: 36603059
-
The evolution of the dorsal thalamus of jawed vertebrates, including mammals: cladistic analysis and a new hypothesis.Brain Res Brain Res Rev. 1994 Jan;19(1):29-65. doi: 10.1016/0165-0173(94)90003-5. Brain Res Brain Res Rev. 1994. PMID: 8167659 Review.
-
The evolution of the dorsal pallium in the telencephalon of amniotes: cladistic analysis and a new hypothesis.Brain Res Brain Res Rev. 1994 Jan;19(1):66-101. doi: 10.1016/0165-0173(94)90004-3. Brain Res Brain Res Rev. 1994. PMID: 8167660 Review.
Cited by
-
Quantitative functional imaging of the pigeon brain: implications for the evolution of avian powered flight.Proc Biol Sci. 2024 Jan 31;291(2015):20232172. doi: 10.1098/rspb.2023.2172. Epub 2024 Jan 31. Proc Biol Sci. 2024. PMID: 38290541 Free PMC article.
-
CTCF barrier breaking by ZFP661 promotes protocadherin diversity in mammalian brains.bioRxiv [Preprint]. 2023 May 8:2023.05.08.539838. doi: 10.1101/2023.05.08.539838. bioRxiv. 2023. PMID: 39185186 Free PMC article. Preprint.
-
Phylogenetically informed predictions outperform predictive equations in real and simulated data.Nat Commun. 2025 Jul 3;16(1):6130. doi: 10.1038/s41467-025-61036-1. Nat Commun. 2025. PMID: 40610418 Free PMC article.
-
The quantitative anatomy of the hippocampal formation in homing pigeons and other pigeon breeds: implications for spatial cognition.Brain Struct Funct. 2024 Dec 17;230(1):9. doi: 10.1007/s00429-024-02882-5. Brain Struct Funct. 2024. PMID: 39688732
-
Memory in Leopard Geckos (Eublepharis macularius) in a Morris Water Maze Task.Animals (Basel). 2025 Jul 8;15(14):2014. doi: 10.3390/ani15142014. Animals (Basel). 2025. PMID: 40723477 Free PMC article.
References
-
- Tsuboi M., et al. , Breakdown of brain-body allometry and the encephalization of birds and mammals. Nat. Ecol. Evol. 2, 1492–1500 (2018). - PubMed
-
- Ksepka D. T., et al. , Tempo and pattern of avian brain size evolution. Curr. Biol. 30, 2026–2036.e3 (2020). - PubMed
-
- Jerison H., Evolution of the Brain and Intelligence (Academic Press, 1973).
-
- Font E., García-Roa R., Pincheira-Donoso D., Carazo P., Rethinking the effects of body size on the study of brain size evolution. Brain Behav Evol 93, 182–195 (2019). - PubMed
MeSH terms
Associated data
LinkOut - more resources
Full Text Sources

