

Multiphysics and multiscale modeling of microthrombosis in COVID-19
- PMID: 35255089
- PMCID: PMC8901059
- DOI: 10.1371/journal.pcbi.1009892
Multiphysics and multiscale modeling of microthrombosis in COVID-19
Abstract
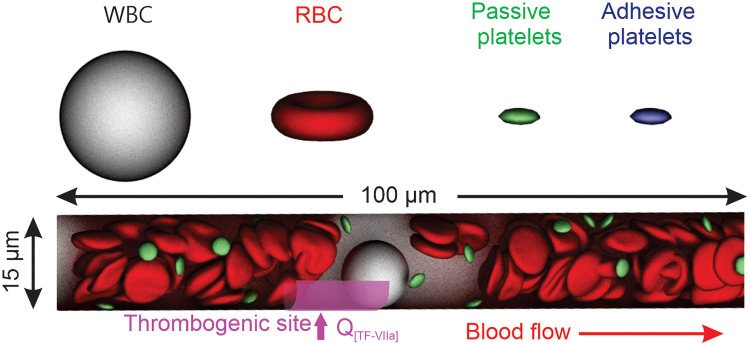
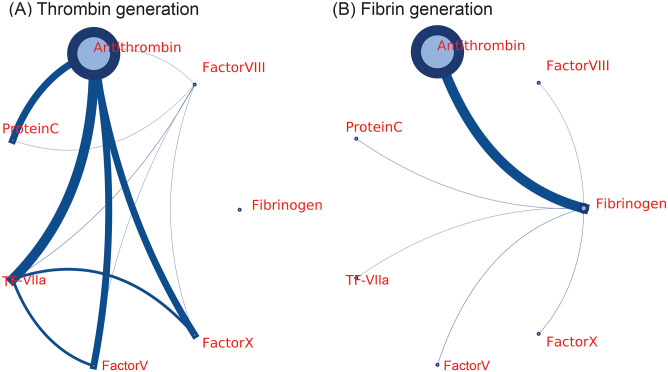
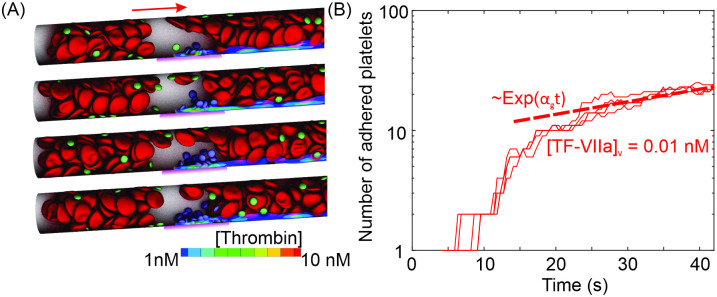
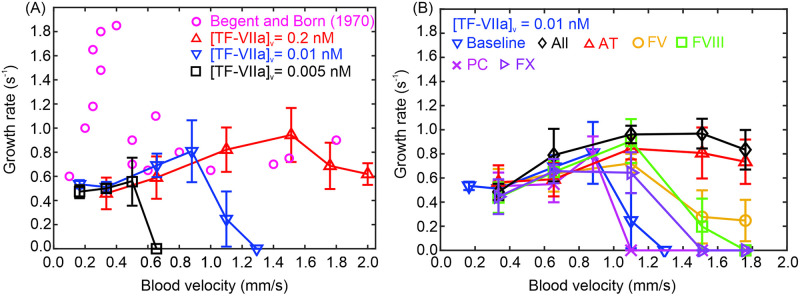
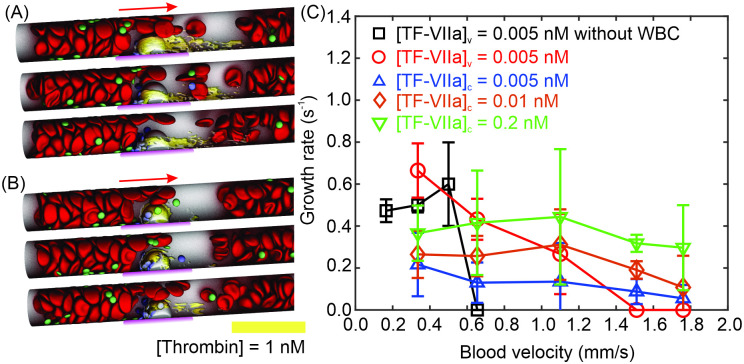
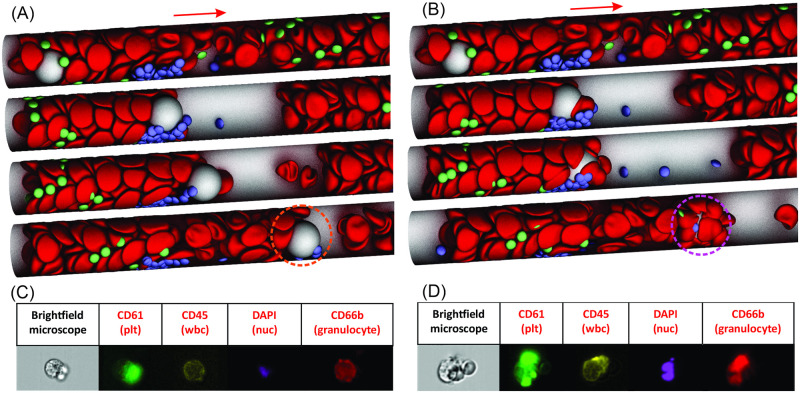
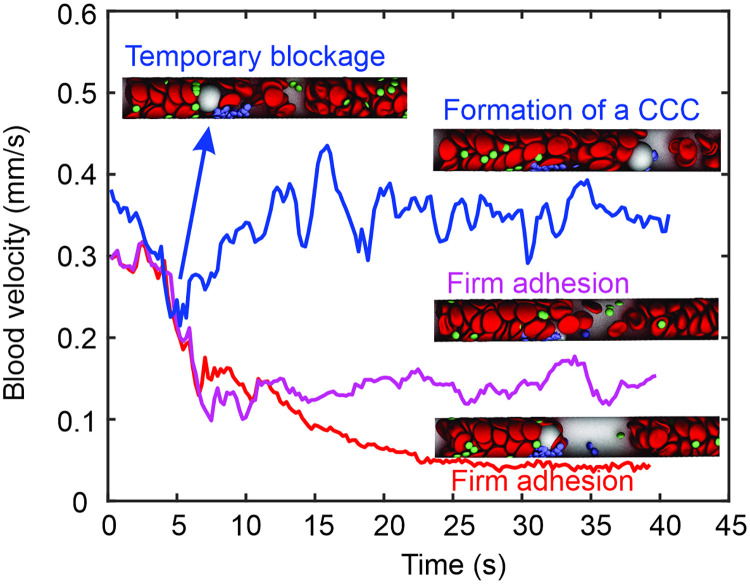
Emerging clinical evidence suggests that thrombosis in the microvasculature of patients with Coronavirus disease 2019 (COVID-19) plays an essential role in dictating the disease progression. Because of the infectious nature of SARS-CoV-2, patients' fresh blood samples are limited to access for in vitro experimental investigations. Herein, we employ a novel multiscale and multiphysics computational framework to perform predictive modeling of the pathological thrombus formation in the microvasculature using data from patients with COVID-19. This framework seamlessly integrates the key components in the process of blood clotting, including hemodynamics, transport of coagulation factors and coagulation kinetics, blood cell mechanics and adhesive dynamics, and thus allows us to quantify the contributions of many prothrombotic factors reported in the literature, such as stasis, the derangement in blood coagulation factor levels and activities, inflammatory responses of endothelial cells and leukocytes to the microthrombus formation in COVID-19. Our simulation results show that among the coagulation factors considered, antithrombin and factor V play more prominent roles in promoting thrombosis. Our simulations also suggest that recruitment of WBCs to the endothelial cells exacerbates thrombogenesis and contributes to the blockage of the blood flow. Additionally, we show that the recent identification of flowing blood cell clusters could be a result of detachment of WBCs from thrombogenic sites, which may serve as a nidus for new clot formation. These findings point to potential targets that should be further evaluated, and prioritized in the anti-thrombotic treatment of patients with COVID-19. Altogether, our computational framework provides a powerful tool for quantitative understanding of the mechanism of pathological thrombus formation and offers insights into new therapeutic approaches for treating COVID-19 associated thrombosis.
Conflict of interest statement
The authors have declared that no competing interests exist.
Figures
Similar articles
-
Computational modeling of hypercoagulability in COVID-19.Comput Methods Biomech Biomed Engin. 2023 Feb;26(3):338-349. doi: 10.1080/10255842.2022.2124858. Epub 2022 Sep 26. Comput Methods Biomech Biomed Engin. 2023. PMID: 36154346
-
COVID-19 and thrombosis: The role of hemodynamics.Thromb Res. 2022 Apr;212:51-57. doi: 10.1016/j.thromres.2022.02.016. Epub 2022 Feb 23. Thromb Res. 2022. PMID: 35219932 Free PMC article. Review.
-
IL-1 induces throboxane-A2 (TxA2) in COVID-19 causing inflammation and micro-thrombi: inhibitory effect of the IL-1 receptor antagonist (IL-1Ra).J Biol Regul Homeost Agents. 2020 Sep-Oct,;34(5):1623-1627. doi: 10.23812/20-34-4EDIT-65. J Biol Regul Homeost Agents. 2020. PMID: 32744052
-
Blood clots in COVID-19 patients: Simplifying the curious mystery.Med Hypotheses. 2021 Jan;146:110371. doi: 10.1016/j.mehy.2020.110371. Epub 2020 Nov 6. Med Hypotheses. 2021. PMID: 33223324 Free PMC article.
-
The Impact of SARS-CoV-2 Infection on Blood Coagulation and Fibrinolytic Pathways: A Review of Prothrombotic Changes Caused by COVID-19.Semin Thromb Hemost. 2022 Feb;48(1):19-30. doi: 10.1055/s-0041-1736166. Epub 2021 Oct 25. Semin Thromb Hemost. 2022. PMID: 34695858 Review.
Cited by
-
Sialylated Glycan Bindings from SARS-CoV-2 Spike Protein to Blood and Endothelial Cells Govern the Severe Morbidities of COVID-19.Int J Mol Sci. 2023 Dec 1;24(23):17039. doi: 10.3390/ijms242317039. Int J Mol Sci. 2023. PMID: 38069362 Free PMC article. Review.
-
In silico and in vitro study of the adhesion dynamics of erythrophagocytosis in sickle cell disease.Biophys J. 2023 Jun 20;122(12):2590-2604. doi: 10.1016/j.bpj.2023.05.022. Epub 2023 May 24. Biophys J. 2023. PMID: 37231647 Free PMC article.
-
Circulating cellular clusters are associated with thrombotic complications and clinical outcomes in COVID-19.iScience. 2023 Jun 25;26(7):107202. doi: 10.1016/j.isci.2023.107202. eCollection 2023 Jul 21. iScience. 2023. PMID: 37485375 Free PMC article.
-
Biomechanics of phagocytosis of red blood cells by macrophages in the human spleen.Proc Natl Acad Sci U S A. 2024 Oct 29;121(44):e2414437121. doi: 10.1073/pnas.2414437121. Epub 2024 Oct 25. Proc Natl Acad Sci U S A. 2024. PMID: 39453740 Free PMC article.
-
Circulating cell clusters aggravate the hemorheological abnormalities in COVID-19.Biophys J. 2022 Sep 20;121(18):3309-3319. doi: 10.1016/j.bpj.2022.08.031. Epub 2022 Aug 27. Biophys J. 2022. PMID: 36028998 Free PMC article.
References
Publication types
MeSH terms
Substances
Grants and funding
LinkOut - more resources
Full Text Sources
Medical
Miscellaneous
