

Associations between multimorbidity and adverse health outcomes in UK Biobank and the SAIL Databank: A comparison of longitudinal cohort studies
- PMID: 35255092
- PMCID: PMC8901063
- DOI: 10.1371/journal.pmed.1003931
Associations between multimorbidity and adverse health outcomes in UK Biobank and the SAIL Databank: A comparison of longitudinal cohort studies
Abstract
Background: Cohorts such as UK Biobank are increasingly used to study multimorbidity; however, there are concerns that lack of representativeness may lead to biased results. This study aims to compare associations between multimorbidity and adverse health outcomes in UK Biobank and a nationally representative sample.
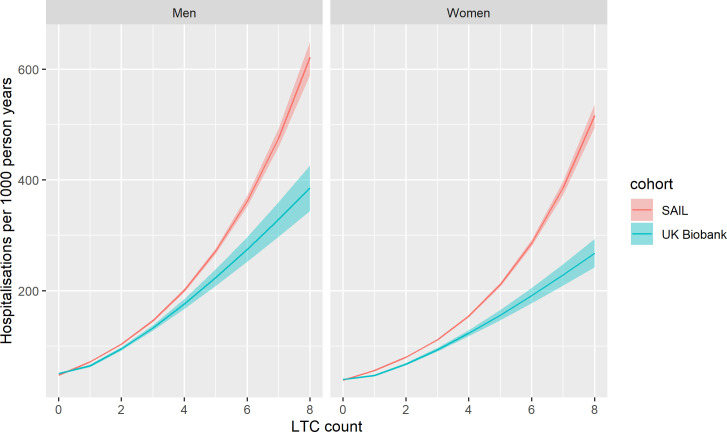
Methods and findings: These are observational analyses of cohorts identified from linked routine healthcare data from UK Biobank participants (n = 211,597 from England, Scotland, and Wales with linked primary care data, age 40 to 70, mean age 56.5 years, 54.6% women, baseline assessment 2006 to 2010) and from the Secure Anonymised Information Linkage (SAIL) databank (n = 852,055 from Wales, age 40 to 70, mean age 54.2, 50.0% women, baseline January 2011). Multimorbidity (n = 40 long-term conditions [LTCs]) was identified from primary care Read codes and quantified using a simple count and a weighted score. Individual LTCs and LTC combinations were also assessed. Associations with all-cause mortality, unscheduled hospitalisation, and major adverse cardiovascular events (MACEs) were assessed using Weibull or negative binomial models adjusted for age, sex, and socioeconomic status, over 7.5 years follow-up for both datasets. Multimorbidity was less common in UK Biobank than SAIL (26.9% and 33.0% with ≥2 LTCs in UK Biobank and SAIL, respectively). This difference was attenuated, but persisted, after standardising by age, sex, and socioeconomic status. The association between increasing multimorbidity count and mortality, hospitalisation, and MACE was similar between both datasets at LTC counts of ≤3; however, above this level, UK Biobank underestimated the risk associated with multimorbidity (e.g., mortality hazard ratio for 2 LTCs 1.62 (95% confidence interval 1.57 to 1.68) in SAIL and 1.51 (1.43 to 1.59) in UK Biobank, hazard ratio for 5 LTCs was 3.46 (3.31 to 3.61) in SAIL and 2.88 (2.63 to 3.15) in UK Biobank). Absolute risk of mortality, hospitalisation, and MACE, at all levels of multimorbidity, was lower in UK Biobank than SAIL (adjusting for age, sex, and socioeconomic status). Both cohorts produced similar hazard ratios for some LTCs (e.g., hypertension and coronary heart disease), but UK Biobank underestimated the risk for others (e.g., alcohol-related disorders or mental health conditions). Hazard ratios for some LTC combinations were similar between the cohorts (e.g., cardiovascular conditions); however, UK Biobank underestimated the risk for combinations including other conditions (e.g., mental health conditions). The main limitations are that SAIL databank represents only part of the UK (Wales only) and that in both cohorts we lacked data on severity of the LTCs included.
Conclusions: In this study, we observed that UK Biobank accurately estimates relative risk of mortality, unscheduled hospitalisation, and MACE associated with LTC counts ≤3. However, for counts ≥4, and for some LTC combinations, estimates of magnitude of association from UK Biobank are likely to be conservative. Researchers should be mindful of these limitations of UK Biobank when conducting and interpreting analyses of multimorbidity. Nonetheless, the richness of data available in UK Biobank does offers opportunities to better understand multimorbidity, particularly where complementary data sources less susceptible to selection bias can be used to inform and qualify analyses of UK Biobank.
Conflict of interest statement
I have read the journal’s policy and the authors of this manuscript have the following competing interests: FM is principal supervisor of PH (first author) who is funded by a MRC Clinical Research Training Fellowship (Grant reference: MR/S021949/1) which supported PH to do this work. FM is also Principle Investigator or Co-Investigator on grants funded by the MRC, NIHR, Wellcome, CSO, and EPSRC to undertake multimorbidity research. The funds go to FM’s institution, the University of Glasgow.
Figures


Similar articles
-
Multimorbidity in a selected cohort compared to a representative sample: Does selection bias influence outcomes?Ann Fam Med. 2022 Apr 1;20(20 Suppl 1):2901. doi: 10.1370/afm.20.s1.2901. Ann Fam Med. 2022. PMID: 36696232 Free PMC article.
-
Hospitalisation events in people with chronic kidney disease as a component of multimorbidity: parallel cohort studies in research and routine care settings.BMC Med. 2021 Nov 19;19(1):278. doi: 10.1186/s12916-021-02147-6. BMC Med. 2021. PMID: 34794437 Free PMC article.
-
Patterns of multimorbidity and their effects on adverse outcomes in rheumatoid arthritis: a study of 5658 UK Biobank participants.BMJ Open. 2020 Nov 23;10(11):e038829. doi: 10.1136/bmjopen-2020-038829. BMJ Open. 2020. PMID: 33234629 Free PMC article.
-
Folic acid supplementation and malaria susceptibility and severity among people taking antifolate antimalarial drugs in endemic areas.Cochrane Database Syst Rev. 2022 Feb 1;2(2022):CD014217. doi: 10.1002/14651858.CD014217. Cochrane Database Syst Rev. 2022. PMID: 36321557 Free PMC article.
-
Associations between multimorbidity and adverse clinical outcomes in patients with chronic kidney disease: a systematic review and meta-analysis.BMJ Open. 2020 Jun 30;10(6):e038401. doi: 10.1136/bmjopen-2020-038401. BMJ Open. 2020. PMID: 32606067 Free PMC article.
Cited by
-
Ethnic differences in multimorbidity after accounting for social-economic factors, findings from The Health Survey for England.Eur J Public Health. 2023 Dec 9;33(6):959-967. doi: 10.1093/eurpub/ckad146. Eur J Public Health. 2023. PMID: 37634091 Free PMC article.
-
Assessing trial representativeness using serious adverse events: an observational analysis using aggregate and individual-level data from clinical trials and routine healthcare data.BMC Med. 2022 Oct 28;20(1):410. doi: 10.1186/s12916-022-02594-9. BMC Med. 2022. PMID: 36303169 Free PMC article.
-
A prognostic risk score for development and spread of chronic pain.Nat Med. 2023 Jul;29(7):1821-1831. doi: 10.1038/s41591-023-02430-4. Epub 2023 Jul 6. Nat Med. 2023. PMID: 37414898 Free PMC article.
-
Frailty in COPD: an analysis of prevalence and clinical impact using UK Biobank.BMJ Open Respir Res. 2022 Jul;9(1):e001314. doi: 10.1136/bmjresp-2022-001314. BMJ Open Respir Res. 2022. PMID: 35787523 Free PMC article.
-
Frailty in rheumatoidrmdopen-2021-002111 arthritis and its relationship with disease activity, hospitalisation and mortality: a longitudinal analysis of the Scottish Early Rheumatoid Arthritis cohort and UK Biobank.RMD Open. 2022 Mar;8(1):e002111. doi: 10.1136/rmdopen-2021-002111. RMD Open. 2022. PMID: 35292529 Free PMC article.
References
-
- van Oostrom SH, Gijsen R, Stirbu I, Korevaar JC, Schellevis FG, Picavet HSJ, et al. Time trends in prevalence of chronic diseases and multimorbidity not only due to aging: data from general practices and health surveys. PLoS ONE. 2016;11(8):e0160264. doi: 10.1371/journal.pone.0160264 - DOI - PMC - PubMed
Publication types
MeSH terms
Grants and funding
LinkOut - more resources
Full Text Sources
