. 2022 Jun 15;225(12):2187-2196.
doi: 10.1093/infdis/jiac086.

Transcriptome Analysis of Plasmodium falciparum Isolates From Benin Reveals Specific Gene Expression Associated With Cerebral Malaria

Collaborators, Affiliations

Transcriptome Analysis of Plasmodium falciparum Isolates From Benin Reveals Specific Gene Expression Associated With Cerebral Malaria

E Guillochon et al. J Infect Dis. .

Abstract

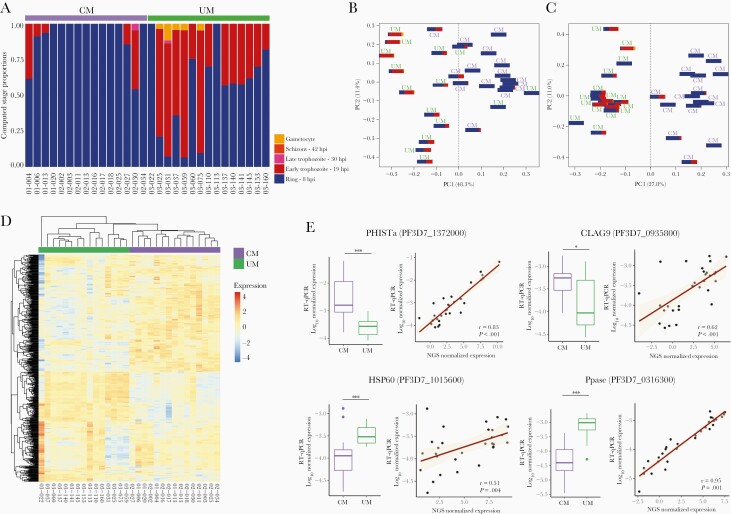
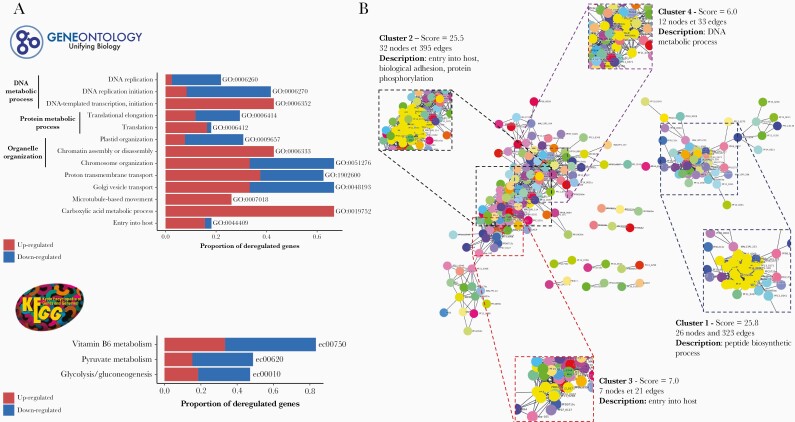
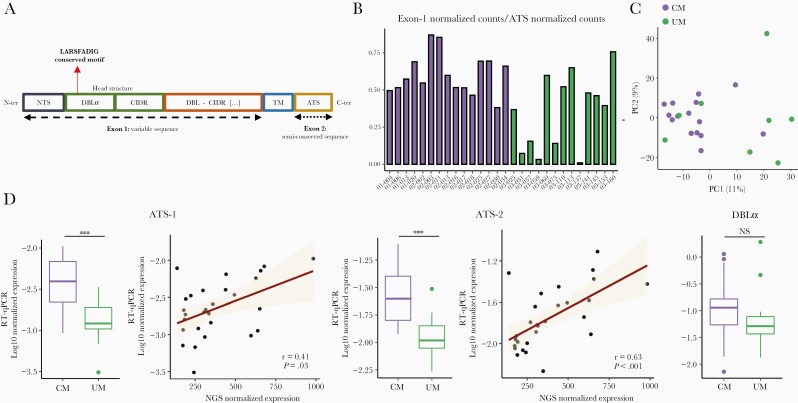
Cerebral malaria (CM) is the severest form of Plasmodium falciparum infection. Children under 5 years old are those most vulnerable to CM, and they consequently have the highest risk of malaria-related death. Parasite-associated factors leading to CM are not yet fully elucidated. We therefore sought to characterize the gene expression profile associated with CM, using RNA sequencing data from 15 CM and 15 uncomplicated malaria isolates from Benin. Cerebral malaria parasites displayed reduced circulation times, possibly related to higher cytoadherence capacity. Consistent with the latter, we detected increased var genes abundance in CM isolates. Differential expression analyses showed that distinct transcriptome profiles are signatures of malaria severity. Genes involved in adhesion, excluding variant surface antigens, were dysregulated, supporting the idea of increased cytoadhesion capacity of CM parasites. Finally, we found dysregulated expression of genes in the entry into host pathway that may reflect greater erythrocyte invasion capacity of CM parasites.

Keywords: Plasmodium falciparum; var genes; cerebral malaria; cytoadherence; transcriptomics.


Figures

Figure 1.
Figure 1.
Cerebral malaria (CM) and uncomplicated malaria (UM) parasites gene expression. (A) Proportions of ring, early trophozoite, late trophozoite, schizont, and gametocyte stage parasites in each sample. (B) Principal component analysis (PCA) plots of the all-gene expression normalized for library size (read counts available in Supplemental Table 1); (C) PCA plot of gene expression normalized for library size, life-cycle stage effect, and unwanted variations (read counts available in Supplemental Table 1). (D) Heatmap of differentially expressed genes. An upregulated expression is represented in red and the downregulation is in blue. (E) Distribution of normalized expression values measured by RT-qPCR in CM and UM is represented (boxplot). The P values were calculated with the Mann-Whitney U test and are represented by as follows: *** <.001, ** <.01, and * <.05. The correlation between the normalized expression values measured by RT-qPCR and RNA-seq was represented through the regression line and tested by the Spearman rank test (Spearman rank correlation coefficient ρ and P values are shown).
Figure 2.
Figure 2.
Gene set enrichment analysis (GSEA) and protein-protein interaction (PPI) network of differential expression (DE) genes analysis. (A) Gene Ontology (GO) and Kyoto Encyclopedia of Genes and Genomes (KEGG) pathways enrichment analysis. Barplots show the proportion of deregulated genes in each pathway. Upregulated genes in cerebral malaria (CM) are in red and downregulated in CM are in blue. (B) String’s PPI network of DE genes. Cluster found with MCode and associated pathways are shown.
Figure 3.
Figure 3.
var genes expression. (A) Plasmodium falciparum Erythrocyte Membrane Protein 1 (PfEMP1) schematic organization. (B) Proportion of assembled var genes in each sample. We compared the number of reads mapped to exon 1 and ATS to assess the quality of reconstructions. (C) Principal component analysis (PCA) based on var genes domains expression. (D) Var genes expression based on DBLα and ATS domains. Distribution of normalized expression values measured by RT-qPCR in cerebral malaria (CM) and uncomplicated malaria (UM) is represented (boxplot). The P values were calculated with the Mann-Whitney U test and are represented as follows: *** <.001, ** <.01, and * <.05. The correlation between the normalized expression values measured by RT-qPCR and RNA-seq was represented through the regression line and tested by the Spearman rank test (Spearman rank correlation coefficient ρ and P values are shown).

References

    1. World malaria report 2021. Available at: https://www.who.int/publications-detail-redirect/9789240040496. Accessed 18 January 2022.
    1. Turner L, Lavstsen T, Berger SS, et al. . Severe malaria is associated with parasite binding to endothelial protein C receptor. Nature 2013; 498:502–5. - PMC - PubMed
    1. Silamut K, Phu NH, Whitty C, et al. . A quantitative analysis of the microvascular sequestration of malaria parasites in the human brain. Am J Pathol 1999; 155:395–410. - PMC - PubMed
    1. Miller LH, Baruch DI, Marsh K, Doumbo OK.. The pathogenic basis of malaria. Nature 2002; 415:673–9. - PubMed
    1. Tonkin-Hill GQ, Trianty L, Noviyanti R, et al. . The Plasmodium falciparum transcriptome in severe malaria reveals altered expression of genes involved in important processes including surface antigen-encoding var genes. PLoS Biol 2018; 16:e2004328. - PMC - PubMed

Publication types

Substances