. 2022 May:51:102272.
doi: 10.1016/j.redox.2022.102272. Epub 2022 Feb 18.

UBIAD1 and CoQ10 protect melanoma cells from lipid peroxidation-mediated cell death

Affiliations

UBIAD1 and CoQ10 protect melanoma cells from lipid peroxidation-mediated cell death

Liaisan Arslanbaeva et al. Redox Biol. 2022 May.

Abstract

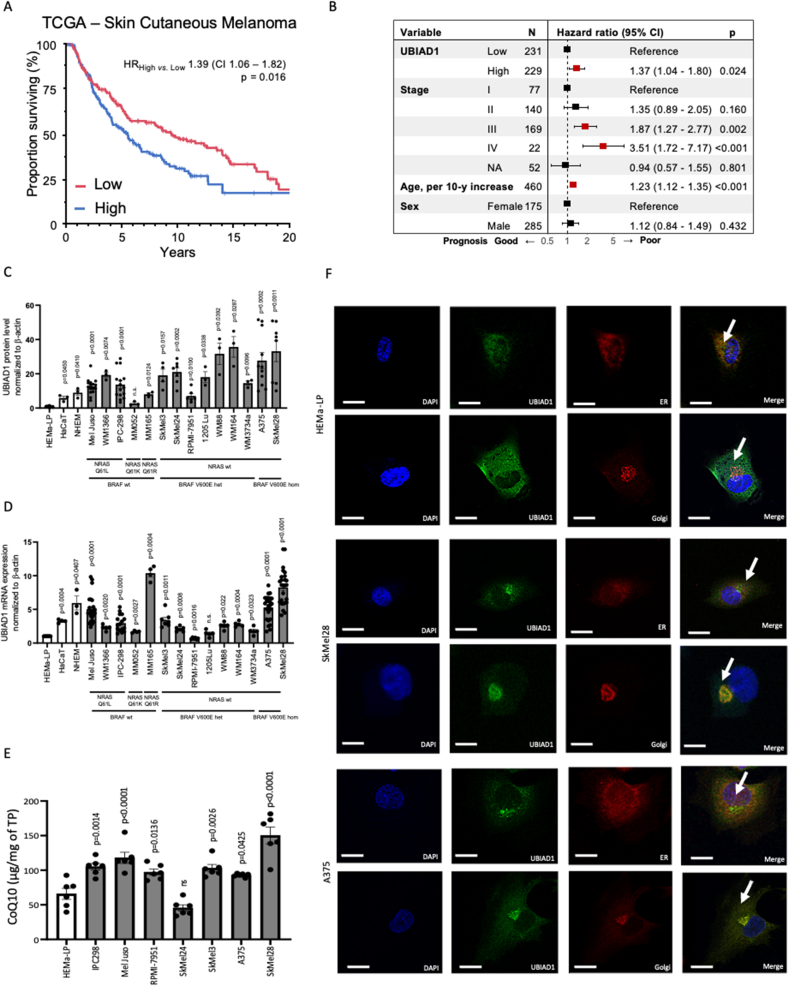
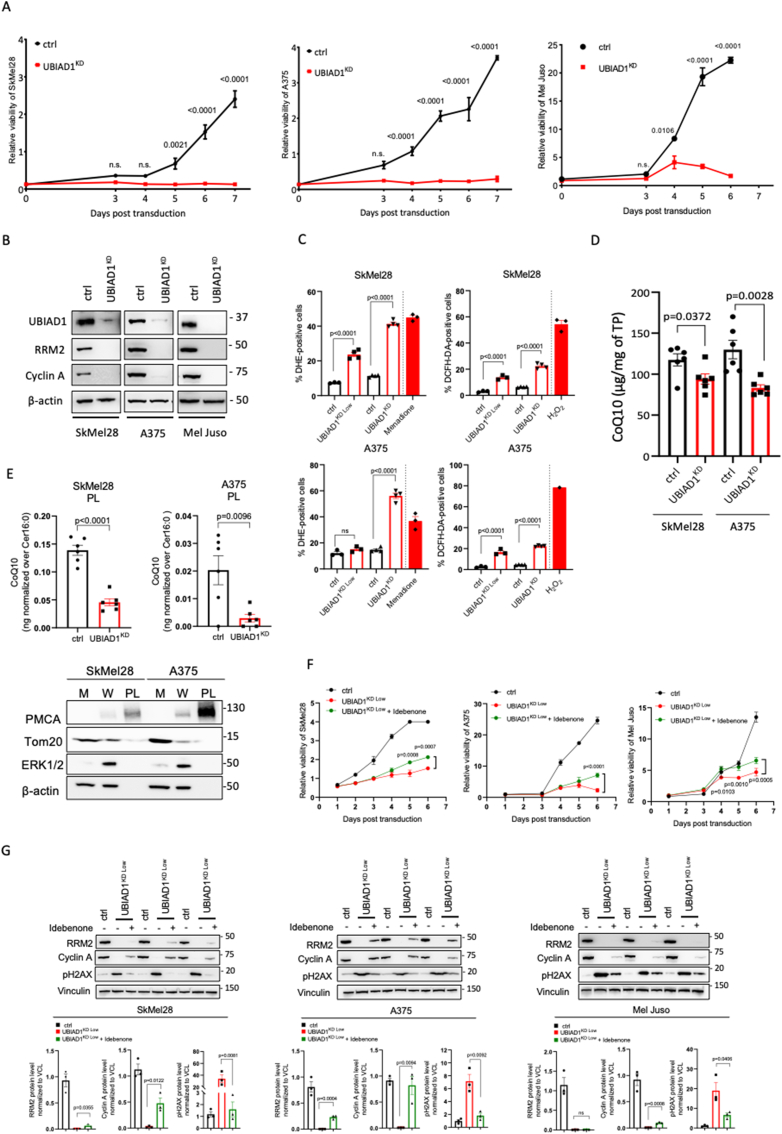
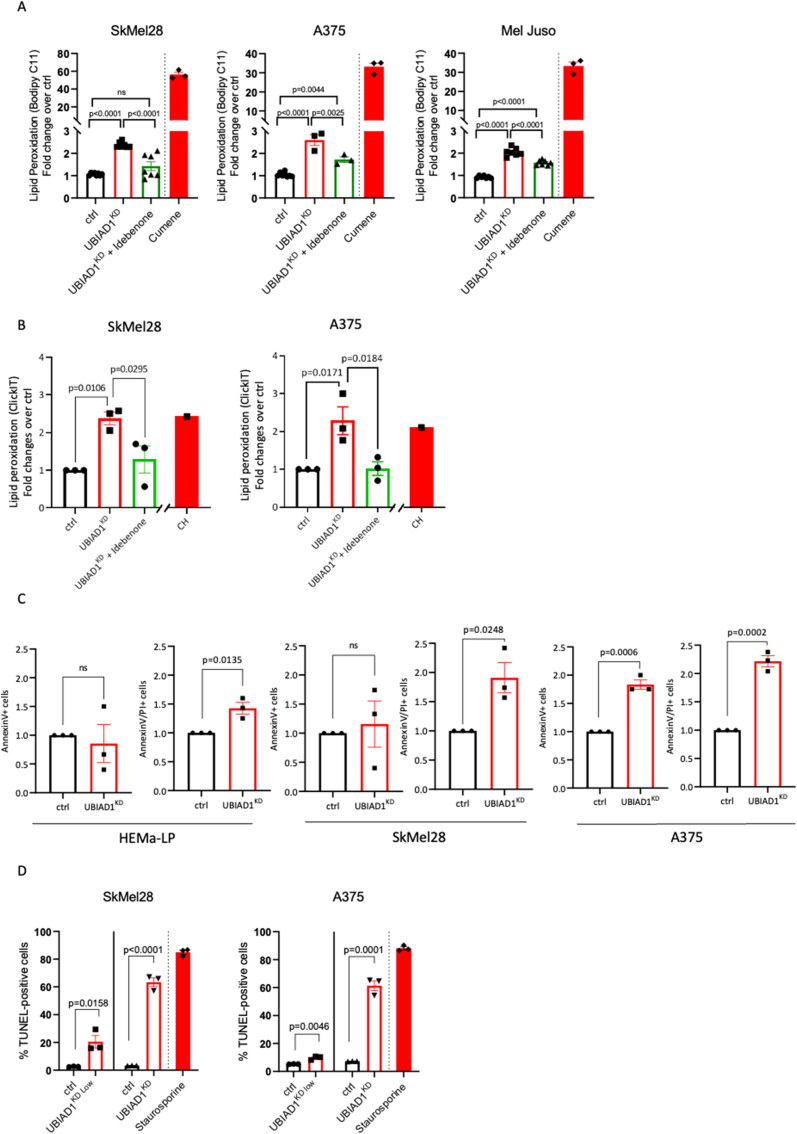
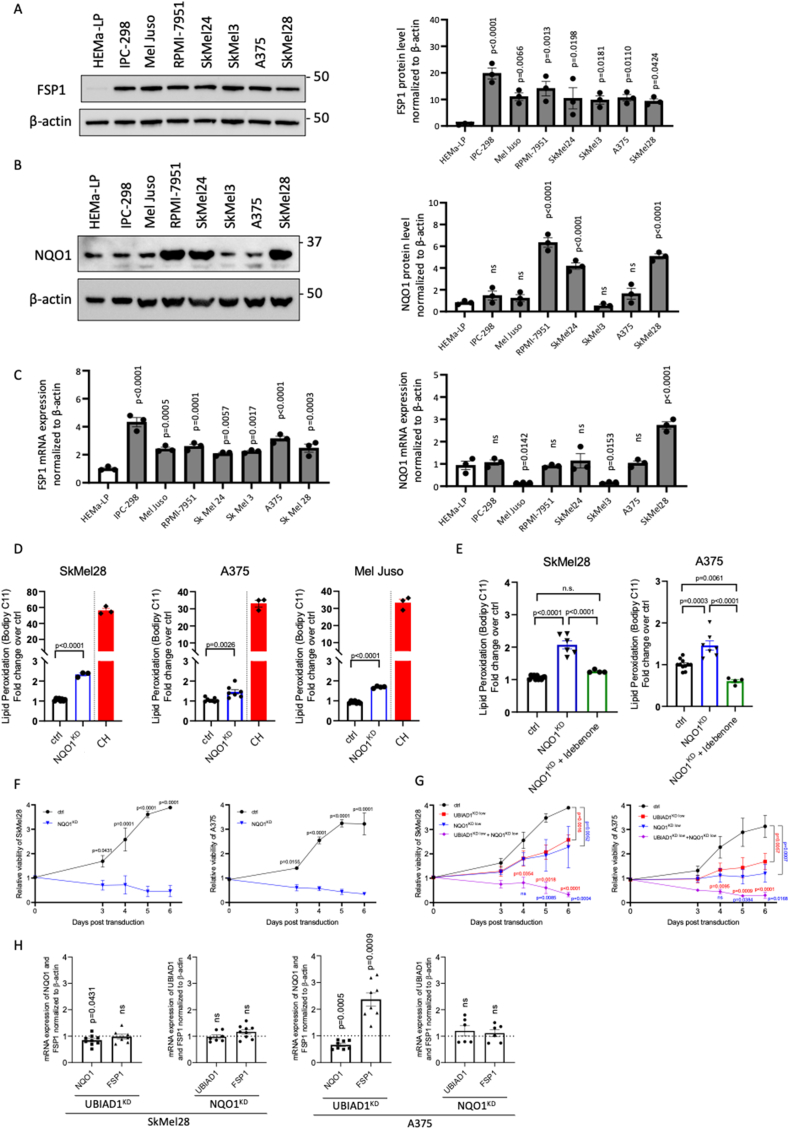
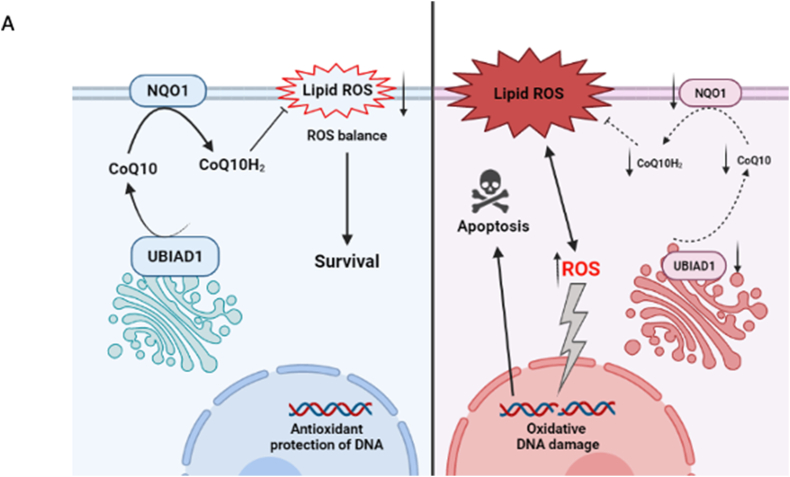
Cutaneous melanoma is the deadliest type of skin cancer, although it accounts for a minority of all skin cancers. Oxidative stress is involved in all stages of melanomagenesis and cutaneous melanoma can sustain a much higher load of Reactive Oxygen Species (ROS) than normal tissues. Melanoma cells exploit specific antioxidant machinery to support redox homeostasis. The enzyme UBIA prenyltransferase domain-containing protein 1 (UBIAD1) is responsible for the biosynthesis of non-mitochondrial CoQ10 and plays an important role as antioxidant enzyme. Whether UBIAD1 is involved in melanoma progression has not been addressed, yet. Here, we provide evidence that UBIAD1 expression is associated with poor overall survival (OS) in human melanoma patients. Furthermore, UBIAD1 and CoQ10 levels are upregulated in melanoma cells with respect to melanocytes. We show that UBIAD1 and plasma membrane CoQ10 sustain melanoma cell survival and proliferation by preventing lipid peroxidation and cell death. Additionally, we show that the NAD(P)H Quinone Dehydrogenase 1 (NQO1), responsible for the 2-electron reduction of CoQ10 on plasma membranes, acts downstream of UBIAD1 to support melanoma survival. By showing that the CoQ10-producing enzyme UBIAD1 counteracts oxidative stress and lipid peroxidation events in cutaneous melanoma, this work may open to new therapeutic investigations based on UBIAD1/CoQ10 loss to cure melanoma.

Keywords: Antioxidant response; CoQ10; Lipid peroxidation; Melanoma; NQO1; UBIAD1.


Figures

Fig. 1
Fig. 1
High UBIAD1 expression is associated with poor survival of melanoma patients and with melanoma cell lines. (A) Kaplan-Meier survival plot (truncated at 20 years) showing the proportion of surviving patients (OS) stratified according to the UBIAD1 mRNA expression levels (High vs. Low) in the TCGA-SKCM cohort. HR, univariable Hazard Ratio; CI, 95% Confidence Interval; p, p-value. (B) Forest plot showing multivariable hazard ratios, 95% confidence intervals (CI), and p values for the association between the indicated factors and good (HR < 1) or bad (HR > 1) prognosis in patients stratified by their UBIAD1 (High vs. Low) mRNA expression level. NA, Not Available. (C) Comparison of UBIAD1 protein level in different human melanocytes (NHEM, HEMa-LP), human epidermal keratinocyte (HaCaT) and melanoma cell lines. UBIAD1 level was normalized to β-actin and reported as relative to HEMa-LP (set at 1). One-sample t-test (hypothetical mean = 1) was used to quantify statistical significance. Error bars represent SEM, n ≥ 3. NRAS and BRAF mutation status was reported under each melanoma cell line: wt, wild type; het, heterozygous and hom, homozygous. (D) qRT-PCR quantifications of UBIAD1 mRNA levels in a panel of cell lines. UBIAD1 mRNA level was normalized to β-actin and reported as relative to HEMa-LP (set at 1). One-sample t-test (hypothetical mean = 1) was used to quantify statistical significance. Error bars represent SEM, n ≥ 3. NRAS and BRAF mutation status was reported under each melanoma line: wt, wild type; het, heterozygous and hom, homozygous. (E) HPLC-MS analyses of CoQ10 in different melanoma cell lines, normalized to total protein (TP) concentration. 1-w ay ANOVA with Dunnett‘s multiple comparisons test (HEMa-LP as a control) was used to quantify statistical significance. Error bars represent SEM, n = 6. (F) Subcellular co-localization of UBIAD1. Confocal images showed prevalent UBIAD1 co-localization with ER marker calreticulin in HEMa-LP melanocytes and prevalent UBIAD1 co-localization with Golgi marker GM130 in melanoma cell lines SkMel28 and A375. Image scale bars = 15 μm.
Fig. 2
Fig. 2
UBIAD1 loss leads to ROS increase, impaired cell proliferation and decreased survival in melanoma cells. (A) Growth curves of melanoma cell lines SkMel28, A375 and Mel Juso upon UBIAD1KD compared to control conditions (ctrl). 2-way ANOVA with Sidak's multiple comparisons test was used to quantify statistical significance. Error bars represent SEM, n = 3. (B) Western blot analysis of cyclin A and RRM2 proteins upon UBIAD1KD in SkMel28, A375 and Mel Juso melanoma cell lines. β-actin was used as loading control. (C) FACS assay of DHE (left) and DCFH-DA (right) staining in SkMel28 and A375 upon UBIAD1KD Low or UBIAD1KD. Data are reported as percentage of positive cells over singlets. Incubation with 50 μM of menadione and 1 mM of H2O2 for 90 min were used as positive controls for DHE and DCFH-DA, respectively. One-way ANOVA with Sidak’s multiple comparisons test was used to quantify statistical significance. Error bars represent SEM, n ≥ 3. (D) HPLC-MS analyses of total CoQ10 level upon UBIAD1KD in SkMel28 and A375 lines, in comparison control conditions (ctrl), normalized to total protein (TP) concentration. Unpaired Student two-tailed t-test was used to quantify statistical significance between control and UBIAD1KD samples. Error bars represent SEM, n = 6. (E) HPLC-MS analyses of CoQ10 in plasma membrane fraction (PL) upon UBIAD1KD in SkMel28 and A375 lines normalized to membrane ceramide abundance (Cer16:0). Unpaired Student two-tailed t-test was used to quantify statistical significance between control conditions (ctrl) and UBIAD1KD samples. Error bars represent SEM, n = 6. Below, Western blot analysis of subcellular fractionation in SkMel28 and A375 lines. M, Mitochondria-enriched fraction; W, Whole cell; PL, Plasma membrane-enriched fraction. PMCA was used as marker of plasma membrane, Tom20 as mitochondrial marker, ERK1/2 and β-actin as cytosolic markers. (F) Growth curves of melanoma cell lines SkMel28, A375 and Mel Juso upon UBIAD1KD Low in presence or absence of idebenone treatment (1 μM idebenone for SkMel28, 10 μM idebenone for A375 and 50 nM idebenone for Mel Juso). 2-way ANOVA with Sidak's multiple comparisons test was used to quantify statistical significance between UBIAD1KD Low and UBIAD1KD Low + idebenone. Error bars represent SEM, n = 3. (G) Western blot analysis of cell proliferation markers (RRM2 and cyclin A) and DNA-damage marker (pH2AX) in melanoma cell lines SkMel28, A375 and Mel Juso upon UBIAD1KD Low in presence or absence of idebenone (100 nM of idebenone for SkMel28, 200 nM of idebenone for A375 and 200 nM idebenone for Mel Juso). Three biological replicates are shown. Unpaired Student two-tailed t-test was used to quantify statistical significance between UBIAD1KD Low and UBIAD1KD Low + idebenone samples. Error bars represent SEM, n = 3.
Fig. 3
Fig. 3
UBIAD1 and plasma membrane CoQ10 protect melanoma cells from lipid peroxidation and apoptotic cell death. (A) Lipid peroxidation assay using Bodipy C11 581/591 FACS upon UBIAD1KD in presence or absence of idebenone treatment (100 nM of idebenone for SkMel28, 200 nM of idebenone for A375 and 200 nM of idebenone for Mel Juso). Ratio between oxidized and reduced Bodipy C11 was measured and reported as fold change over control conditions (ctrl). For positive control, cells were treated for 30 min with 100 μM of cumene hydroxyperoxide (CH). One-way ANOVA with Tukey's multiple comparisons test was used to quantify statistical significance. Error bars represent SEM, n ≥ 3. (B) Quantification of lipid peroxidation in melanoma cells, induced upon UBIAD1KD, assessed by Click-iT method. Statistical significance was quantified by 1-way ANOVA using Sidak's multiple comparisons test. Error bars represent SEM, n = 3. (C) Relative viability after UBIAD1KD in melanocytes (HEMa-LP) and melanoma cells assessed by AnnexinV/PI flow cytometry after lentiviral transduction. Alive cells are defined as events negative for both PI and AnnexinV. Error bars represent SEM, n = 3. (D) Analysis of apoptosis by FACS TUNEL assay in melanoma lines SkMel28 and A375 upon UBIAD1KD Low and UBIAD1KD. Data are shown as % of apoptotic cells (TUNEL-positive) over singlets. As positive control, cells were treated with 1 μM of staurosporine for 16 h. Unpaired Student two-tailed t-test was used to quantify statistical significance between ctrl and UBIAD1KD Low or UBIAD1KD samples. Error bars represent SEM, n = 3.
Fig. 4
Fig. 4
NQO1 is required to suppress lipid peroxidation by regeneration of the antioxidant form of CoQ10 in melanoma cells. (A–B) Western blot analyses and relative quantifications of FSP1 (A) and NQO1 (B) protein levels in a panel of melanoma cell lines, normalized to protein level in melanocytes (HEMa-LP). 1-way ANOVA with Dunnett’s multiple comparisons test (HEMa-LP as a control) was used to quantify statistical significance. Error bars represent SEM, n ≥ 4. (C) mRNA expression of FSP1 and NQO1 in a panel of melanoma cell lines. 1-way ANOVA with Dunnett‘s multiple comparisons test (HEMa-LP as a control) was used to quantify statistical significance. Error bars represent SEM, n = 3. (D) Lipid peroxidation assay using Bodipy C11 581/591 FACS upon NQO1KD in melanoma cell lines SkMel28, A375 and Mel Juso. Ratio between oxidized and reduced Bodipy C11 was measured and reported as fold change over control conditions (ctrl). As positive control, cells were treated for 30 min with 100 μM of CH. Unpaired Student two-tailed t-test was used to quantify statistical significance. Error bars represent SEM, n ≥ 3. (E) Idebenone rescue of lipid peroxidation upon NQO1KD. Lipid peroxidation was assessed using Bodipy C11 FACS upon NQO1KD in melanoma cell lines SkMel28 and A375 in presence or absence of idebenone (100 nM of idebenone for SkMel28, 200 nM of idebenone for A375). Ratio between oxidized and reduced Bodipy C11 was measured and reported as fold change over control conditions (ctrl). One-way ANOVA with Tukey's multiple comparisons test was used to quantify statistical significance. Error bars represent SEM, n ≥ 3. (F) NQO1 knockdown impairs viability of melanoma cells. Growth curves of melanoma cell lines SkMel28 and A375 upon NQO1KD compared to control conditions (ctrl). 2-way ANOVA was used to quantify statistical significance. Error bars represent SEM, n = 3. (G) Co-silencing of NQO1 and UBIAD1 dramatically impairs viability of melanoma cells. Growth curves of melanoma cell lines SkMel28 and A375 upon mild NQO1KD (NQO1KD Low), mild UBIAD1KD(UBIAD1KD Low), or simultaneous NQO1KD Low + UBIAD1KD Low compared to control conditions (ctrl). 2-way ANOVA was used to quantify statistical significance. Error bars represent SEM, n ≥ 3. (H) qRT-PCR quantifications of UBIAD1, NQO1 and FSP1 mRNA levels in UBIAD1KD or NQO1KD melanoma cells. One-sample t-test (hypothetical mean = 1) was used to quantify statistical significance. Error bars represent SEM, n ≥ 6.
Fig. 5
Fig. 5
Schematic representation of UBIAD1-mediated CoQ10 protection against lipid peroxidation in melanoma cells. (A) Proposed mechanism of UBIAD1- and NQO1-mediated protection against lipid peroxidation in the normal situation (on the left): non-mitochondrial CoQ10 is synthesized by UBIAD1 in Golgi and transported to plasma membrane, where it is reduced by NQO1 to protect against lipid peroxidation (the scheme is designed using Biorender.com). In UBIAD1KD and NQO1KD cells (on the right) loss of reduced plasma membrane CoQ10 leads to lipid peroxidation, increased ROS levels and apoptotic cell death.

References

    1. Arslanbaeva L.R., Santoro M.M. Adaptive redox homeostasis in cutaneous melanoma. Redox Biol. 2020;37:101753. - PMC - PubMed
    1. Hambright H.G., Meng P., Kumar A.P., Ghosh R. Inhibition of PI3K/AKT/mTOR axis disrupts oxidative stress-mediated survival of melanoma cells. Oncotarget. 2015;6:7195–7208. - PMC - PubMed
    1. Bishal Paudel B., Lewis J.E., Hardeman K.N., Hayford C.E., Robbins C.J., Stauffer P.E., Codreanu S.G., Sherrod S.D., McLean J.A., Kemp M.L., Quatanta V. An integrative gene expression and mathematical flux balance analysis identifies targetable redox vulnerabilities in melanoma cells. Cancer Res. 2021;80:4565–4577. - PMC - PubMed
    1. Dadali T., Diers A.R., Kazerounian S., Muthuswamy S.K., Awate P., Ng R., Mogre S., Spencer C., Krumova K., Rockwell H.E., McDaniel J., Chen E.Y., Gao F., Diedrich K.T., Vemulapalli V., Rodrigues L.O., Akmaev V.R., Thapa K., Hidalgo M., Bose A., Vishnudas V.K., Moser J.A., Granger E., Kiebish M.A., Gesta S., Narain N.R., Sarangarajan R. Elevated levels of mitochondrial CoQ10 induce ROS-mediated apoptosis in pancreatic cancer. Sci. Rep. 2021;11:1–16. - PMC - PubMed
    1. Tasdogan A., Ubellacker J.M., Morrison S.J. Redox regulation in cancer cells during metastasis. Cancer Discov. 2021;11:2682–2692. - PMC - PubMed