. 2022 Jul;607(7917):97-103.
doi: 10.1038/s41586-022-04576-6. Epub 2022 Mar 7.

Whole-genome sequencing reveals host factors underlying critical COVID-19

Athanasios Kousathanas #  1 Erola Pairo-Castineira #  2   3 Konrad Rawlik  2 Alex Stuckey  1 Christopher A Odhams  1 Susan Walker  1 Clark D Russell  2   4 Tomas Malinauskas  5 Yang Wu  6 Jonathan Millar  2 Xia Shen  7   8 Katherine S Elliott  5 Fiona Griffiths  2 Wilna Oosthuyzen  2 Kirstie Morrice  9 Sean Keating  10 Bo Wang  2 Daniel Rhodes  1 Lucija Klaric  3 Marie Zechner  2 Nick Parkinson  2 Afshan Siddiq  1 Peter Goddard  1 Sally Donovan  1 David Maslove  11 Alistair Nichol  12 Malcolm G Semple  13   14 Tala Zainy  1 Fiona Maleady-Crowe  1 Linda Todd  1 Shahla Salehi  1 Julian Knight  5 Greg Elgar  1 Georgia Chan  1 Prabhu Arumugam  1 Christine Patch  1 Augusto Rendon  1 David Bentley  15 Clare Kingsley  15 Jack A Kosmicki  16 Julie E Horowitz  16 Aris Baras  16 Goncalo R Abecasis  16 Manuel A R Ferreira  16 Anne Justice  17 Tooraj Mirshahi  17 Matthew Oetjens  17 Daniel J Rader  18 Marylyn D Ritchie  18 Anurag Verma  18 Tom A Fowler  1   19 Manu Shankar-Hari  20 Charlotte Summers  21 Charles Hinds  22 Peter Horby  23 Lowell Ling  24 Danny McAuley  25   26 Hugh Montgomery  27 Peter J M Openshaw  28   29 Paul Elliott  30 Timothy Walsh  10 Albert Tenesa  2   3   8 GenOMICC investigators23andMe investigatorsCOVID-19 Human Genetics InitiativeAngie Fawkes  9 Lee Murphy  9 Kathy Rowan  31 Chris P Ponting  3 Veronique Vitart  3 James F Wilson  3   8 Jian Yang  32   33 Andrew D Bretherick  3 Richard H Scott  1   34 Sara Clohisey Hendry  2 Loukas Moutsianas  1 Andy Law  2 Mark J Caulfield  35   36 J Kenneth Baillie  37   38   39   40
Collaborators, Affiliations

Whole-genome sequencing reveals host factors underlying critical COVID-19

Athanasios Kousathanas et al. Nature. 2022 Jul.

Abstract

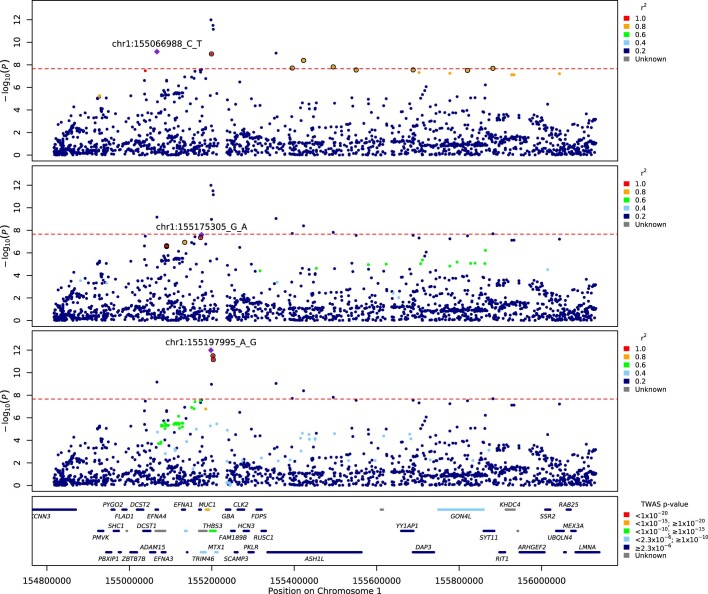
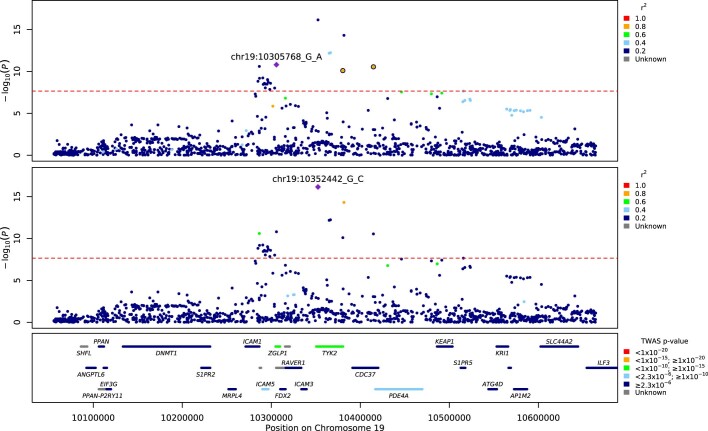
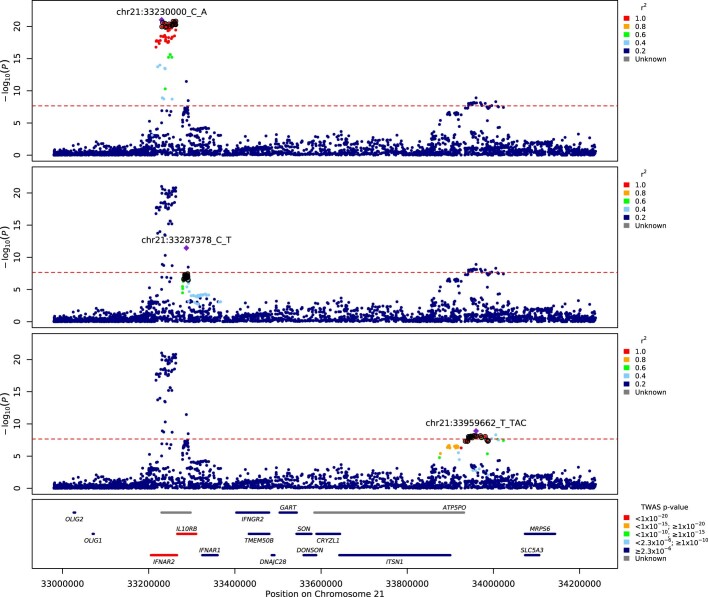
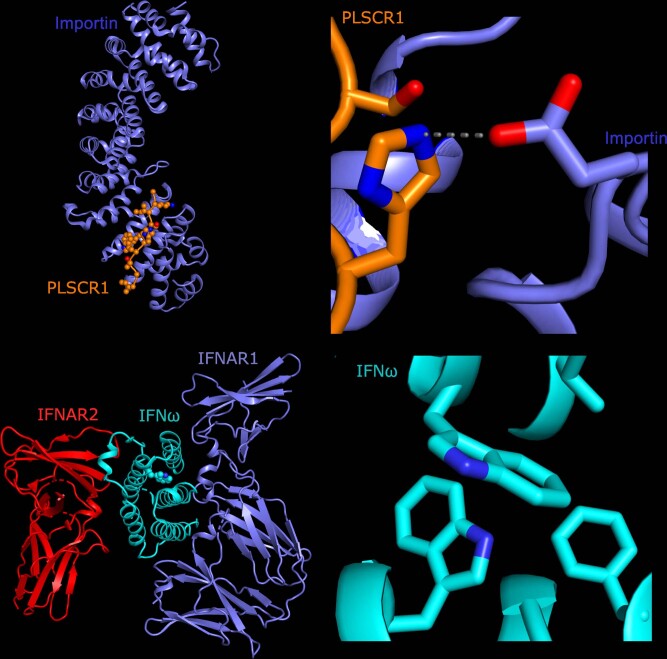
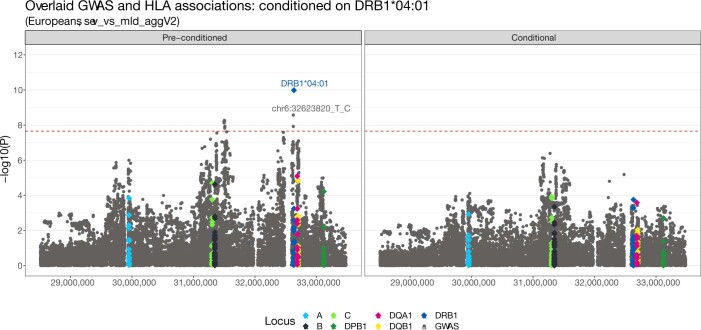
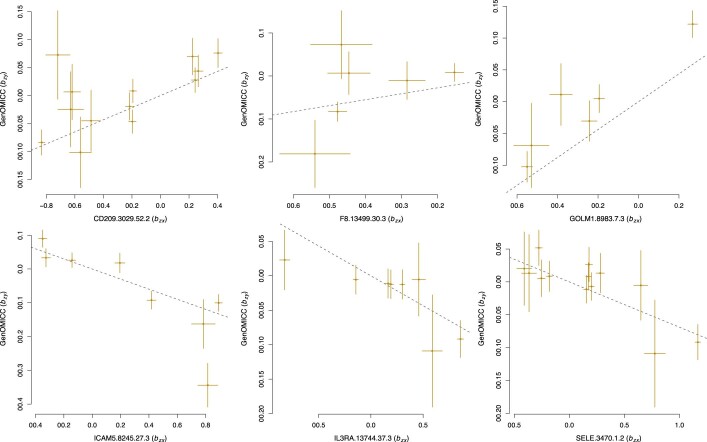
Critical COVID-19 is caused by immune-mediated inflammatory lung injury. Host genetic variation influences the development of illness requiring critical care1 or hospitalization2-4 after infection with SARS-CoV-2. The GenOMICC (Genetics of Mortality in Critical Care) study enables the comparison of genomes from individuals who are critically ill with those of population controls to find underlying disease mechanisms. Here we use whole-genome sequencing in 7,491 critically ill individuals compared with 48,400 controls to discover and replicate 23 independent variants that significantly predispose to critical COVID-19. We identify 16 new independent associations, including variants within genes that are involved in interferon signalling (IL10RB and PLSCR1), leucocyte differentiation (BCL11A) and blood-type antigen secretor status (FUT2). Using transcriptome-wide association and colocalization to infer the effect of gene expression on disease severity, we find evidence that implicates multiple genes-including reduced expression of a membrane flippase (ATP11A), and increased expression of a mucin (MUC1)-in critical disease. Mendelian randomization provides evidence in support of causal roles for myeloid cell adhesion molecules (SELE, ICAM5 and CD209) and the coagulation factor F8, all of which are potentially druggable targets. Our results are broadly consistent with a multi-component model of COVID-19 pathophysiology, in which at least two distinct mechanisms can predispose to life-threatening disease: failure to control viral replication; or an enhanced tendency towards pulmonary inflammation and intravascular coagulation. We show that comparison between cases of critical illness and population controls is highly efficient for the detection of therapeutically relevant mechanisms of disease.


Conflict of interest statement

J.A.K., J.E.H., A.B., G.R.A. and M.A.R.F. are current employees and/or stockholders of Regeneron Genetics Center or Regeneron Pharmaceuticals. Genomics England is a wholly owned Department of Health and Social Care company created in 2013 to work with the NHS to introduce advanced genomic technologies and analytics into healthcare. All Genomics England affiliated authors are, or were, salaried by Genomics England during this programme. All other authors declare that they have no competing interests relating to this work.

Figures

Fig. 1
Fig. 1. GWAS results for the EUR ancestry group, and multi-ancestry meta-analysis.
Manhattan plots are shown on the left and quantile–quantile (QQ) plots of observed versus expected P values on the right, with genomic inflation (λ) displayed for each analysis. Highlighted results in blue in the Manhattan plots indicate variants that are LD-clumped (r2 = 0.1, P2 = 0.01, EUR LD) with the lead variants at each locus. Gene name annotation indicates genes that are affected by the predicted worst consequence type of each lead variant (annotation by Variant Effect Predictor (VEP)). For the HLA locus, the gene that was identified by HLA allele analysis is annotated. The GWAS was performed using logistic regression and meta-analysed by the inverse variant method. The red dashed line shows the Bonferroni-corrected P value: P = 2.2 × 10−8.
Fig. 2
Fig. 2. Gene-level Manhattan plot showing results from the TWAS meta-analysis and highlighting genes that colocalize with GWAS signals or have strong metaTWAS associations.
The highlighting colour is different for the lung and blood tissue data that were used for colocalization, and we also distinguish loci that were significant in both. Results are grouped according to two classes for the posterior probability of colocalization (PPH4): P > 0.5 and P > 0.8. If a variant is placed in both classes, then the colour that corresponds to the higher probability class is shown. Arrowheads indicate the direction of change in gene expression associated with an increased disease risk. The red dashed line shows the Bonferroni-corrected significance threshold for the metaTWAS analysis at P = 2.3 × 10−6.
Fig. 3
Fig. 3. Regional detail showing fine-mapping to identify two adjacent independent signals on chromosome 3.
Top two panels, variants in LD with the lead variants shown. The variants that are included in two independent credible sets are displayed with black outline circles. The r2 values in the key denote upper limits; that is, 0.2 = [0, 0.2], 0.4 = [0.2, 0.4], 0.6 = [0.4, 0.6], 0.8 = [0.6, 0.8],1 = [0.8, 1]. Bottom, locations of protein-coding genes, coloured by TWAS P value. The red dashed line shows the Bonferroni-corrected P value: P = 2.2 × 10−8 for individuals of European ancestry.
Extended Data Fig. 1
Extended Data Fig. 1. Analysis workflow for GWAS and AVT analyses of this study.
The cohorts displayed in yellow and green in the top box were processed with Genomics England Pipeline 2.0 and Illumina NSV4, respectively (see Methods on WGS Alignment and variant calling for details on differences between pipelines). We used individuals that were processed with either pipeline for the GWAS analyses and individuals processed only with Genomics England Pipeline 2.0 for the AVT analyses. The definition of the cases and controls was the same for GWAS and AVT, cases were the COVID-19 severe individuals for both, and controls included individuals from the 100,000 Genomes Project (100,000 Genomes Project) and also COVID-19 positive individuals that were recruited for this study and experienced only mild symptoms (COVID-mild).
Extended Data Fig. 2
Extended Data Fig. 2. Regional detail showing fine-mapping to identify three adjacent independent signals on chromosome 1.
Top two panels: variants in LD with the lead variants shown. The variants that are included in two independent credible sets are displayed with black outline circles. r2 values in the legend denote upper limits, 0.2=[0,0.2], 0.4=[0.2,0.4], 0.6=[0.4,0.6], 0.8=[0.6,0.8],1=[0.8,1]. Bottom panel: locations of protein-coding genes, coloured by TWAS P-value. The red dashed line shows the Bonferroni-corrected P-value=2.2×10⁸ for Europeans.
Extended Data Fig. 3
Extended Data Fig. 3. Regional detail showing fine-mapping to identify two adjacent independent signals on chromosome 19.
Top two panels: variants in LD with the lead variants shown. The variants that are included in two independent credible sets are displayed with black outline circles. r2 values in the legend denote upper limits, 0.2=[0,0.2], 0.4=[0.2,0.4], 0.6=[0.4,0.6], 0.8=[0.6,0.8],1=[0.8,1]. Bottom panel: locations of protein-coding genes, coloured by TWAS P-value. The red dashed line shows the Bonferroni-corrected P-value=2.2×10⁸ for Europeans.
Extended Data Fig. 4
Extended Data Fig. 4. Regional detail showing fine-mapping to identify three adjacent independent signals on chromosome 21.
Top three panels: variants in LD with the lead variants shown. The variants that are included in three independent credible sets are displayed with black outline circles. r2 values in the legend denote upper limits, 0.2=[0,0.2], 0.4=[0.2,0.4], 0.6=[0.4,0.6], 0.8=[0.6,0.8],1=[0.8,1]. Bottom panel: locations of protein-coding genes, coloured by TWAS P-value. The red dashed line shows the Bonferroni-corrected P-value=2.2×10⁸ for Europeans.
Extended Data Fig. 5
Extended Data Fig. 5. Predicted structural consequences of lead variants at PLSCR1 and IFNA10.
(a) Crystal structure of PLSCR1 nuclear localization signal (orange, Gly257–Ile266, numbering correspond to UniProt entry O15162) in complex with Importin α (blue), Protein Data Bank (PDB) ID 1Y2A (ref. ). Side chains of PLSCR1 are shown as connected spheres with carbon atoms coloured in orange, nitrogens in blue and oxygens in red. Hydrogen atoms were not determined at this resolution (2.20) and are not shown. (b) Close-up view showing side chains of PLSCR1 Ser260, His262 and Importin Glu107 as sticks. Distance (in) between selected atoms (PLSCR1 His262 Nϵ2 and Importin Glu107 carboxyl O) is indicated. A hydrogen bond between PLSCR1 His262 and Importin Glu107 is indicated with a dashed line. The risk variant is predicted to eliminate this bond, disrupting nuclear import, an essential step for effect on antiviral signalling and neutrophil maturation. (c) Because there is very strong sequence conservation between IFNA10 and the gene encoding IFNω, we used existing crystal structure data (Protein Data Bank ID 3SE4 (ref. )) for IFNω (cyan) to display a ternary complex with interferon α/β receptor IFNAR1 (blue), IFNAR2 (red). The side chain of Trp164 is shown as spheres and indicated with a black line. (d) The hydrophobic core of IFNω with Trp164 shielded from the solvent in the center. Trp164-surrounding residues of IFNω are numbered and correspond to UniProt entry P05000. Trp164 and surrounding residues are conserved in IFNA10 (UniProt ID P01566) and share the same numbering as in IFNω (P05000). Side chains of four residues are shown as sticks. Carbon and nitrogen atoms coloured in cyan and blue, respectively. The critical COVID-19-associated mutation, Trp164Cys, would replace an evolutionarily conserved, bulky side chain in the hydrophobic core of IFNA10 with a smaller one, which may destabilize IFNA10.
Extended Data Fig. 6
Extended Data Fig. 6. Manhattan plot of HLA and GWAS signal across the extended MHC region for the EUR cohort.
Grey circles mark the GWAS (small variant) associations and diamonds represent the HLA each allele association, coloured by locus. The lead variant from the GWAS and lead allele from HLA are labelled. The left-panel shows the raw association −log10(P values) per variant - prior to conditional analysis. The right-panel shows the −log10(P values) per variant following conditioning on DRB1*04:01. The dashed red line shows the Bonferroni-corrected genome-wide significance threshold for Europeans.
Extended Data Fig. 7
Extended Data Fig. 7. Effect–effect plots for Mendelian randomization analyses to assess causal evidence for circulating proteins in critical COVID-19.
Each plot shows effect size (β) of variants associated with protein concentration (x axis) and critical COVID-19 (y axis). A full list of instruments is found in Supplementary Table 13.

References

    1. Pairo-Castineira E, et al. Genetic mechanisms of critical illness in COVID-19. Nature. 2021;591:92–98. doi: 10.1038/s41586-020-03065-y. - DOI - PubMed
    1. Ellinghaus D, et al. Genomewide association study of severe Covid-19 with respiratory failure. N. Engl. J. Med. 2020;383:1522–1534. doi: 10.1056/NEJMoa2020283. - DOI - PMC - PubMed
    1. COVID-19 Host Genetics Initiative Mapping the human genetic architecture of COVID-19. Nature. 2021;600:472–477. doi: 10.1038/s41586-021-03767-x. - DOI - PMC - PubMed
    1. Zhang Q, et al. Inborn errors of type I IFN immunity in patients with life-threatening COVID-19. Science. 2020;370:eabd4570. doi: 10.1126/science.abd4570. - DOI - PMC - PubMed
    1. Docherty AB, et al. Features of 20,133 UK patients in hospital with covid-19 using the ISARIC WHO Clinical Characterisation Protocol: prospective observational cohort study. BMJ. 2020;369:m1985. doi: 10.1136/bmj.m1985. - DOI - PMC - PubMed

MeSH terms

Substances