. 2022 Mar 7;54(1):19.
doi: 10.1186/s12711-022-00709-7.

The long-term effects of genomic selection: 1. Response to selection, additive genetic variance, and genetic architecture

Affiliations

The long-term effects of genomic selection: 1. Response to selection, additive genetic variance, and genetic architecture

Yvonne C J Wientjes et al. Genet Sel Evol. .

Abstract

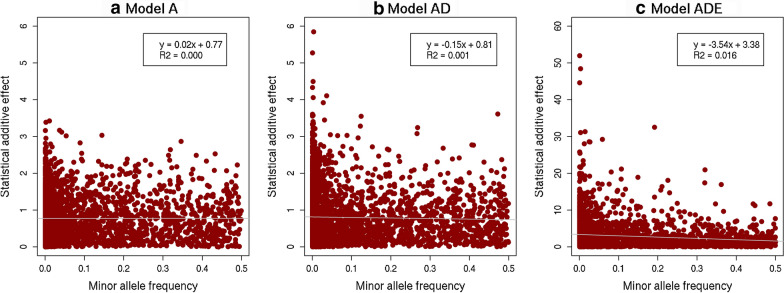
Background: Genomic selection has revolutionized genetic improvement in animals and plants, but little is known about its long-term effects. Here, we investigated the long-term effects of genomic selection on response to selection, genetic variance, and the genetic architecture of traits using stochastic simulations. We defined the genetic architecture as the set of causal loci underlying each trait, their allele frequencies, and their statistical additive effects. We simulated a livestock population under 50 generations of phenotypic, pedigree, or genomic selection for a single trait, controlled by either only additive, additive and dominance, or additive, dominance, and epistatic effects. The simulated epistasis was based on yeast data.

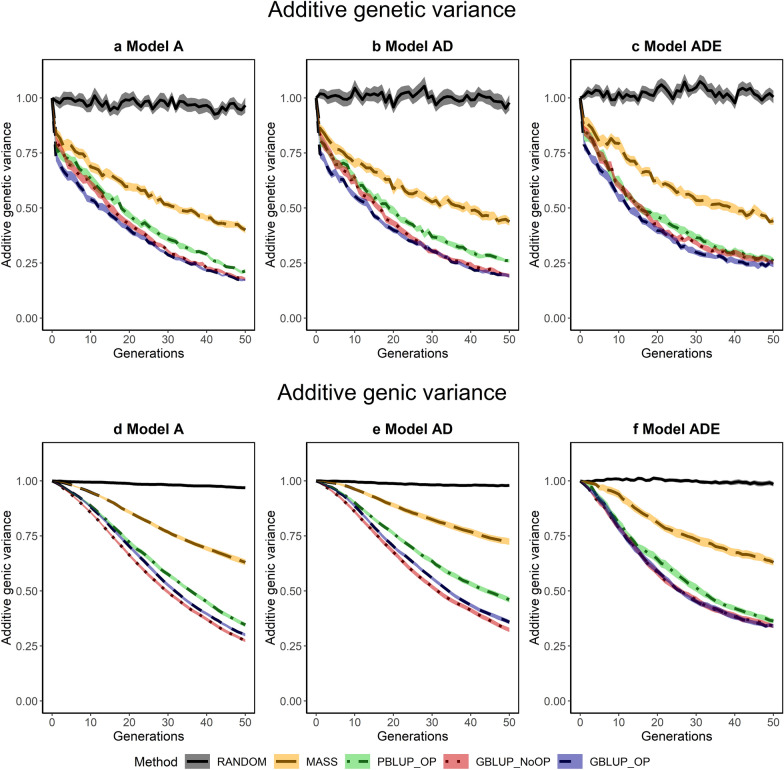
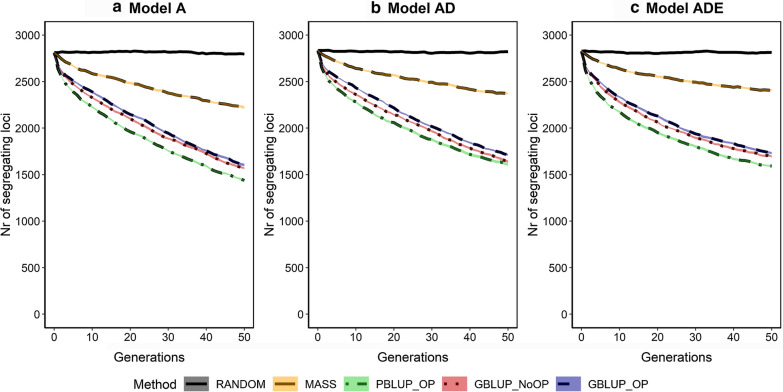
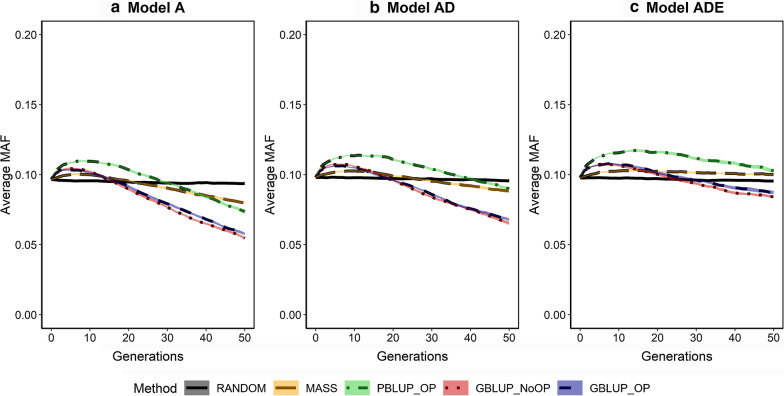
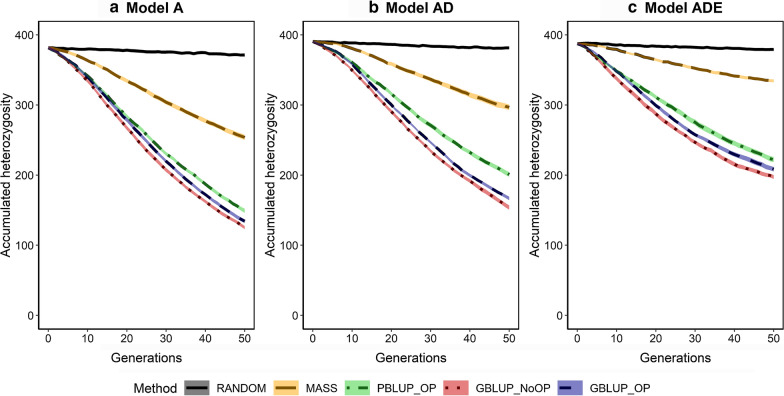
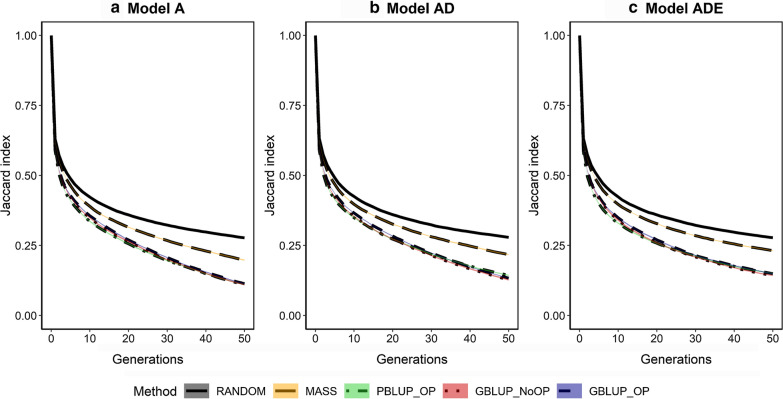
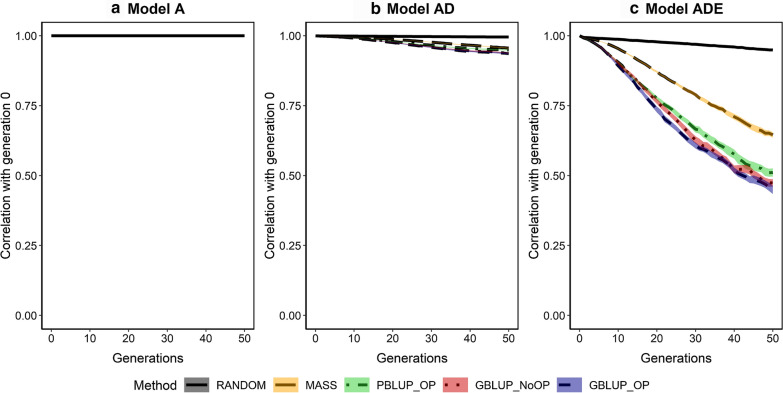
Results: Short-term response was always greatest with genomic selection, while response after 50 generations was greater with phenotypic selection than with genomic selection when epistasis was present, and was always greater than with pedigree selection. This was mainly because loss of genetic variance and of segregating loci was much greater with genomic and pedigree selection than with phenotypic selection. Compared to pedigree selection, selection response was always greater with genomic selection. Pedigree and genomic selection lost a similar amount of genetic variance after 50 generations of selection, but genomic selection maintained more segregating loci, which on average had lower minor allele frequencies than with pedigree selection. Based on this result, genomic selection is expected to better maintain genetic gain after 50 generations than pedigree selection. The amount of change in the genetic architecture of traits was considerable across generations and was similar for genomic and pedigree selection, but slightly less for phenotypic selection. Presence of epistasis resulted in smaller changes in allele frequencies and less fixation of causal loci, but resulted in substantial changes in statistical additive effects across generations.

Conclusions: Our results show that genomic selection outperforms pedigree selection in terms of long-term genetic gain, but results in a similar reduction of genetic variance. The genetic architecture of traits changed considerably across generations, especially under selection and when non-additive effects were present. In conclusion, non-additive effects had a substantial impact on the accuracy of selection and long-term response to selection, especially when selection was accurate.


Conflict of interest statement

The authors declare that they have no competing interests.

Figures

Fig. 1
Fig. 1
Histogram of the number of interactions per causal locus
Fig. 2
Fig. 2
Accuracy of selection across generations for four selection methods and three genetic models. The four selection methods were: MASS selection, PBLUP selection with own performance (PBLUP_OP), GBLUP selection without own performance (GBLUP_NoOP) or with own performance (GBLUP_OP). The three genetic models were a model with only additive effects (A), with additive and dominance effects (AD), or with additive, dominance and epistatic effects (ADE). Results are shown as averages of 20 replicates and the width of the lines represents the average plus and minus one standard error
Fig. 3
Fig. 3
Phenotypic trends for the five selection methods and three genetic models. The phenotypic trend is scaled by the additive genetic standard deviation in the generation before selection in order to make the results comparable across the genetic models. The five selection methods were: RANDOM selection, MASS selection, PBLUP selection with own performance (PBLUP_OP), GBLUP selection without own performance (GBLUP_NoOP) or with own performance (GBLUP_OP). The three genetic models were a model with only additive effects (A), with additive and dominance effects (AD), or with additive, dominance and epistatic effects (ADE). Results are shown as averages of 20 replicates and the width of the lines represents the average plus and minus one standard error
Fig. 4
Fig. 4
Additive genetic (ac) and additive genic (df) variances across generations for the five selection methods and three genetic models. The trend is scaled by the additive genetic or additive genic variance in the generation before selection in order to make the results comparable across the genetic models. The five selection methods were: RANDOM selection, MASS selection, PBLUP selection with own performance (PBLUP_OP), GBLUP selection without own performance (GBLUP_NoOP) or with own performance (GBLUP_OP). The three genetic models were a model with only additive effects (A), with additive and dominance effects (AD), or with additive, dominance and epistatic effects (ADE). Results are shown as averages of 20 replicates and the width of the lines represents the average plus and minus one standard error
Fig. 5
Fig. 5
Numbers of segregating causal loci across generations for the five selection methods and three genetic models. The five selection methods were: RANDOM selection, MASS selection, PBLUP selection with own performance (PBLUP_OP), GBLUP selection without own performance (GBLUP_NoOP) or with own performance (GBLUP_OP). The three genetic models were a model with only additive effects (A), with additive and dominance effects (AD), or with additive, dominance and epistatic effects (ADE). Results are shown as averages of 20 replicates and the width of the lines represents the average plus and minus one standard error
Fig. 6
Fig. 6
Average minor allele frequencies (MAF) of segregating causal loci across generations for the five selection methods and three genetic models. The five selection methods were: RANDOM selection, MASS selection, PBLUP selection with own performance (PBLUP_OP), GBLUP selection without own performance (GBLUP_NoOP) or with own performance (GBLUP_OP). The three genetic models were a model with only additive effects (A), with additive and dominance effects (AD), or with additive, dominance and epistatic effects (ADE). Results are shown as averages of 20 replicates and the width of the lines represents the average plus and minus one standard error
Fig. 7
Fig. 7
Average accumulated heterozygosity for segregating causal loci across generations for the five selection methods and three genetic models. The five selection methods were: RANDOM selection, MASS selection, PBLUP selection with own performance (PBLUP_OP), GBLUP selection without own performance (GBLUP_NoOP) or with own performance (GBLUP_OP). The three genetic models were a model with only additive effects (A), with additive and dominance effects (AD), or with additive, dominance and epistatic effects (ADE). Results are shown as averages of 20 replicates and the width of the lines represents the average plus and minus one standard error
Fig. 8
Fig. 8
Change in the subset of segregating causal loci across generations for the five selection methods and three genetic models. The change in the subset of segregating causal loci is described by the Jaccard index. The five selection methods were: RANDOM selection, MASS selection, PBLUP selection with own performance (PBLUP_OP), GBLUP selection without own performance (GBLUP_NoOP) or with own performance (GBLUP_OP). The three genetic models were a model with only additive effects (A), with additive and dominance effects (AD), or with additive, dominance and epistatic effects (ADE). Results are shown as averages of 20 replicates and the width of the lines represents the average plus and minus one standard error
Fig. 9
Fig. 9
Change in the allele frequencies of segregating causal loci across generations for the five selection methods and three genetic models. The change in allele frequencies is represented by the correlation in allele frequencies between the generation of interest and the generation before selection (generation 0). The five selection methods were: RANDOM selection, MASS selection, PBLUP selection with own performance (PBLUP_OP), GBLUP selection without own performance (GBLUP_NoOP) or with own performance (GBLUP_OP). The three genetic models were a model with only additive effects (A), with additive and dominance effects (AD), or with additive, dominance and epistatic effects (ADE). Results are shown as averages of 20 replicates and the width of the lines represents the average plus and minus one standard error
Fig. 10
Fig. 10
Change in the statistical additive effects of segregating causal loci across generations for the five selection methods and three genetic models. The change in statistical additive effects is represented by the correlation in the effects between the generation of interest and the generation before selection (generation 0). The five selection methods were: RANDOM selection, MASS selection, PBLUP selection with own performance (PBLUP_OP), GBLUP selection without own performance (GBLUP_NoOP) or with own performance (GBLUP_OP). The three genetic models were a model with only additive effects (A), with additive and dominance effects (AD), or with additive, dominance and epistatic effects (ADE). Results are shown as averages of 20 replicates and the width of the lines represents the average plus and minus one standard error
Fig. 11
Fig. 11
Correlation between the absolute statistical additive effect and the minor allele frequency at causal loci for the three genetic models. The three genetic models were a model with only additive effects (A), with additive and dominance effects (AD), or with additive, dominance and epistatic effects (ADE)

Similar articles

Cited by

References

    1. Hill WG. Is continued genetic improvement of livestock sustainable? Genetics. 2016;202:877–881. - PMC - PubMed
    1. Hill WG, Kirkpatrick M. What animal breeding has taught us about evolution. Annu Rev Ecol Evol Syst. 2010;41:1–19.
    1. Havenstein GB, Ferket PR, Qureshi MA. Growth, livability, and feed conversion of 1957 versus 2001 broilers when fed representative 1957 and 2001 broiler diets. Poult Sci. 2003;82:1500–1508. - PubMed
    1. Dudley JW, Lambert RJ. 100 generations of selection for oil and protein in corn. Plant Breed Rev. 2003;24:79–110.
    1. Havenstein GB, Ferket PR, Qureshi MA. Carcass composition and yield of 1957 versus 2001 broilers when fed representative 1957 and 2001 broiler diets. Poult Sci. 2003;82:1509–1518. - PubMed

LinkOut - more resources