. 2022 Mar 7;29(1):17.
doi: 10.1186/s12929-022-00800-7.

Cyanidin 3-O-arabinoside suppresses DHT-induced dermal papilla cell senescence by modulating p38-dependent ER-mitochondria contacts

Affiliations

Cyanidin 3-O-arabinoside suppresses DHT-induced dermal papilla cell senescence by modulating p38-dependent ER-mitochondria contacts

Young Hyun Jung et al. J Biomed Sci. .

Abstract

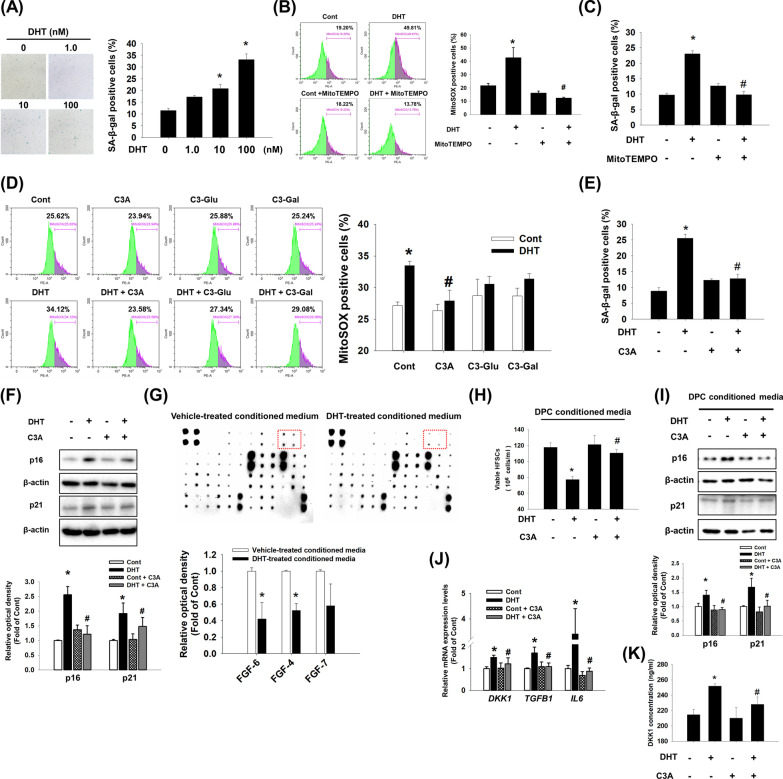
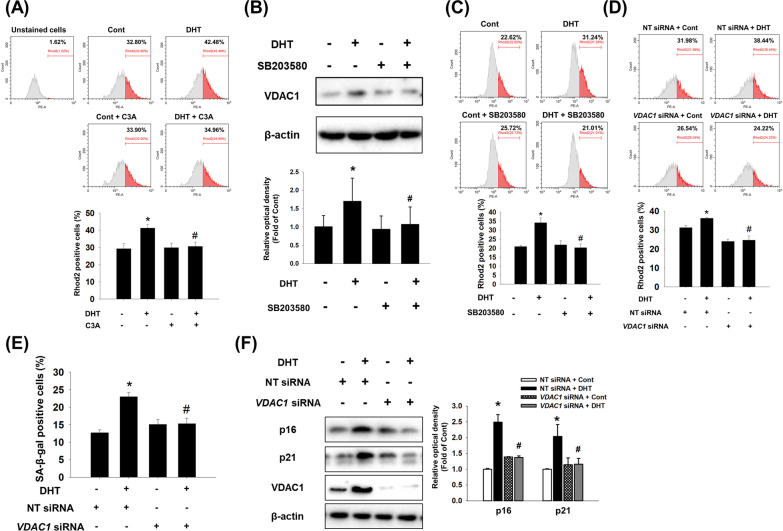
Background: Androgenetic alopecia (AGA) is a genetic disorder caused by dihydrotestosterone (DHT), accompanied by the senescence of androgen-sensitive dermal papilla cells (DPCs) located in the base of hair follicles. DHT causes DPC senescence in AGA through mitochondrial dysfunction. However, the mechanism of this pathogenesis remains unknown. In this study, we investigated the protective role of cyanidins on DHT-induced mitochondrial dysfunction and DPC senescence and the regulatory mechanism involved.

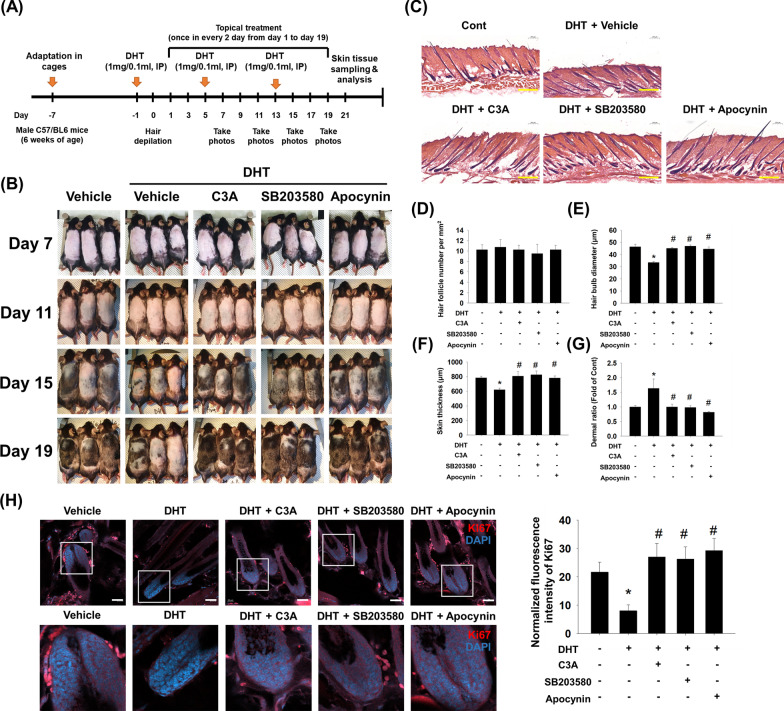
Methods: DPCs were used to investigate the effect of DHT on mitochondrial dysfunction with MitoSOX and Rhod-2 staining. Senescence-associated β-galactosidase activity assay was performed to examine the involvement of membrane AR-mediated signaling in DHT-induced DPC senescence. AGA mice model was used to study the cyanidins on DHT-induced hair growth deceleration.

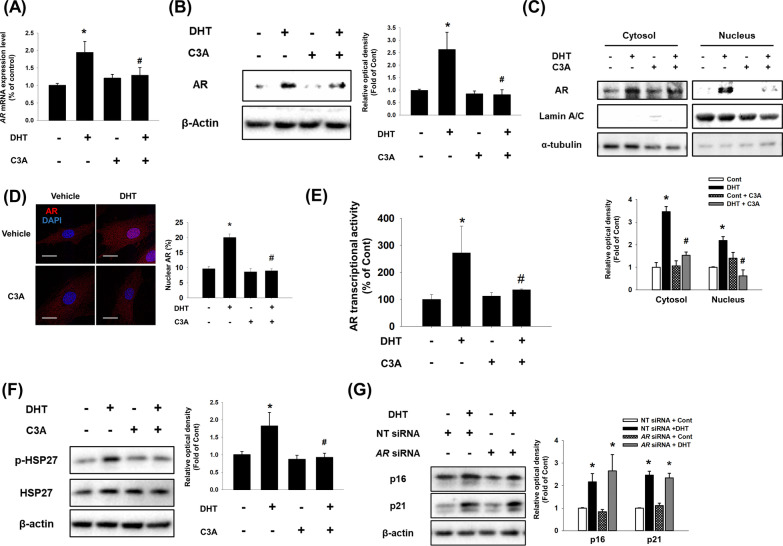
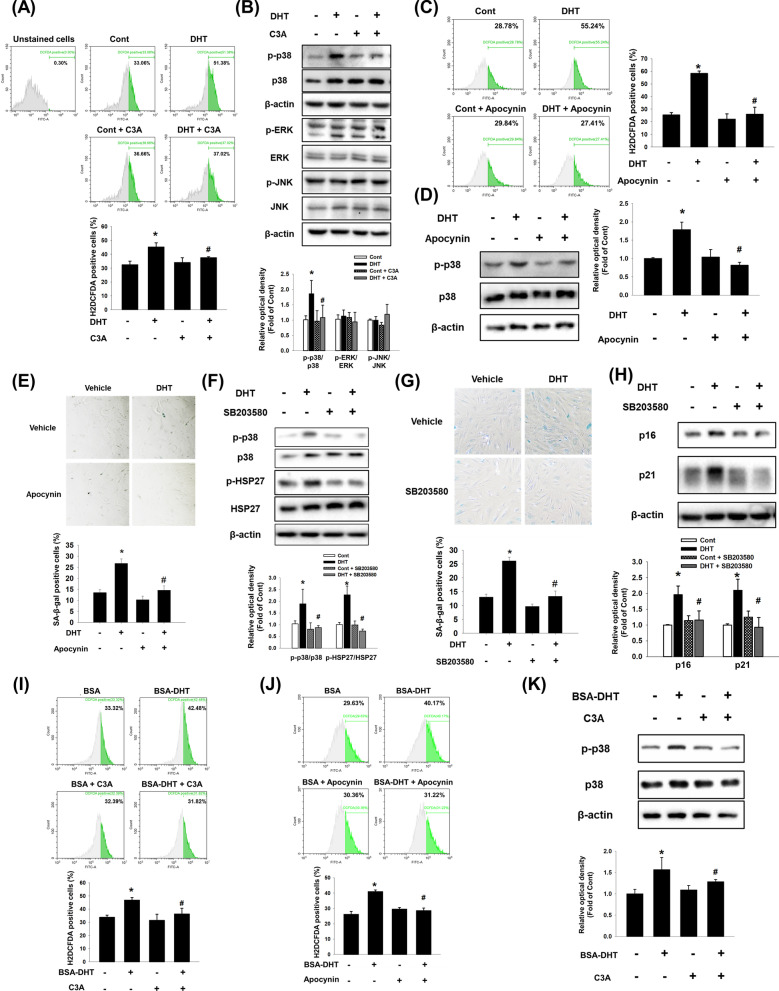
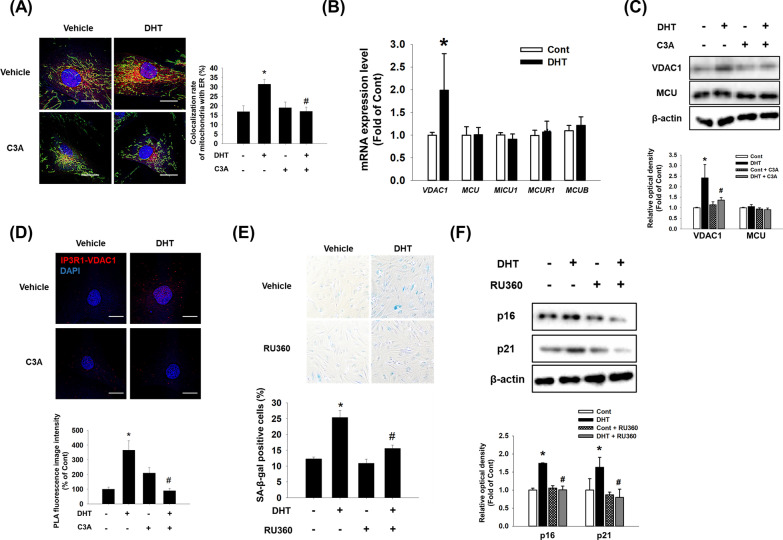
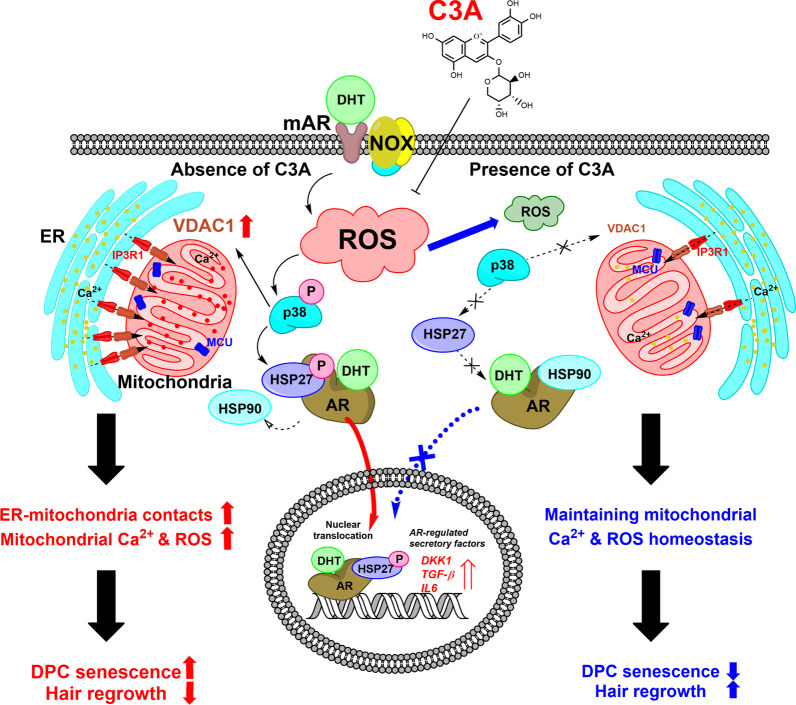
Results: Cyanidin 3-O-arabinoside (C3A) effectively decreased DHT-induced mtROS accumulation in DPCs, and C3A reversed the DHT-induced DPC senescence. Excessive mitochondrial calcium accumulation was blocked by C3A. C3A inhibited p38-mediated voltage-dependent anion channel 1 (VDAC1) expression that contributes to mitochondria-associated ER membrane (MAM) formation and transfer of calcium via VDAC1-IP3R1 interactions. DHT-induced MAM formation resulted in increase of DPC senescence. In AGA mice models, C3A restored DHT-induced hair growth deceleration, which activated hair follicle stem cell proliferation.

Conclusions: C3A is a promising natural compound for AGA treatments against DHT-induced DPC senescence through reduction of MAM formation and mitochondrial dysfunction.

Keywords: Androgen receptor; Cyanidin 3-O-arabinoside; DHT; Mitochondrial calcium; Senescence.


Conflict of interest statement

The authors declare no competing interests.

Figures

Fig. 1
Fig. 1
Effect of C3A on DHT-induced DPC senescence. A Dermal papilla cells (DPC) were treated with dihydrotestosterone (DHT) (0 to 100 nM) for 72 h. Senescent cells were determined by senescence associated β-galactosidase activity (SA-β-gal) assay. The positive cells (blue) were counted in five random fields manually. Proportional number of positive cells was presented by the percentage of cells of each treat group. N = 5. B Cells were pretreated with MitoTEMPO (1 μM) for 30 min and treated with DHT (100 nM) for 48 h. Cells were stained with MitoSOX and analyzed by flow cytometer. N = 4. C Cells were pretreated with MitoTEMPO (1 μM) for 30 min and treated with DHT (100 nM) for 72 h. Senescent cells were detected with SA-β-gal assay. N = 5. D Cells were pretreated with cyanidin 3-O-arabinoside (C3A) (1 μM), cyanidin-3-O-glucoside (C3-glu, 1 μM), and cyanidin-3-O-galactoside (C3-gal, 1 μM) for 30 min and treated with DHT for 48 h. Cells were stained with MitoSOX and analyzed by flow cytometer. N = 4. E Cells were pretreated with C3A for 30 min and exposed to DHT for 72 h. SA-β-gal assay was performed. N = 5. F Cells were pretreated with C3A for 30 min and treated DHT for 72 h. The protein expression levels of p16 and p21 were analyzed by western blot analysis. β-actin was used as a loading control. N = 4. G DPCs were treated with vehicle or DHT for 72 h. DPC conditioned media was used for growth factor antibody array. The results were captured by chemiluminescence imaging system and quantified by relative optical densities of spots. FGF-6, FGF-4, and FGF-7 expression levels were compared with control. N = 3. H, I DPC conditioned media were obtained from the culture media of DPCs pretreated with C3A and treated with DHT for 72 h. Human hair follicle stem cells (HFSCs) were treated with DPC conditioned media for 48 h. H Viable cells were counted with trypan blue exclusion assay. N = 6. Data are shown by cell numbers in 1 ml. I Protein expression levels of p16 and p21 were evaluated by western blot analysis. N = 4. J DPCs were treated with C3A for 30 min prior to DHT exposure for 24 h. The mRNA expression levels of DKK1, TGFB1, and IL6 analyzed by using qPCR. N = 5. K DKK-1 concentration in the DPC conditioned media by using DKK-1 ELISA kit. DPC conditioned media was taken from the culture media of DPCs pretreated with C3A and treated with DHT for 72 h. N = 5. Data are mean ± SEM. *p < 0.05 versus Control. #p < 0.05 versus DHT
Fig. 2
Fig. 2
Effect of C3A on DHT-induced nuclear translocation of AR. AF DPCs were treated with C3A for 30 min prior to DHT for 24 h. A The relative mRNA expression level of AR was analyzed by real time PCR. Normalization was achieved by ACTB mRNA expression level (B) AR protein expression level was detected by western blot analysis. N = 3. C Nuclear and cytosolic proteins were separated by intracellular fractionation. Protein expression level of AR was detected. Lamin A/C was used as a nuclear marker, and α-tubulin was used as a cytosol marker. N = 3. D Cells were immunostained with anti-AR antibody (red). Nucleus is counterstained with DAPI (blue). N = 3. Magnification ×1000. Scale bars are 8 μm. E AR transcriptional activity was analyzed by Cignal reporter assay. N = 5. F Phosphorylated HSP27 and HSP27 protein expression levels were analyzed by western blotting. N = 3. G Cells were transfected with non-targeting (NT) siRNA (25 nM) and AR siRNA (25 nM) and treated with DHT for 72 h. Western blotting analysis was performed for p16 and p21 proteins. β-actin was used as a loading control. N = 3. Data are mean ± SEM. *p < 0.05 versus Control. #p < 0.05 versus DHT
Fig. 3
Fig. 3
Effect of C3A on DHT-induced p38 phosphorylation. A, B DPCs were treated with C3A for 30 min and treated with DHT for 2 h. A Cells were stained with H2DCFDA (1 μM) and analyzed with flow cytometer. N = 3. B The levels of p-p38, p-ERK, and p-JNK were determined by western blot analysis. Data are normalized by each anti-p38, -ERK and -JNK antibodies. N = 3. C, D Cells were treated with Apocynin (100 μM) for 30 min and exposed to DHT for 2 h. C Cells were stained with H2DCFDA and analyzed by flow cytometer. N = 3. D Phosphorylated p38 expression level was analyzed by western blot analysis. N = 4. E Cells were treated with Apocynin for 30 min and exposed to DHT for 72 h. SA-β-gal activity assay was performed, and blue stained cells of total cells were counted. N = 5. F Cells were treated with SB203580 (1 μM) for 30 min and exposed to DHT for 24 h. Phosphorylated p38 and HSP27 expression levels were analyzed by western blot analysis. N = 3. G, H Cells were treated with SB203580 (1 μM) for 30 min and exposed to DHT for 72 h. G SA-β-gal activity assay was performed, and blue stained cells of total cells were counted. N = 5. H Western blotting was achieved for analyzing p16 and p21 protein expression levels. N = 3. I Cells were treated with C3A for 30 min and exposed to BSA conjugated DHT for 2 h. Cells were stained with H2DCFDA (1 μM) and H2DCFDA-positive cells were analyzed by flow cytometer. N = 6. J Cells were treated with Apocynin for 30 min and exposed to BSA conjugated DHT for 2 h and stained with H2DCFDA (1 μM). H2DCFDA-positive cells were analyzed by flow cytometer. N = 3. K Phosphorylated p38 expression level was analyzed by western blot. N = 4. Data are mean ± SEM. *p < 0.05 versus Control. #p < 0.05 versus DHT or BSA-DHT
Fig. 4
Fig. 4
Effect of C3A on DHT-induced ER-mitochondria contacts. A DPCs were treated with C3A and exposed to DHT for 24 h. Cells were visualized by staining with ER-Tracker (200 nM) and Mito-Tracker (200 nM). Colocalization of ER-Tracker and Mito-Tracker was analyzed by Image J software. N = 5. Magnification ×1000. Scale bars are 8 μm. B Cells were treated with DHT for 24 h. The mRNA expression levels of VDAC1, MCU1, MICU1, MCUR1, and MCUB were quantified by qPCR analysis. N = 5. C Cells were treated with C3A for 30 min and exposed to DHT for 24 h. Protein expression levels of MCU1 and VDAC1 were analyzed by western blotting. N = 4. D Interaction between VDAC1 and IP3R1 (VDAC1–IP3R1, red) in DPC cells was assessed by PLA assay. N = 4. Magnification ×1000. Scale bars are 8 μm. E, F Cells were pretreated with RU360 (1 μM) for 30 min and exposed to DHT for 72 h. E SA-β-gal activity assay was performed, and blue stained cells of total cells were counted. N = 5. F Protein expression levels of p16 and p21 were quantified by western blot analysis. N = 4. *p < 0.05 versus Control. #p < 0.05 versus DHT
Fig. 5
Fig. 5
Effect of C3A on DHT-induced mitochondrial calcium accumulation. A DPCs were treated with C3A for 30 min and exposed to DHT for 48 h. Cells were stained with Rhod-2 (2 μM) and positive cells were analyzed with flow cytometer. N = 6. B Cells were pretreated with SB203580 (1 μM) for 30 min and exposed to DHT for 24 h. VDAC1 expression level was analyzed by western blotting. C Cells were pretreated with SB203580 for 30 min and exposed to DHT for 48 h. Flow cytometric analysis was performed with Rhod-2 (2 μM) staining and phycoerythrin (PE)-positive cells were quantified. D Cells were transfected with NT siRNA (25 nM) and VDAC1 siRNA (25 nM) and exposed to DHT for 48 h. Flow cytometric analysis was achieved with Rhod-2 staining and PE-positive cells were quantified. N = 4. E, F Silencing with VDAC1 siRNA (25 nM) or NT siRNA (25 nM) was done and the cells were exposed to DHT for 72 h. E SA-β-gal activity assay was performed, and blue stained cells of total cells were counted. N = 5. F Protein expression levels of p16, p21 and VDAC1 were quantified by western blot analysis. N = 4. *p < 0.05 versus Control. #p < 0.05 versus DHT or NT siRNA + DHT
Fig. 6
Fig. 6
Effect of C3A on hair growth cycles in an AGA mice model. A Animal experimental schedule for inducing androgenetic alopecia mice model. DHT (1 mg/100 μl) was intraperitoneally injected and C3A (500 μM), SB203580 (1 mM), and Apocynin (100 mM) was topically administered once every 2 days. B Photographs were taken on days 7, 11, 15 and 19 after depilation. C Depilated mice skin tissue was frozen sectioned and histologic examination was performed by HE staining. Images were captured by digital slide scanner. N = 6. Scale bars are 400 μm. D Hair follicle number was counted in the same random area (1 mm2). E Hair bulb diameter was measured. F Skin thickness was assessed. G Dermal ratio was rated by measuring epidermis and dermis length of skin tissue section. H Immunofluorescence staining of Ki67 in the dorsal skin was performed with anti-Ki67 antibody and DAPI for nuclei staining. Magnification × 200. Scale bars are 40 μm. *p < 0.05 versus Control. #p < 0.05 versus DHT + Vehicle
Fig. 7
Fig. 7
Schematic model of effect of C3A on DHT-induced mitochondrial calcium influx and DPC senescence. C3A effectively decreased DHT-induced mtROS accumulation and DPC senescence. HSP27 phosphorylation was modulated by p38-mediated signaling and it was involved in AR nuclear translocation. In turn, HSP27 phosphorylation is modulated by membrane AR-mediated signaling, which was inhibited by C3A. Remarkably, C3A inhibited p38-mediated VDAC1 expression that contributes to MAM formation and transfer of calcium via VDAC1–IP3R1 interactions. Finally, excessive mitochondrial calcium entry through MAM formation resulted in increase of DPC senescence, but C3A reduced the mitochondrial calcium influx under DHT exposure conditions

References

    1. Kaufman KD. Androgens and alopecia. Mol Cell Endocrinol. 2002;198(1–2):89–95. - PubMed
    1. Premanand A, Reena RB. Androgen modulation of Wnt/β-catenin signaling in androgenetic alopecia. Arch Dermatol Res. 2018;310(5):391–399. - PubMed
    1. Kwack MH, Sung YK, Chung EJ, Im SU, Ahn JS, Kim MK, et al. Dihydrotestosterone-inducible dickkopf 1 from balding dermal papilla cells causes apoptosis in follicular keratinocytes. J Invest Dermatol. 2008;128(2):262–269. - PubMed
    1. Huang WY, Huang YC, Huang KS, Chan CC, Chiu HY, Tsai RY, et al. Stress-induced premature senescence of dermal papilla cells compromises hair follicle epithelial-mesenchymal interaction. J Dermatol Sci. 2017;86(2):114–122. - PubMed
    1. Bahta AW, Farjo N, Farjo B, Philpott MP. Premature senescence of balding dermal papilla cells in vitro is associated with p16(INK4a) expression. J Invest Dermatol. 2008;128(5):1088–1094. - PubMed