. 2022 Mar 7;23(1):74.
doi: 10.1186/s13059-022-02630-0.

StrainGE: a toolkit to track and characterize low-abundance strains in complex microbial communities

Affiliations

StrainGE: a toolkit to track and characterize low-abundance strains in complex microbial communities

Lucas R van Dijk et al. Genome Biol. .

Abstract

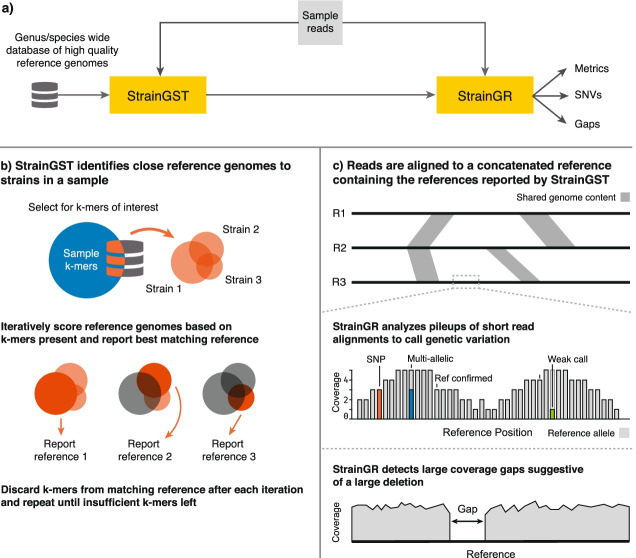
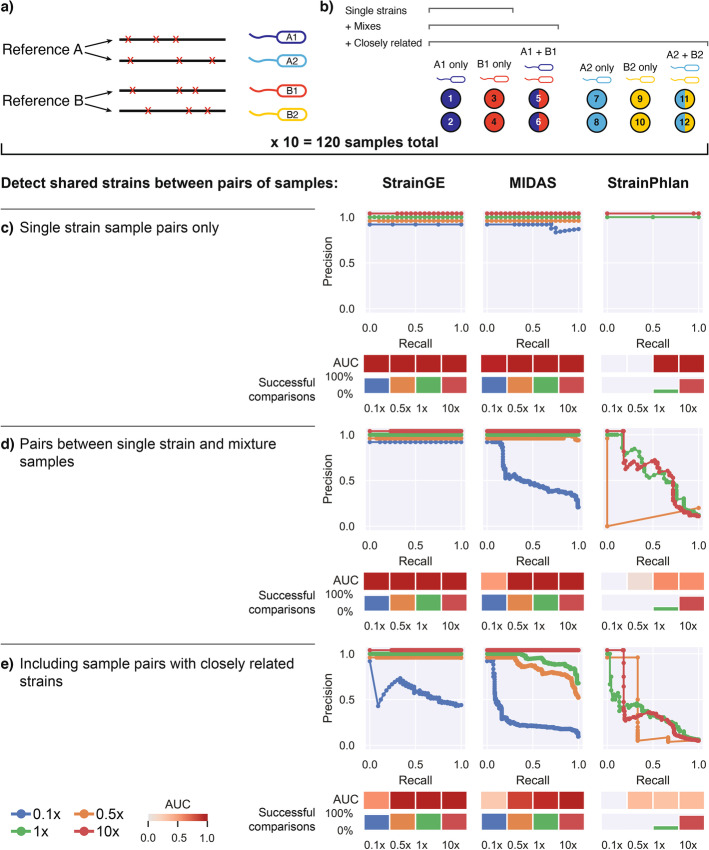
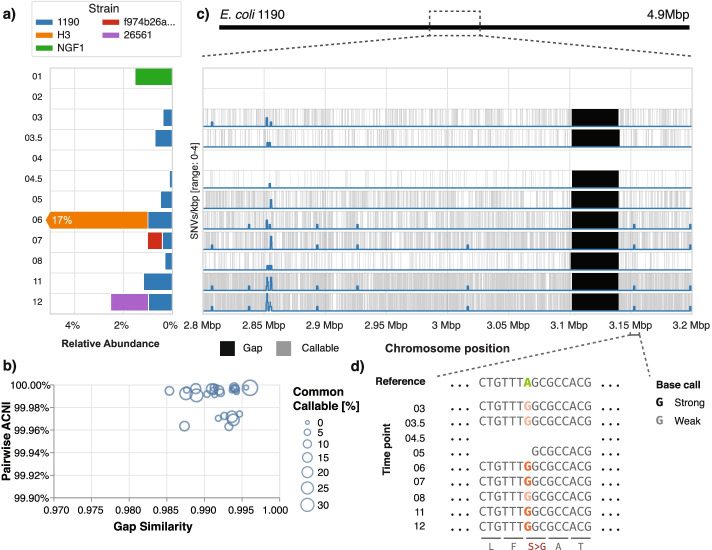
Human-associated microbial communities comprise not only complex mixtures of bacterial species, but also mixtures of conspecific strains, the implications of which are mostly unknown since strain level dynamics are underexplored due to the difficulties of studying them. We introduce the Strain Genome Explorer (StrainGE) toolkit, which deconvolves strain mixtures and characterizes component strains at the nucleotide level from short-read metagenomic sequencing with higher sensitivity and resolution than other tools. StrainGE is able to identify strains at 0.1x coverage and detect variants for multiple conspecific strains within a sample from coverages as low as 0.5x.

Keywords: Metagenomics; Microbiome; Strain-tracking.


Conflict of interest statement

BJW is an employee of Applied Invention (Cambridge, MA). No other authors declare competing interests.

Figures

Fig. 1
Fig. 1
StrainGE is a toolkit to track, characterize and compare low-abundance strains in metagenomic samples. a Overview of StrainGE pipeline. StrainGST uses a database of high quality reference genomes to select those most similar to strains present in a metagenomic sample. StrainGR further characterizes SNVs and gaps that differ between references selected by StrainGST and the actual strain present in the sample. b At each iteration, StrainGST scores each reference strain by comparing the k-mer profile of the reference to the sample k-mers, reporting the reference closest to the highest abundant strain in the sample. The k-mers in the reported reference are removed from the sample and the process is repeated to search for lower-abundance strains, until there are insufficient k-mers. c StrainGR uses a short read alignment-based approach to characterize variation (SNVs and gaps) between the reference(s) identified by StrainGST and the metagenomic sample. Regions shared between the concatenated genomes (gray shaded areas) are detected and excluded from variant calling. Alleles are classified as “strong” or “weak.” After applying rigorous QC metrics, positions in the reference are classified as (i) “reference confirmed” (light gray; a single strong reference allele), (ii) “SNV” (red; a single strong alternative allele), or (iii) “multi-allelic” (blue; multiple strong alleles present, e.g. the blue allele together with the reference allele in gray). The position with a strong reference allele and a weak alternative allele (green; an allele with only limited support in the reads) is classified as “reference confirmed” because only the reference allele is considered strong at that position. The “callable” genome is defined as all positions within the reference with at least one strong allele call
Fig. 2
Fig. 2
StrainGR discriminates between highly similar strains and reports ACNI which strongly correlates with true ANI. a For all synthetic sample pairs with the same StrainGST reference called, the Jaccard gap similarity index and pairwise ACNI are plotted. Circle size indicates the percentage of the reference genome that was callable across both strains being compared. Red circles indicate comparisons between identical strains. b For all pairs, the true ANI between spiked isolates is plotted against the ACNI, as estimated by StrainGR. The dashed line indicates parity between these metrics. Pairs of strains could have 0–10,000 SNV differences
Fig. 3
Fig. 3
StrainGE is the only tool that can detect strain sharing at coverages as low as 0.5x. a Depiction of how synthetic Escherichia genomes were generated from randomly selected NCBI RefSeq genomes to create sets of closely related strains (e.g., A1/A2 and B1/B2) for spike in experiments. b Depiction of how spiked metagenomes were created using synthetic genomes from a. Each circle represents a spiked metagenome. The color of the circle indicates which synthetic strain was included: single color circles indicate spiked metagenomes containing a single synthetic strain, and two color circles indicate spiked metagenomes containing two synthetic strains mixed at equal proportions. ce Precision-recall curves for each tool and coverage 0.1x–10x, when given the task to detect which sample pairs contain identical strains. The area under the curve (AUC) is depicted as a heatmap below. The “successful comparisons” bar plot indicates the percentage of sample pairs for which a comparison was possible (i.e., tools ran to completion for both samples). c Limiting to single-strain samples from distinct references. d Including samples with two strains, but limited to strains from distinct references. e Including samples with closely related strains
Fig. 4
Fig. 4
StrainGE identified previously undetected low-abundance strains in longitudinal samples from an individual with Crohn’s disease. a Stacked barplot showing the relative abundances of StrainGST calls for each of 27 longitudinal stool metagenomes from Fang et al [25]. Circles indicate the strain detected in Fang et al., colored by its StrainGST counterpart and labeled using the ST designations (ST1-ST7) assigned by Fang et al. Small gray circles indicate samples where no strain was predicted in Fang et al.; these are labeled with “n.d.” b Single-copy core phylogeny of the 14 StrainGST reference genomes with close matches to strains across samples. Colors are based on the reference’s clade; see column “Clade”. “Collapsed” column indicates which reference was selected as a representative for subsequent StrainGR analysis, when two or more references shared more than ~ 99.2% ANI. c For all sample pairs matching the same collapsed reference, the Jaccard gap similarity index and pairwise ACNI are plotted. Circles indicate comparisons where the predicted reference was the same before collapsing, and diamonds indicate cases where the predicted reference before collapsing was different. Sizes of shapes indicate the percentage of the reference genome that was callable across both strains being compared. Filled in shapes indicate whether this strain instance was undetected by MIDAS. Dark green circles are labeled with the time points compared. d Zoomed in view of the upper right corner of c)
Fig. 5
Fig. 5
StrainGE detected a long-term, persistent strain of E. coli in a woman with rUTI. a Relative abundances predicted by StrainGE are shown for all E. coli strains detected. b For all sample pairs containing a strain matching to E. coli 1190, plot shows pairwise ACNI and gap similarity scores. Size of the circle indicates the percentage of the common callable genome. c Zoom in on a region of the chromosome of E. coli 1190. Gray shaded areas indicate “callable” regions, where StrainGR had enough read data to make a strong allele call. Predicted gaps are shaded black. The blue line represents the number of SNVs per 1,000 bp, observed in at least 3 samples. d Further zoom-in representing a region where StrainGR identified a nonsynonymous SNV that was consistently detected across all 1190-like strains
Fig. 6
Fig. 6
StrainGE recapitulates strain-diversity among bacterial isolates using metagenomic data only. a Single-copy core phylogenetic tree of E. faecalis isolates from the UK Baby Biome Study (UK BBS) (n = 282) in the context of isolates from other public UK hospitals (n = 168), human gut microbiota (n = 28), or other environmental sources (n = 27). Five major lineages were identified, represented by ST16, ST179, ST30, ST191, and ST40. Tree republished with permission from Shao et al. [27]. b Scatterplot relating ANI between isolates (x-axis) to StrainGE’s computed ACNI between metagenomes from which the isolates were derived (y-axis). c Barplot showing StrainGST predicted references and their relative abundances (y-axis) for strains present in metagenomic samples from a mother and her child taken over several days (x-axis). Strains matching the same reference are shown in the same color. Lines connecting bars are labeled with StrainGR computed ACNI. d For all pairs of samples with a strain close to either E. faecium DMEA02 (yellow) or E. faecalis SF28073 (blue), ACNI (y-axis) and gap similarity are plotted (x-axis). Circles with a black border represent pairs of samples from the same subject (or its mother). Size of the circle represents the percentage of common callable genome

References

    1. Touchon M, Perrin A, de Sousa JAM, Vangchhia B, Burn S, O’Brien CL, et al. Phylogenetic background and habitat drive the genetic diversification of Escherichia coli. PLoS Genet. 2020;16(6):e1008866. doi: 10.1371/journal.pgen.1008866. - DOI - PMC - PubMed
    1. Pleguezuelos-Manzano C, Puschhof J, Rosendahl Huber A, van Hoeck A, Wood HM, Nomburg J, et al. Mutational signature in colorectal cancer caused by genotoxic pks + E. coli. Nature. 2020;580(7802):269–273. doi: 10.1038/s41586-020-2080-8. - DOI - PMC - PubMed
    1. Leimbach A, Hacker J, Dobrindt U. E. coli as an All-Rounder: the thin line between commensalism and pathogenicity. In: Dobrindt U, Hacker JH, Svanborg C, editors. Between pathogenicity and commensalism. Berlin, Heidelberg: Springer; 2013. pp. 3–32. - PubMed
    1. Schreiber HL, Conover MS, Chou W-C, Hibbing ME, Manson AL, Dodson KW, et al. Bacterial virulence phenotypes of Escherichia coli and host susceptibility determine risk for urinary tract infections. Sci Transl Med. 2017;9(382):eaaf1283. doi: 10.1126/scitranslmed.aaf1283. - DOI - PMC - PubMed
    1. Human Microbiome Project Consortium Structure, function and diversity of the healthy human microbiome. Nature. 2012;486(7402):207–214. doi: 10.1038/nature11234. - DOI - PMC - PubMed

Publication types