. 2022 Mar 7;5(6):e202101226.
doi: 10.26508/lsa.202101226. Print 2022 Jun.

LRR-protein RNH1 dampens the inflammasome activation and is associated with COVID-19 severity

Affiliations

LRR-protein RNH1 dampens the inflammasome activation and is associated with COVID-19 severity

Giuseppe Bombaci et al. Life Sci Alliance. .

Abstract

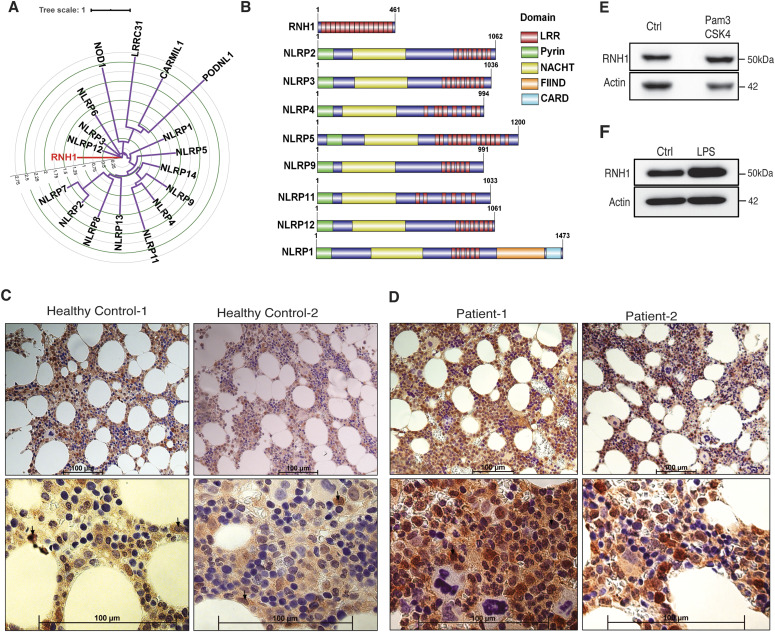
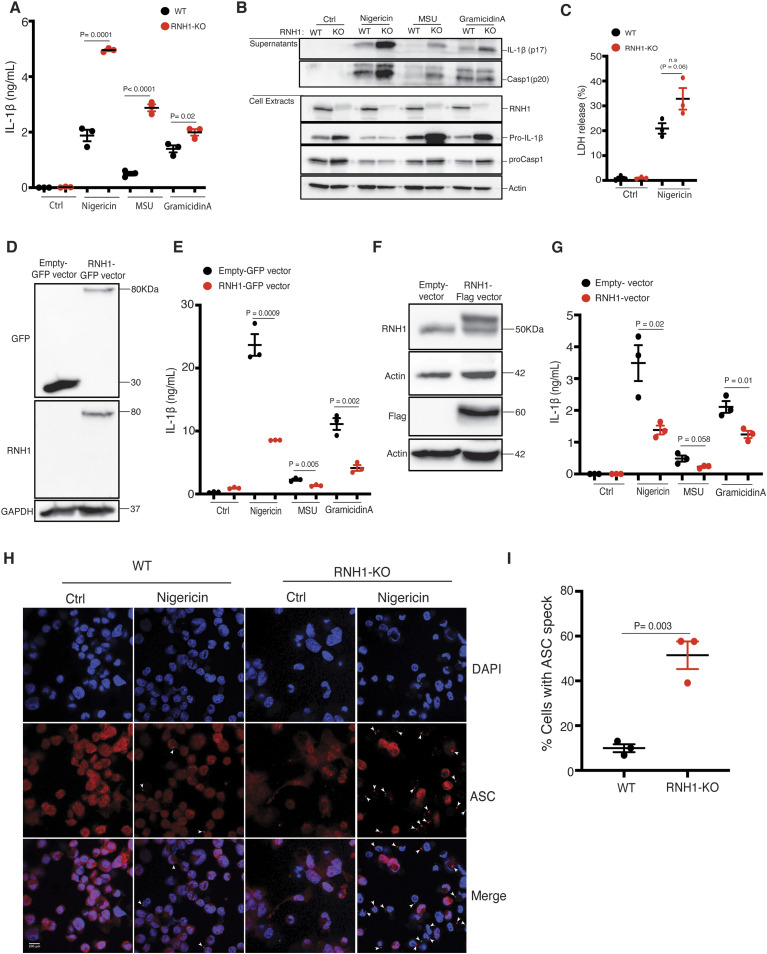
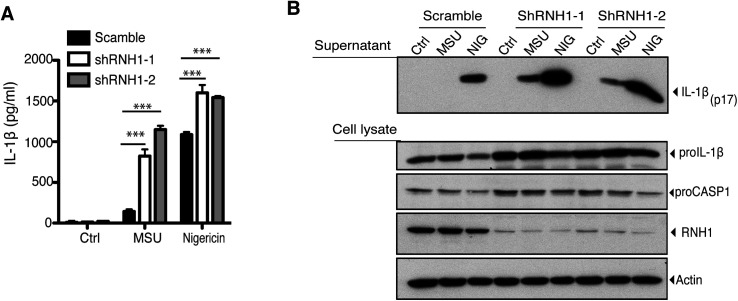
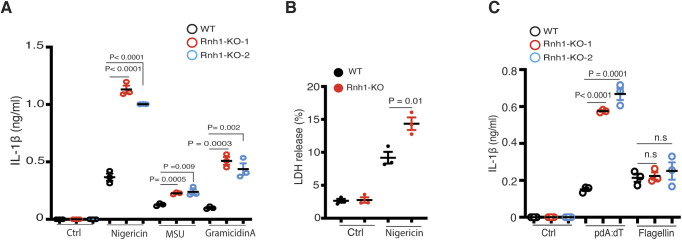
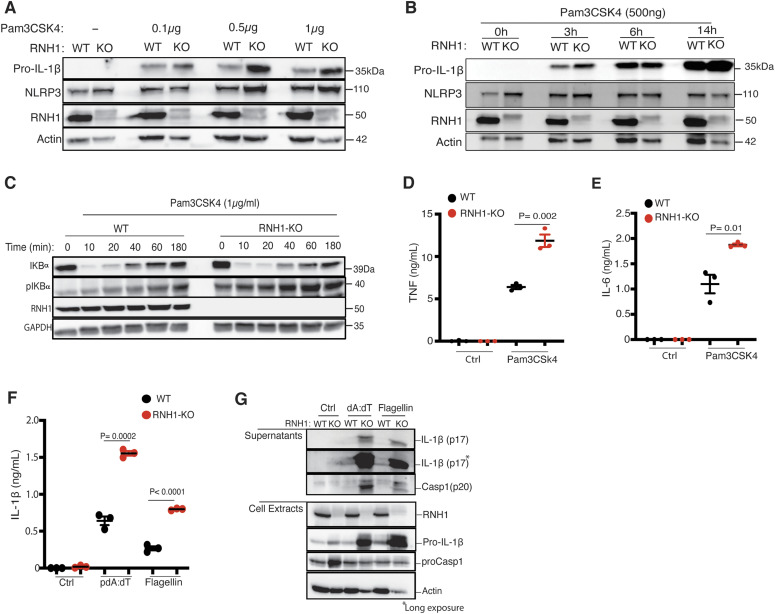
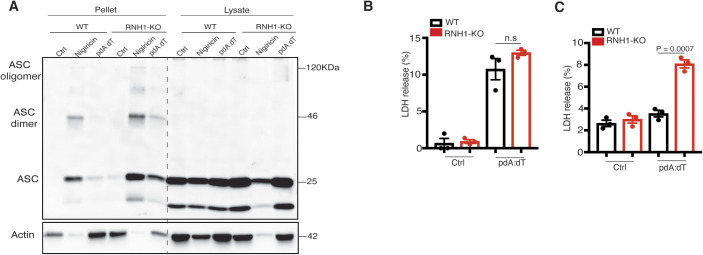
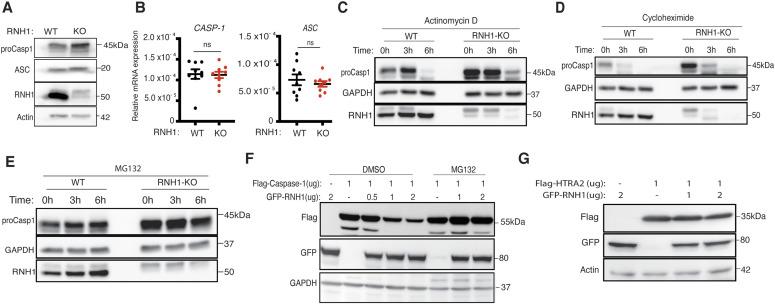
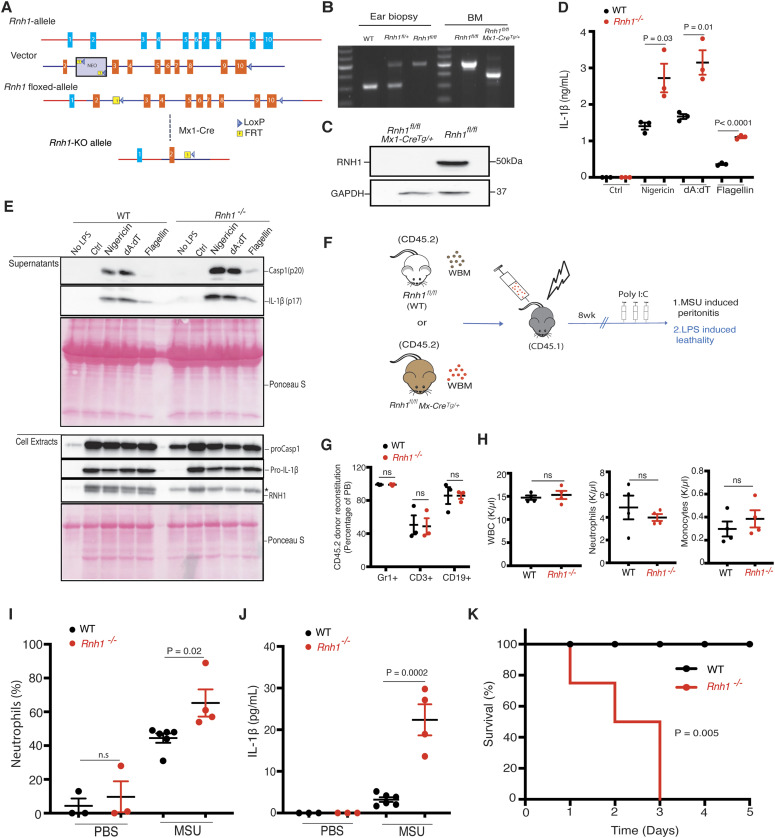
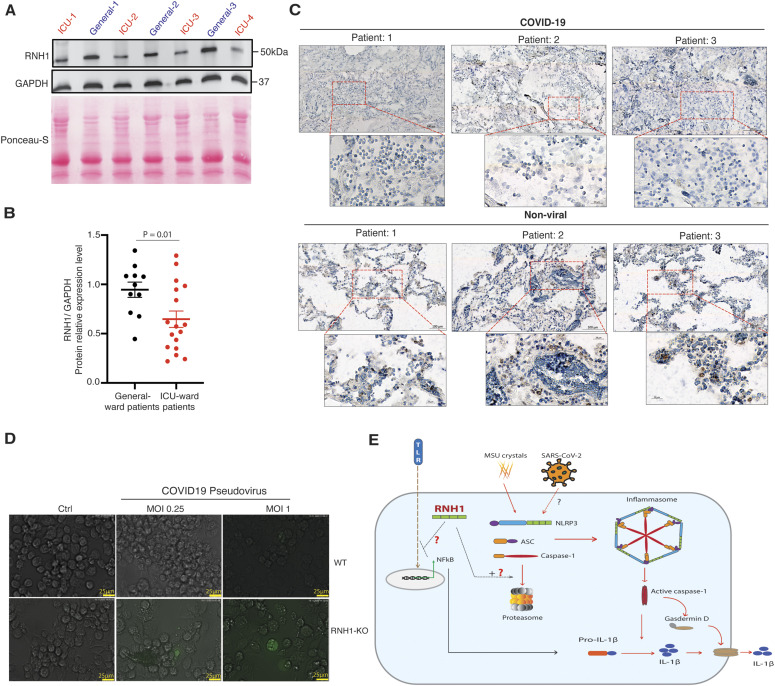
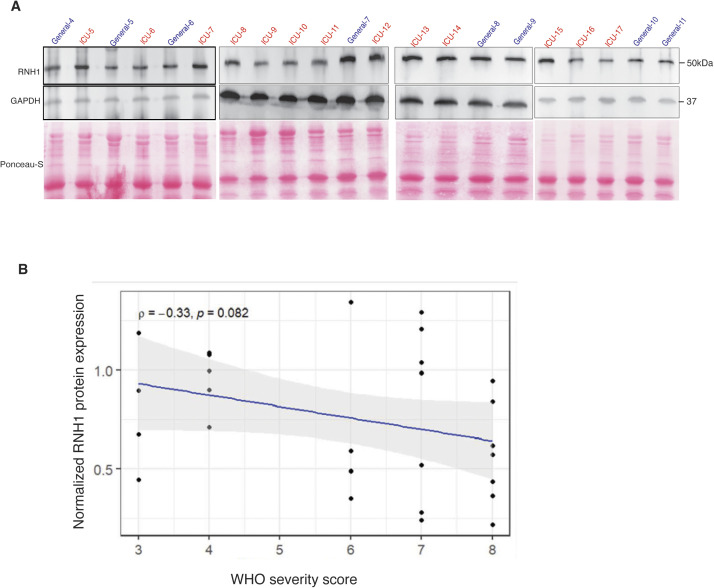
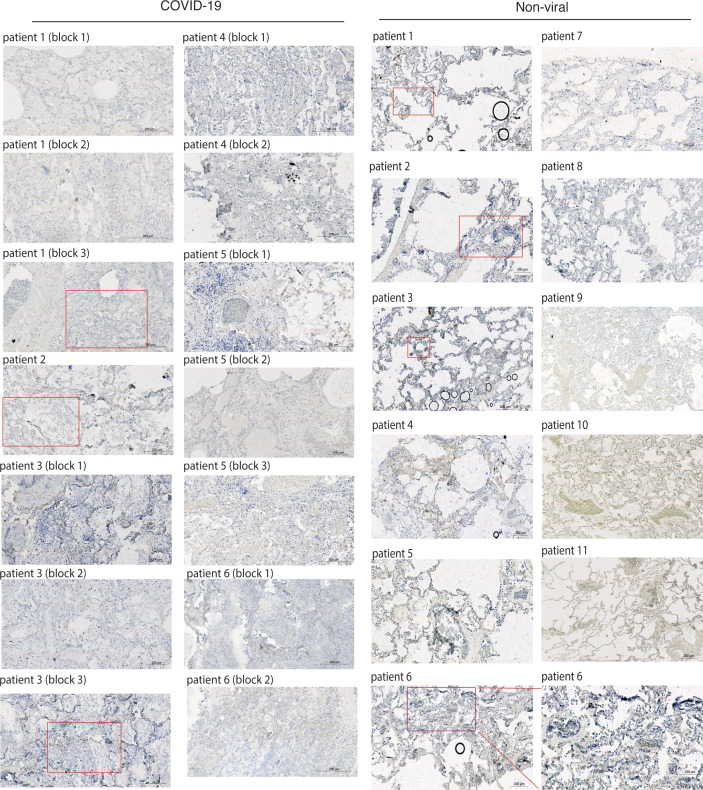
Inflammasomes are cytosolic innate immune sensors of pathogen infection and cellular damage that induce caspase-1-mediated inflammation upon activation. Although inflammation is protective, uncontrolled excessive inflammation can cause inflammatory diseases and can be detrimental, such as in coronavirus disease (COVID-19). However, the underlying mechanisms that control inflammasome activation are incompletely understood. Here we report that the leucine-rich repeat (LRR) protein ribonuclease inhibitor (RNH1), which shares homology with LRRs of NLRP (nucleotide-binding oligomerization domain, leucine-rich repeat, and pyrin domain containing) proteins, attenuates inflammasome activation. Deletion of RNH1 in macrophages increases interleukin (IL)-1β production and caspase-1 activation in response to inflammasome stimulation. Mechanistically, RNH1 decreases pro-IL-1β expression and induces proteasome-mediated caspase-1 degradation. Corroborating this, mouse models of monosodium urate (MSU)-induced peritonitis and lipopolysaccharide (LPS)-induced endotoxemia, which are dependent on caspase-1, respectively, show increased neutrophil infiltration and lethality in Rnh1 -/- mice compared with wild-type mice. Furthermore, RNH1 protein levels were negatively related with disease severity and inflammation in hospitalized COVID-19 patients. We propose that RNH1 is a new inflammasome regulator with relevance to COVID-19 severity.


Conflict of interest statement

The authors declare that they have no conflict of interest.

Figures

Figure 1.
Figure 1.. RNH1 shares homology with multiple NLR proteins and is expressed in myeloid cells.
(A) Circular tree representing the domain conservation relationship of human RNH1. Protein sequence alignments were made using MAFFT. A maximum likelihood phylogenetic tree was generated using IQ-Tree with 1,000 bootstrap replicates. Internal tree scale is shown with circular grid. (B) Structural alignment of protein domains. The domain information of selected proteins taken from Uniprot and represented using Illustrator for Biological Sequences (IBS) tool. (C) Human healthy BM biopsies were stained with RNH1 antibody. Myeloid cells showing high RNH1 expression are indicated with arrows. Scale bar 100 μm. (D) BM biopsies from patients with confirmed inflammatory conditions were stained with RNH1 antibody. Myeloid cells with increased RNH1 expression are indicated with arrows. These patients were non–COVID-19 patients. Scale bar 100 μm. (E) THP1 cells were stimulated with TLR2 ligand Pam3CSK4 (1 μg/ml) for 24 h. Total protein lysates were isolated and analysed by Western blot with indicated antibodies. Blots are representative of two independent experiments. (F) Mouse primary BMDMs were stimulated with TLR4 ligand LPS (1 μg/ml) for 24 h. Total protein lysates were isolated and analysed by Western blot with indicated antibodies. Blots are representative of two independent experiments. NLRP (nucleotide-binding oligomerization domain, leucine-rich repeat and pyrin domain–containing protein), NACHT (nucleotide-binding oligomerization domain), LRR (leucine-rich repeat protein), CARD (caspase activation and recruitment domain), CARMIL1 (capping protein regulator and myosin 1 linker 1), PODN L1 (podocan like 1), LRRC31 (leucine-rich repeat containing 31), NOD1 (nucleotide-binding oligomerization domain containing 1), and FIIND (function to find domain). Source data are available for this figure.
Figure 2.
Figure 2.. RNH1 inhibits NLRP3 inflammasome activation.
(A, B) PMA differentiated wild-type (WT) and RNH1-KO THP1 cells were stimulated with Nigericin (5 μM) for 1 h or with MSU (500 μg) and Gramicidin A (30 μg) for 5 h. (A) Supernatants were collected and IL-1β ELISA was performed. Data shown as mean ± SEM of pooled data from three independent experiments. Statistical analyses were performed using a two-tailed t test. (B) Cell lysates and supernatants were analysed for pro- and cleaved-forms of caspase-1 and IL-1β by Western blot. Blots were representative of three independent experiments. (C) WT and RNH1-KO THP1 cells were stimulated with NLRP3 agonist Nigericin (5 μM) for 18 h. Supernatants were collected, and cell death was measured with LDH assay. Data shown as mean ± SEM of pooled data from three independent experiments. Statistical analyses were performed using a two-tailed t test. (D, E) RNH1-KO THP-1 cells transiently infected with GFP tagged control or RNH1 expressing lentivirus particles. (D) Cell lysates were analysed by Western blot to demonstrate the RNH1 reconstitution in RNH1-KO THP1 cells. Blots are representative of three independent experiments. (E) These cells were stimulated with Nigericin (5 μM) for 1 h or with MSU (500 μg) or Gramicidin A (30 μg) for 5 h. Supernatants were collected and IL-1β ELISA was performed. Data shown as mean ± SEM of pooled data from three independent experiments. (F, G) Total cell lysates from THP1 cells constitutively expressing control or Flag-RNH1 were analysed by Western blot with indicated antibodies to demonstrate RNH1 overexpression (F). Blots are representative of three independent experiments. These cells were stimulated with Nigericin (5 μM) for 1 h or with MSU (500 μg) or Gramicidin A (30 μg) for 5 h. (G) Supernatants were collected and IL-1β ELISA was performed (G). Data shown as mean ± SEM of pooled data from three independent experiments. (H, I) Immunofluorescence microscopy analysis of ASC specks in THP1 cells stimulated with Nigericin (5 μM) for 1 h. DNA staining is shown in blue (DAPI) and ASC staining is shown in red. Arrowheads indicate ASC inflammasome specks. (Scale bar: 100 μm) (H). Quantification of ASC specks (I). Data shown as mean ± SEM of pooled data analyzing at least 10 fields from three independent experiments. Source data are available for this figure.
Figure S1.
Figure S1.. RNH1 knockdown aggravated NLRP3 inflammasome activation.
(A, B) PMA differentiated scramble and RNH1 knockdown THP1 cells were stimulated with Nigericin (NIG) (5 μM) for 1 h and for 5 h with MSU (500 μg). (A) Supernatant was collected and IL-1β ELISA was performed. Data are means ± SEM of pooled data from three independent experiments. Statistical analyses were performed using a two-tailed t test. (B) Cell lysates and supernatants were analysed for pro- and cleaved-forms of IL-1β by Western blot. Blots were representative of two independent experiments. Source data are available for this figure.
Figure S2.
Figure S2.. Loss of RNH1 increased inflammasome activation in iMAC cells.
(A) WT and Rnh1-KO iMAC cells were primed with 500 ng of LPS for 3 h and then stimulated with Nigericin (5 μM) for 1 h or with MSU (500 μg) and Gramicidin A (30 μg) for 5 h. Supernatant were collected and IL-1β ELISA was performed. (B) WT and Rnh1-KO iMAC cells were primed with 500 ng of LPS for 3 h and then stimulated with Nigericin (5 μM) for 8 h. Supernatants were collected, and cell death was measured by LDH assay. (C) iMAC cells were primed with 500 ng of LPS for 3 h and then transfected with AIM2 agonist poly dA:dT (5 μg) or NAIP/NLRC4 agonist cytosolic flagellin (600 ng) for 5 h. Supernatants were collected and IL-1β ELISA was performed. All the data are means ± SEM of pooled data from three independent experiments. Statistical analyses were performed using a two-tailed t test. Source data are available for this figure.
Figure 3.
Figure 3.. RNH1 negatively regulates activation of NF-κB, AIM2 and NAIP/NLRC4.
(A, B) Undifferentiated WT and RNH1-KO THP1 cells were stimulated with TLR2 ligand Pam3CSK4 in a dose- (A) and time- (B) dependent manner as indicated. Total cell lysates analysed for pro-IL-1β and NLRP3 expression by Western blot. Blots are representative of three independent experiments. (C) Undifferentiated WT and RNH1-KO THP1 cells were stimulated with Pam3CSK4 (1 μg/ml) for different time points as indicated. Total cell lysates analysed for NF-κB activation by Western blot with indicated antibodies. Blots are representative of three independent experiments. (D, E) Undifferentiated WT and RNH1-KO THP1 cells were stimulated with Pam3CSK4 (1 μg/ml) for 6 and 18 h. Supernatants were analysed for TNF and IL-6 by ELISA, respectively. Data shown as mean ± SEM of pooled data from three independent experiments. (F, G) PMA differentiated WT and RNH1-KO THP1 cells were transfected with AIM2 agonist poly dA:dT (5 μg) or NAIP/NLRC4 agonist cytosolic flagellin (600 ng) for 5 h. (F) Supernatants were collected and IL-1β ELISA was performed (F). Data shown as mean ± SEM of pooled data from three independent experiments. Statistical analyses were performed using a two-tailed t test. (G) Cell lysates and supernatants were analysed for pro- and cleaved-forms of caspase-1 and IL-1β by Western blot (G). Blots are representative of three independent experiments. Source data are available for this figure.
Figure S3.
Figure S3.. Loss of RNH1 increased ASC oligomerization.
(A) PMA-differentiated WT and RNH1-KO THP1 were treated with Nigericin (5 μM) for 1 h and poly(dA:dT) (5 μg) for 5 h. Cross-linked pellets (Pellets) or soluble lysates (Lysates) were immunoblotted for ASC. Blots are representative of three independent experiments. (B, C) WT and RNH1-KO THP1 and iMAC cells were stimulated with AIM2 agonist poly dA:dT (5 μg) for 18 h. Supernatant were collected and cell death was measured by LDH assay. Data are means ± SEM of pooled data from three independent experiments. Statistical analyses were performed using a two-tailed t test. Source data are available for this figure.
Figure 4.
Figure 4.. RNH1 increases caspase-1 degradation through the proteasome.
(A) Total cell lysates from WT and RNH1-KO THP1 cells were analysed for pro-caspase-1 and ASC expression by Western blot. Blots are representative of two independent experiments. (B) qRT-PCR analysis for CASP-1 and ASC mRNAs from WT and RNH1-KO THP1 cells. mRNA levels are normalized to 18S rRNA expression. Data shown as mean ± SEM from three independent experiments. (C, D, E) WT and RNH1-KO THP1 cells were treated with actinomycin D or cycloheximide or with the proteasome inhibitor MG-132 for indicated time duration. Cell lysates were analysed for pro-caspase-1 protein levels by Western blot. Blots are representative of three independent experiments. (F) HEK293T cells were treated with or without MG-132 and transfected with Flag-tagged caspase-1 with different concentration of GFP-tagged RNH1 plasmid as indicated. Cells were harvested and cell lysates were analysed for caspase-1 by Western blot with the indicated antibodies. Blots are representative of three independent experiments. (G) HEK293T cells were transfected with Flag-tagged OMI/HTRA2 plasmid with different concentrations of GFP-tagged RNH1 plasmid as indicated. Cells were harvested and cell lysates were analysed by Western blot with indicated antibodies. Blots are representative of three independent experiments. CASP-1 (caspase-1), ASC (apoptosis-associated speck-like protein containing a caspase activation and recruitment domain), HTRA2 (High temperature requirement protein A2), and GFP (green fluorescent protein). Source data are available for this figure.
Figure 5.
Figure 5.. Rnh1 deficiency promotes inflammation in mice.
(A) Schematic showing design of Rnh1-floxed targeting vector (see the Materials and Methods section for details). (B) DNA isolated from mouse ear biopsies and BM was genotyped by PCR. Primers were designed to distinguish WT and floxed allele sequence. 314 bp size corresponds to WT, and 514 bp size corresponds to floxed gene. To detect Rnh1 deletion after Cre-recombination in Rnh1fl/fl MxCre+ mice (after 1 wk of polyIC treatment), a third primer was used which amplifies 365 bp size (see the Materials and Methods section). (C) Total protein lysates from BM cells of WT and Rnh1−/− mice were analysed by Western blot with the indicated antibodies. Blots are representative of three independent experiments. (D, E) BMDMs from WT and Rnh1−/− mice primed with LPS (100 ng) for 3 h and then cells were stimulated with Nigericin (5 μM) for 1 h or transfected with poly dA:dT (5 μg) or flagellin (600 ng) for 5 h. (D) Supernatants were collected and IL-1β ELISA was performed. Data shown as mean ± SEM and representative of three independent experiments. Statistical analyses were performed using a two-tailed t test. (E) Cell lysates and supernatants were analysed for pro- and cleaved-forms of caspase-1 and IL-1β by Western blot. Blots were representative of two independent experiments. * non-specific band from previous antibody incubation. (F) Schematic showing in vivo experimental setup. BM was transplanted from WT (Rnh1fl/fl) or Rnh1−/− (Rnh1fl/fl MxCre+) (CD45.2) into irradiated recipients (CD45.1). After 8 wk of reconstitution mice were treated with Poly(I:C) (300 μg/mouse) once every 2 d for three doses. 4 d later mice were used for the MSU peritonitis and LPS endotoxemia lethality models. (G) Post transplantation reconstitution levels were monitored after 8 wk in the peripheral blood (PB) as indicated (n = 3 mice). Data shown as mean ± SEM. P-values were determined by a two-tailed t test. (H) PB counts of WBC, neutrophils, and monocytes in WT and Rnh1−/− mice 1 wk after polyIC injections. Data are shown are mean ± SEM. P-values were determined by a two-tailed t test (n = 3). (I, J) WT and Rnh1−/− mice received IP injection of MSU (1 mg/mouse) or sterile PBS. (I) After 12 h, peritoneal lavage fluid was taken, and neutrophils infiltration analysed by FACS (I). (J) Peritoneal lavage supernatants were collected and IL-1β levels were quantified by ELISA (J). Data shown as mean ± SEM and P-values were determined by a two-tailed t test (n = 3–6 per group). (K) Kaplan–Meier survival curves of WT and Rnh1−/− mice after LPS (10 mg/kg) treatment (n = 4 mice). Survival curves were tested with log-rank (Mantel–Cox) test (P = 0.005). Source data are available for this figure.
Figure 6.
Figure 6.. Decreased RNH1 expression associates with disease severity in COVID-19.
(A) Total cell lysates from peripheral blood buffy coats of intensive care unit and general ward admitted COVID-19 patients were analysed for RNH1 protein levels by Western blot. Blots were repeated three times. (B) RNH1 protein levels from blots were quantified by ImageJ analysis for each patient and normalized with respective GAPDH protein levels. Data shown as mean ± SEM and P-values were determined by a two-tailed t test. (C) Postmortem lung tissue from deceased persons with either COVID-19 or non-viral causes of death were stained for RNH1 and imaged using a Zeiss axioscan Z1. Subsequent image analysis was performed using Zeiss ZEN software to extract images at different magnifications. Insets show higher magnification of area indicated in the red boxes. Brown staining indicates RNH1 positive cells. (D) PMA differentiated WT and RNH1-KO THP1 cells were infected with SARS-CoV-2 pseudovirus for 24 h. Infection efficiency was monitored by measuring GFP signal with fluorescence microscopy. Images are representative of two independent experiments. (Scale bar 25 μm). (E) Illustration of RNH1-mediated anti-inflammatory mechanisms. First, RNH1 could potentially inhibit NF-κB signaling through an unknown mechanism. Second, RNH1 regulates inflammasome activation by controlling caspase-1 protein levels via proteasome-mediated degradation. Source data are available for this figure.
Figure S4.
Figure S4.. RNH1 expression negatively associates with disease severity in COVID-19 patients.
(A) Total cell lysates from peripheral blood buffy coats of intensive care unit and general ward admitted COVID-19 patients were analysed for RNH1 protein levels by Western blot. Blots were repeated for three times. (B) Spearman’s rank correlation statistical test was performed using each individual patient’s normalized RNH1 protein levels with World Health Organization severity scores. (Coefficient ρ [rho] = −0.33; P = 0.0824). Source data are available for this figure.
Figure S5.
Figure S5.. RNH1 expression is decreased in COVID-19 patients lung biopsies compared with non-viral patients.
Postmortem lung tissue from deceased persons with either COVID-19 (n = 8) or non-viral (n = 13) causes of death were stained for RNH1 and imaged using a Zeiss AxioScan Z1. Subsequent image analysis was performed using Zeiss ZEN software to extract images at different magnifications. Insets show higher magnification of area indicated in the red boxes. Brown staining indicates RNH1-positive cells. Source data are available for this figure.

References

    1. Allam R, Lawlor KE, Yu EC, Mildenhall AL, Moujalled DM, Lewis RS, Ke F, Mason KD, White MJ, Stacey KJ, et al. (2014) Mitochondrial apoptosis is dispensable for NLRP3 inflammasome activation but non-apoptotic caspase-8 is required for inflammasome priming. EMBO Rep 15: 982–990. 10.15252/embr.201438463 - DOI - PMC - PubMed
    1. Allam R, Maillard MH, Tardivel A, Chennupati V, Bega H, Yu CW, Velin D, Schneider P, Maslowski KM (2015) Epithelial NAIPs protect against colonic tumorigenesis. J Exp Med 212: 369–383. 10.1084/jem.20140474 - DOI - PMC - PubMed
    1. Arthur JS, Ley SC (2013) Mitogen-activated protein kinases in innate immunity. Nat Rev Immunol 13: 679–692. 10.1038/nri3495 - DOI - PubMed
    1. Broz P, Dixit VM (2016) Inflammasomes: Mechanism of assembly, regulation and signalling. Nat Rev Immunol 16: 407–420. 10.1038/nri.2016.58 - DOI - PubMed
    1. Broz P, von Moltke J, Jones JW, Vance RE, Monack DM (2010) Differential requirement for caspase-1 autoproteolysis in pathogen-induced cell death and cytokine processing. Cell Host Microbe 8: 471–483. 10.1016/j.chom.2010.11.007 - DOI - PMC - PubMed

Publication types