. 2022 Apr 13;42(15):3271-3289.
doi: 10.1523/JNEUROSCI.1596-21.2022. Epub 2022 Mar 7.

Differential Activation of Pain Circuitry Neuron Populations in a Mouse Model of Spinal Cord Injury-Induced Neuropathic Pain

Affiliations

Differential Activation of Pain Circuitry Neuron Populations in a Mouse Model of Spinal Cord Injury-Induced Neuropathic Pain

Eric V Brown et al. J Neurosci. .

Abstract

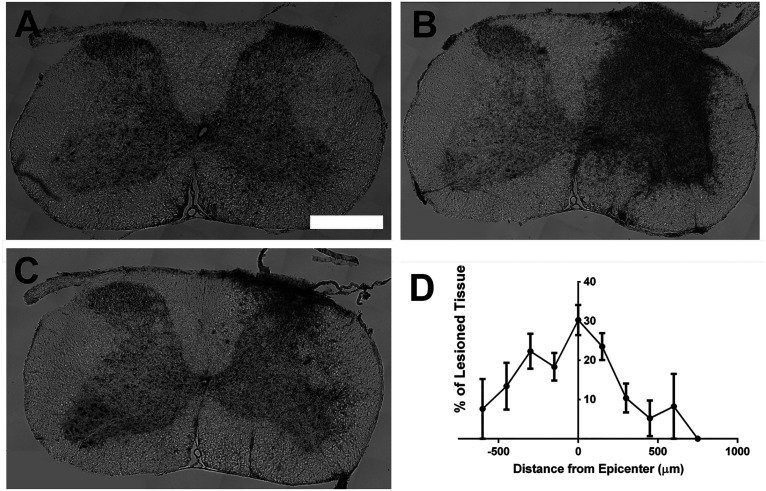
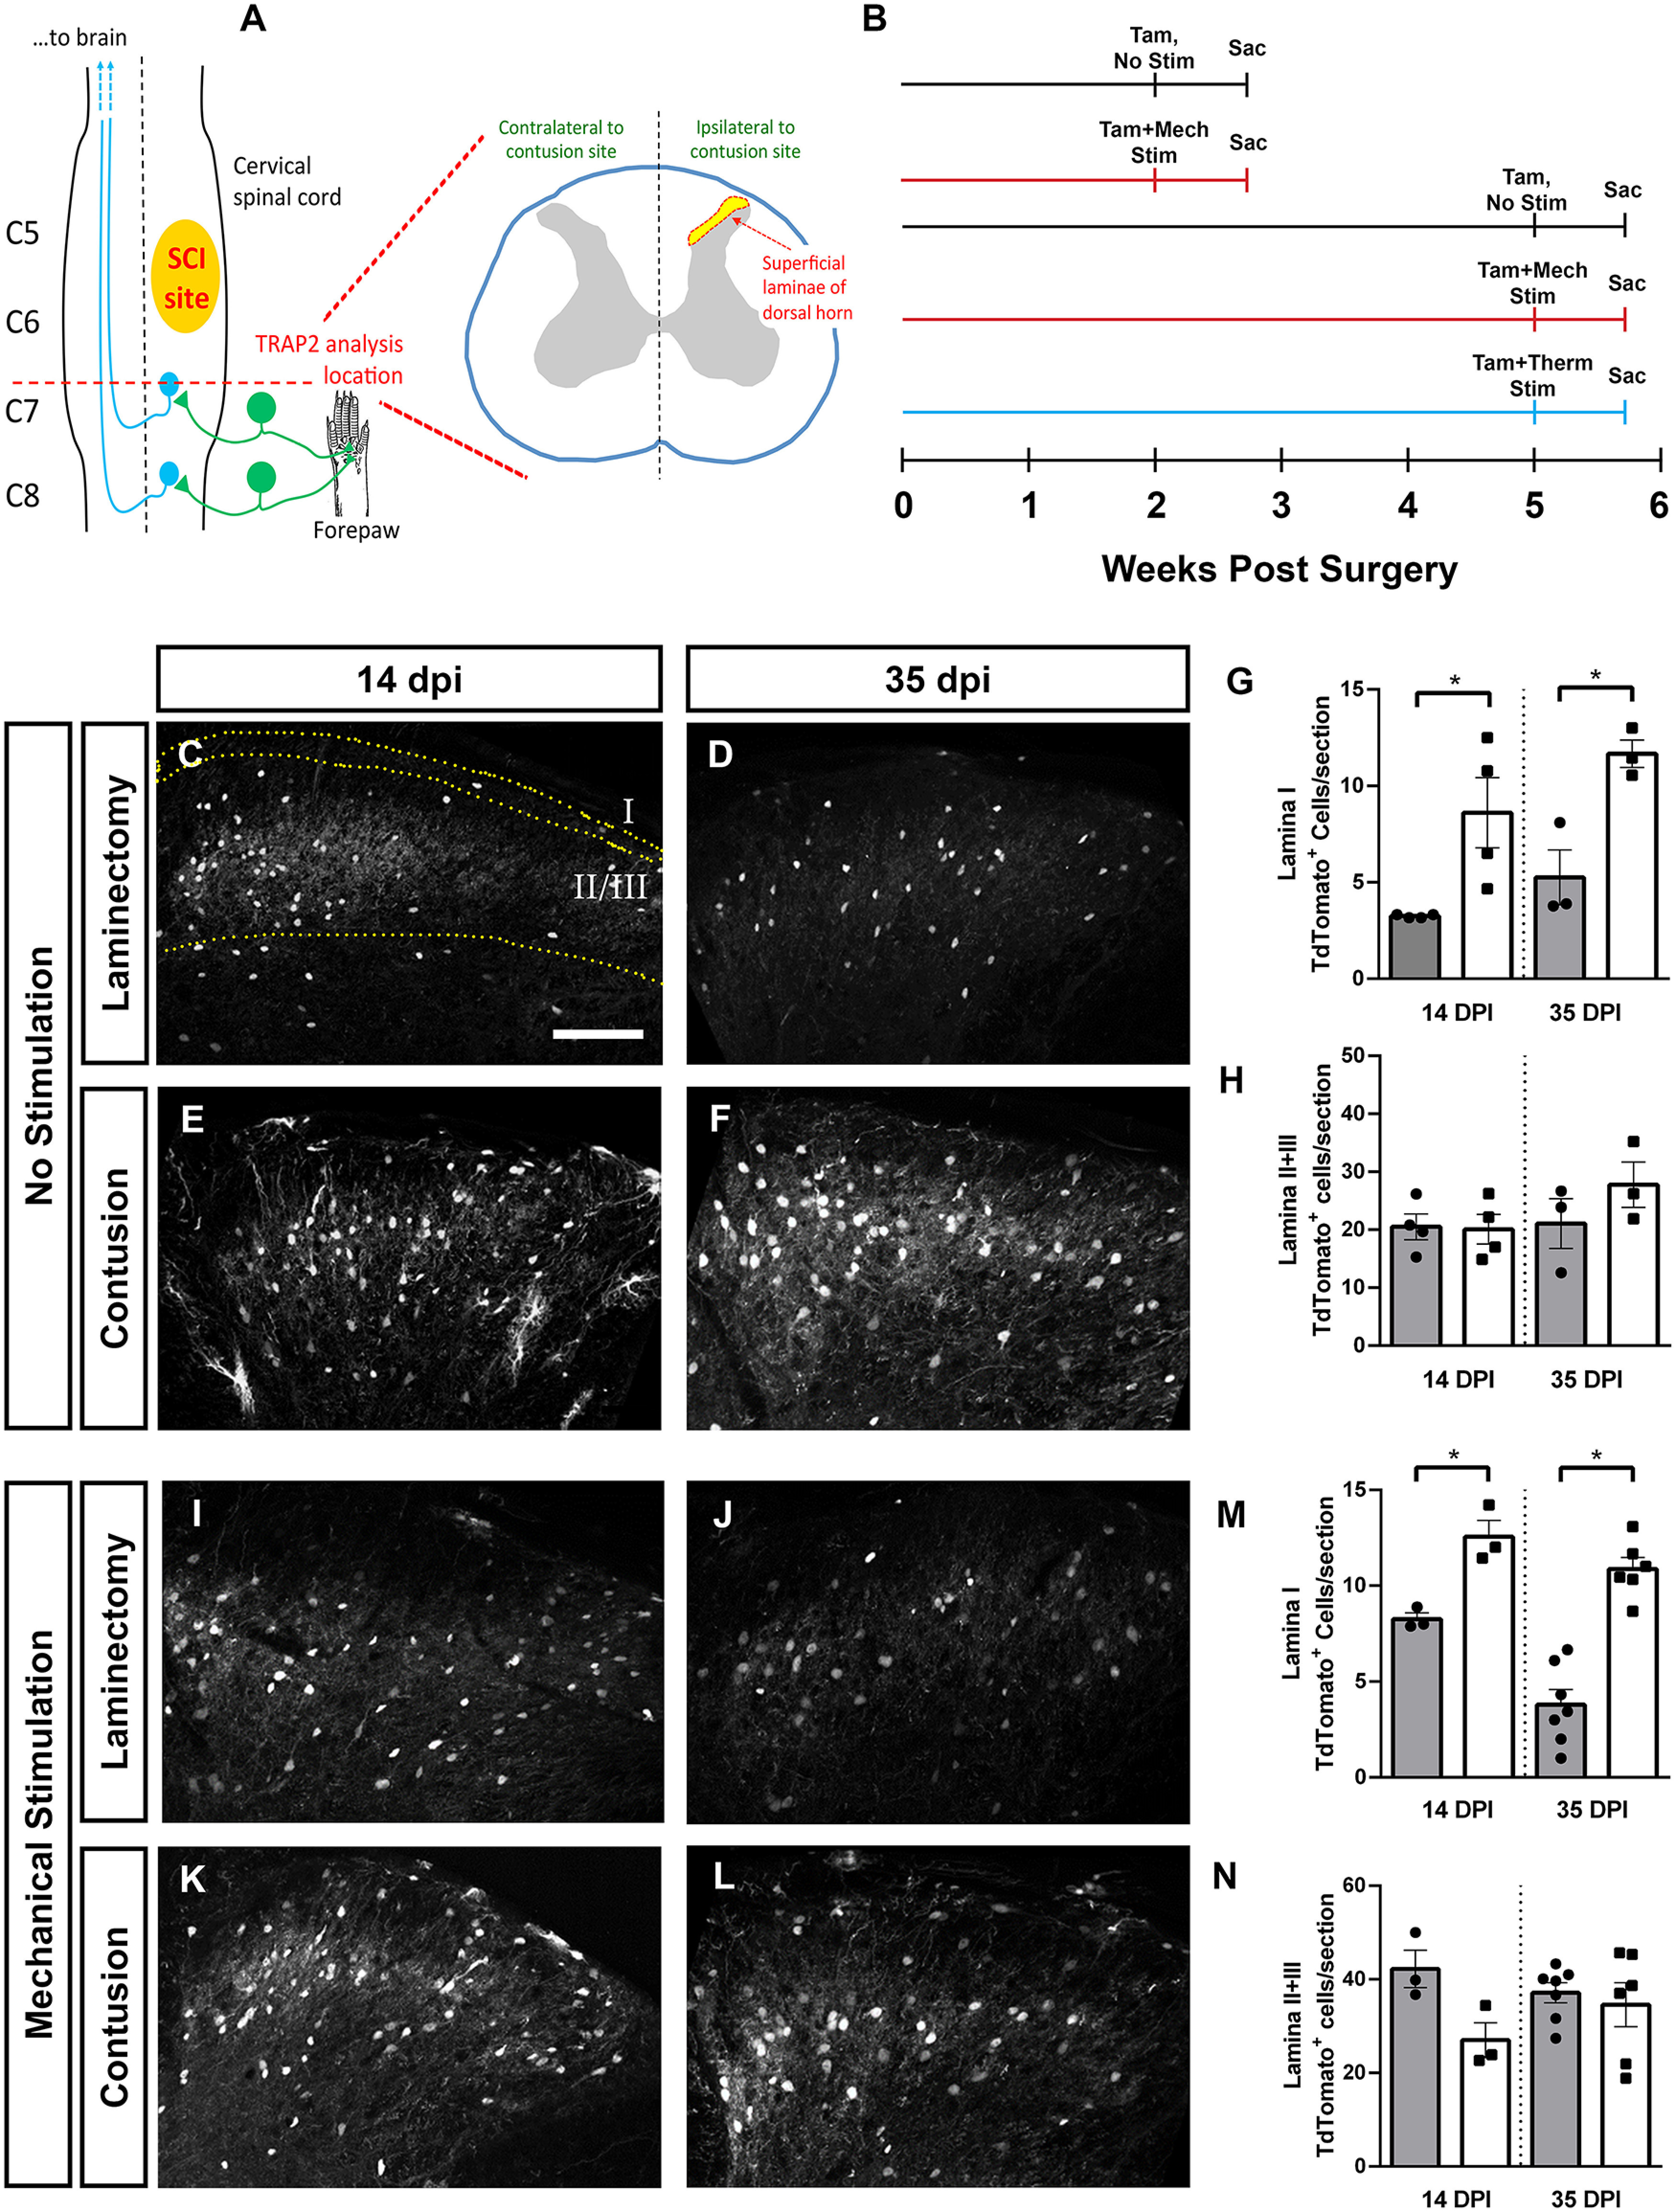
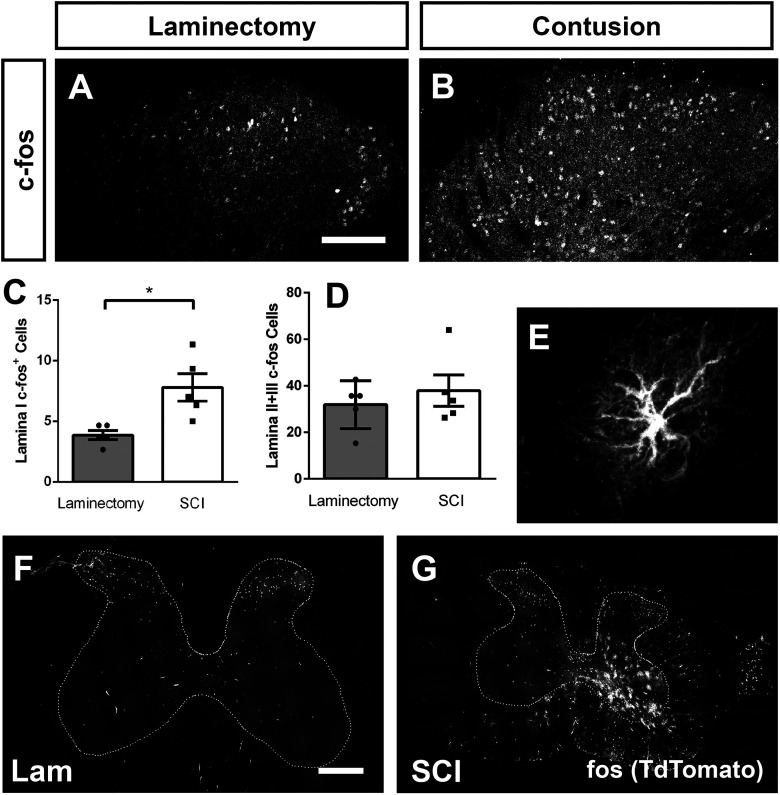
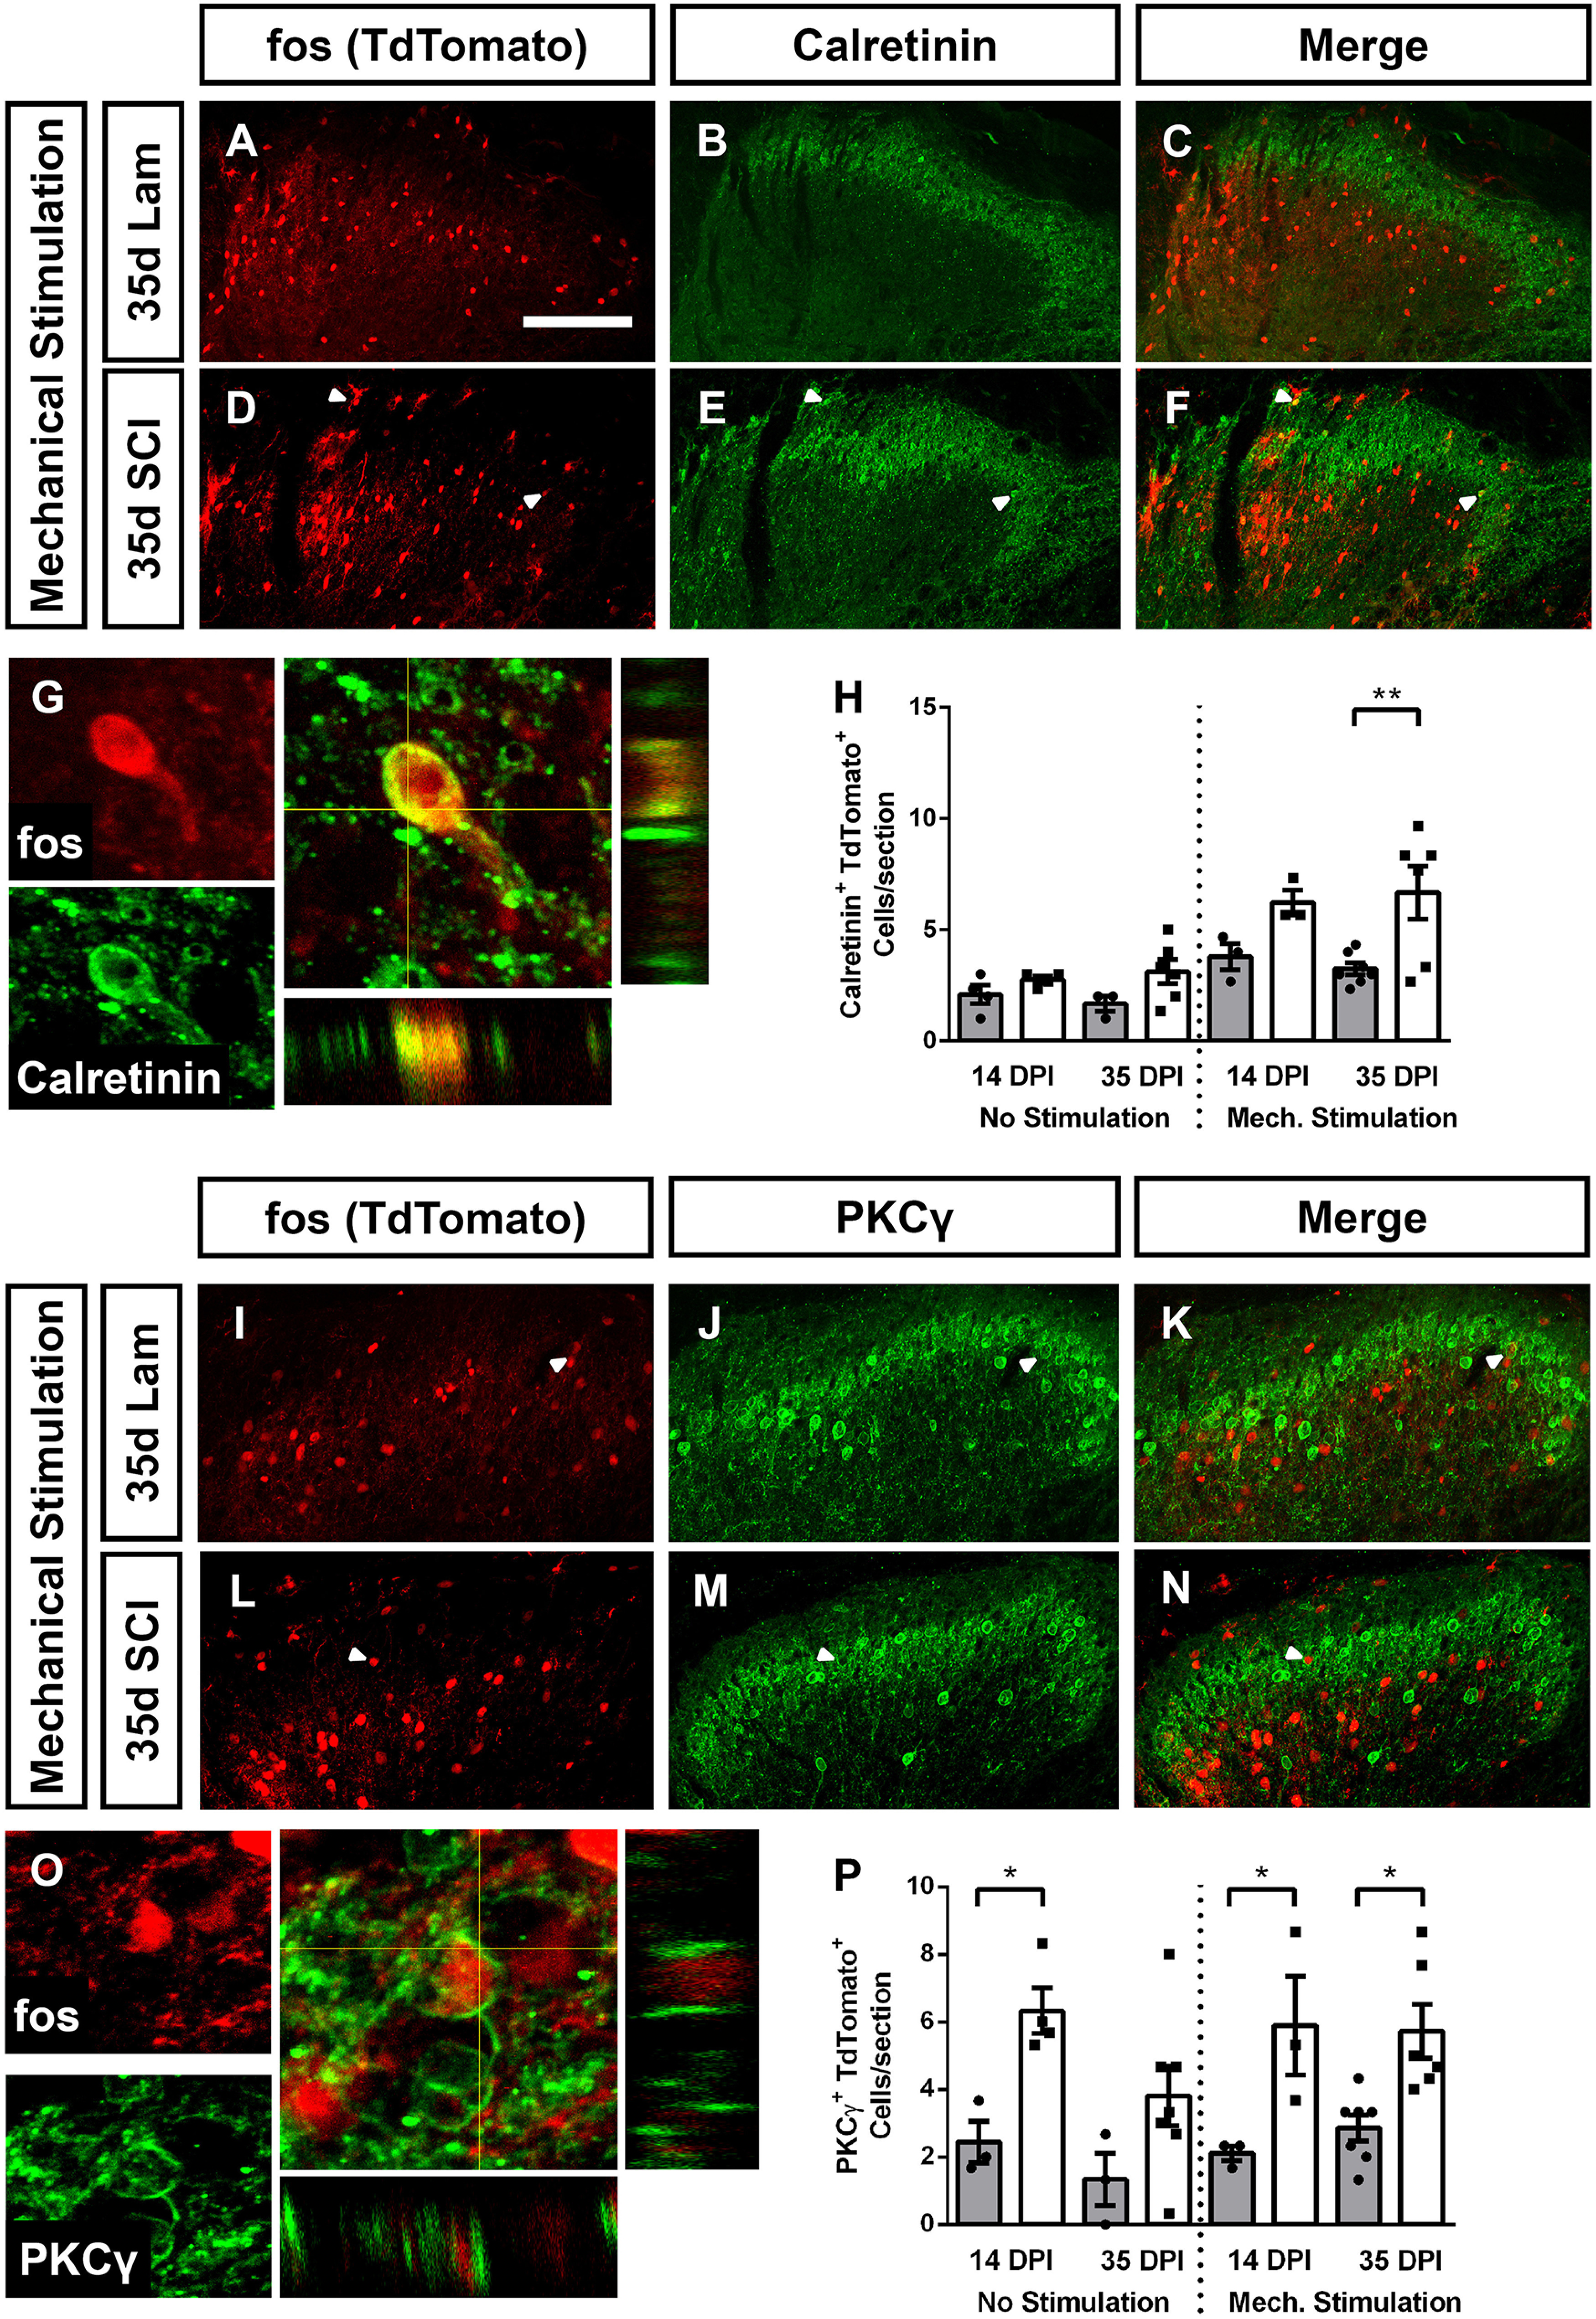
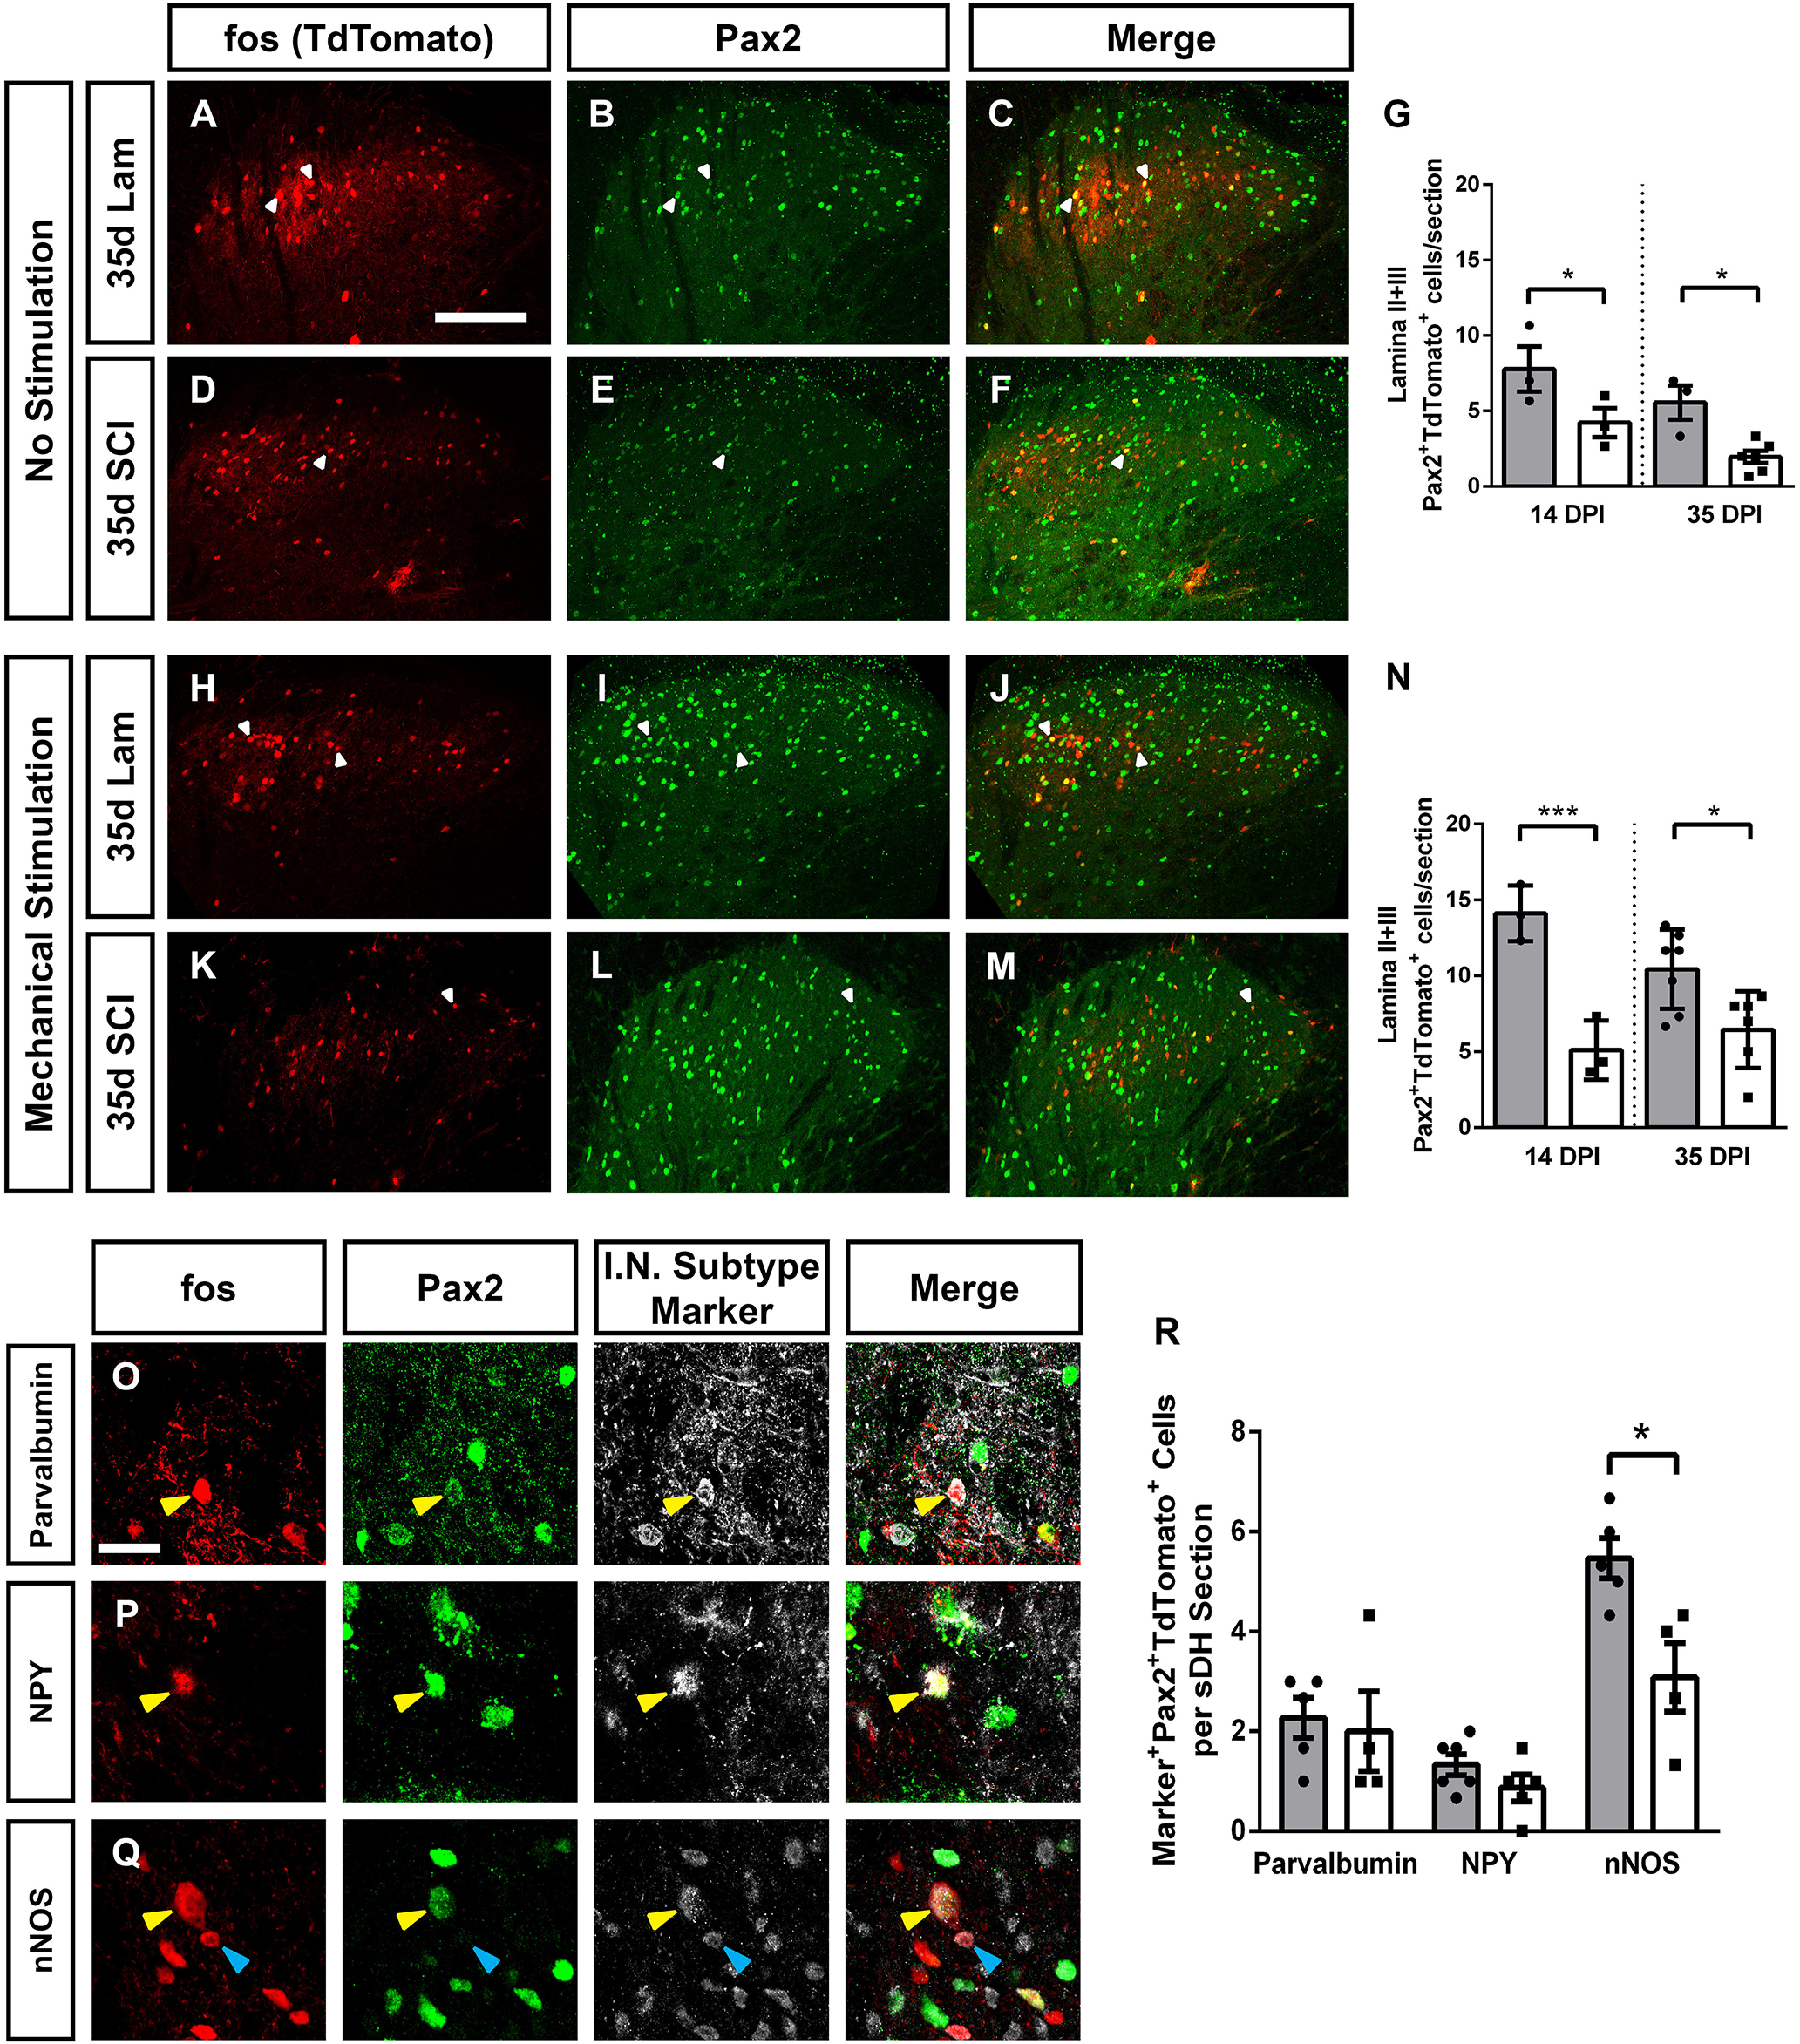
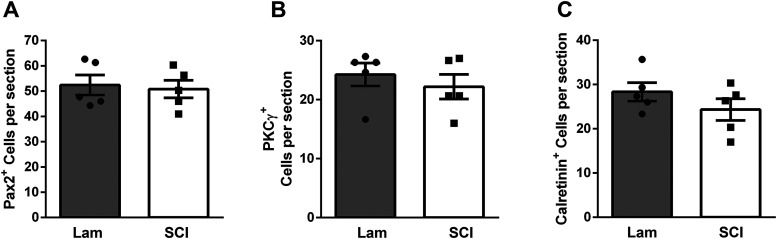
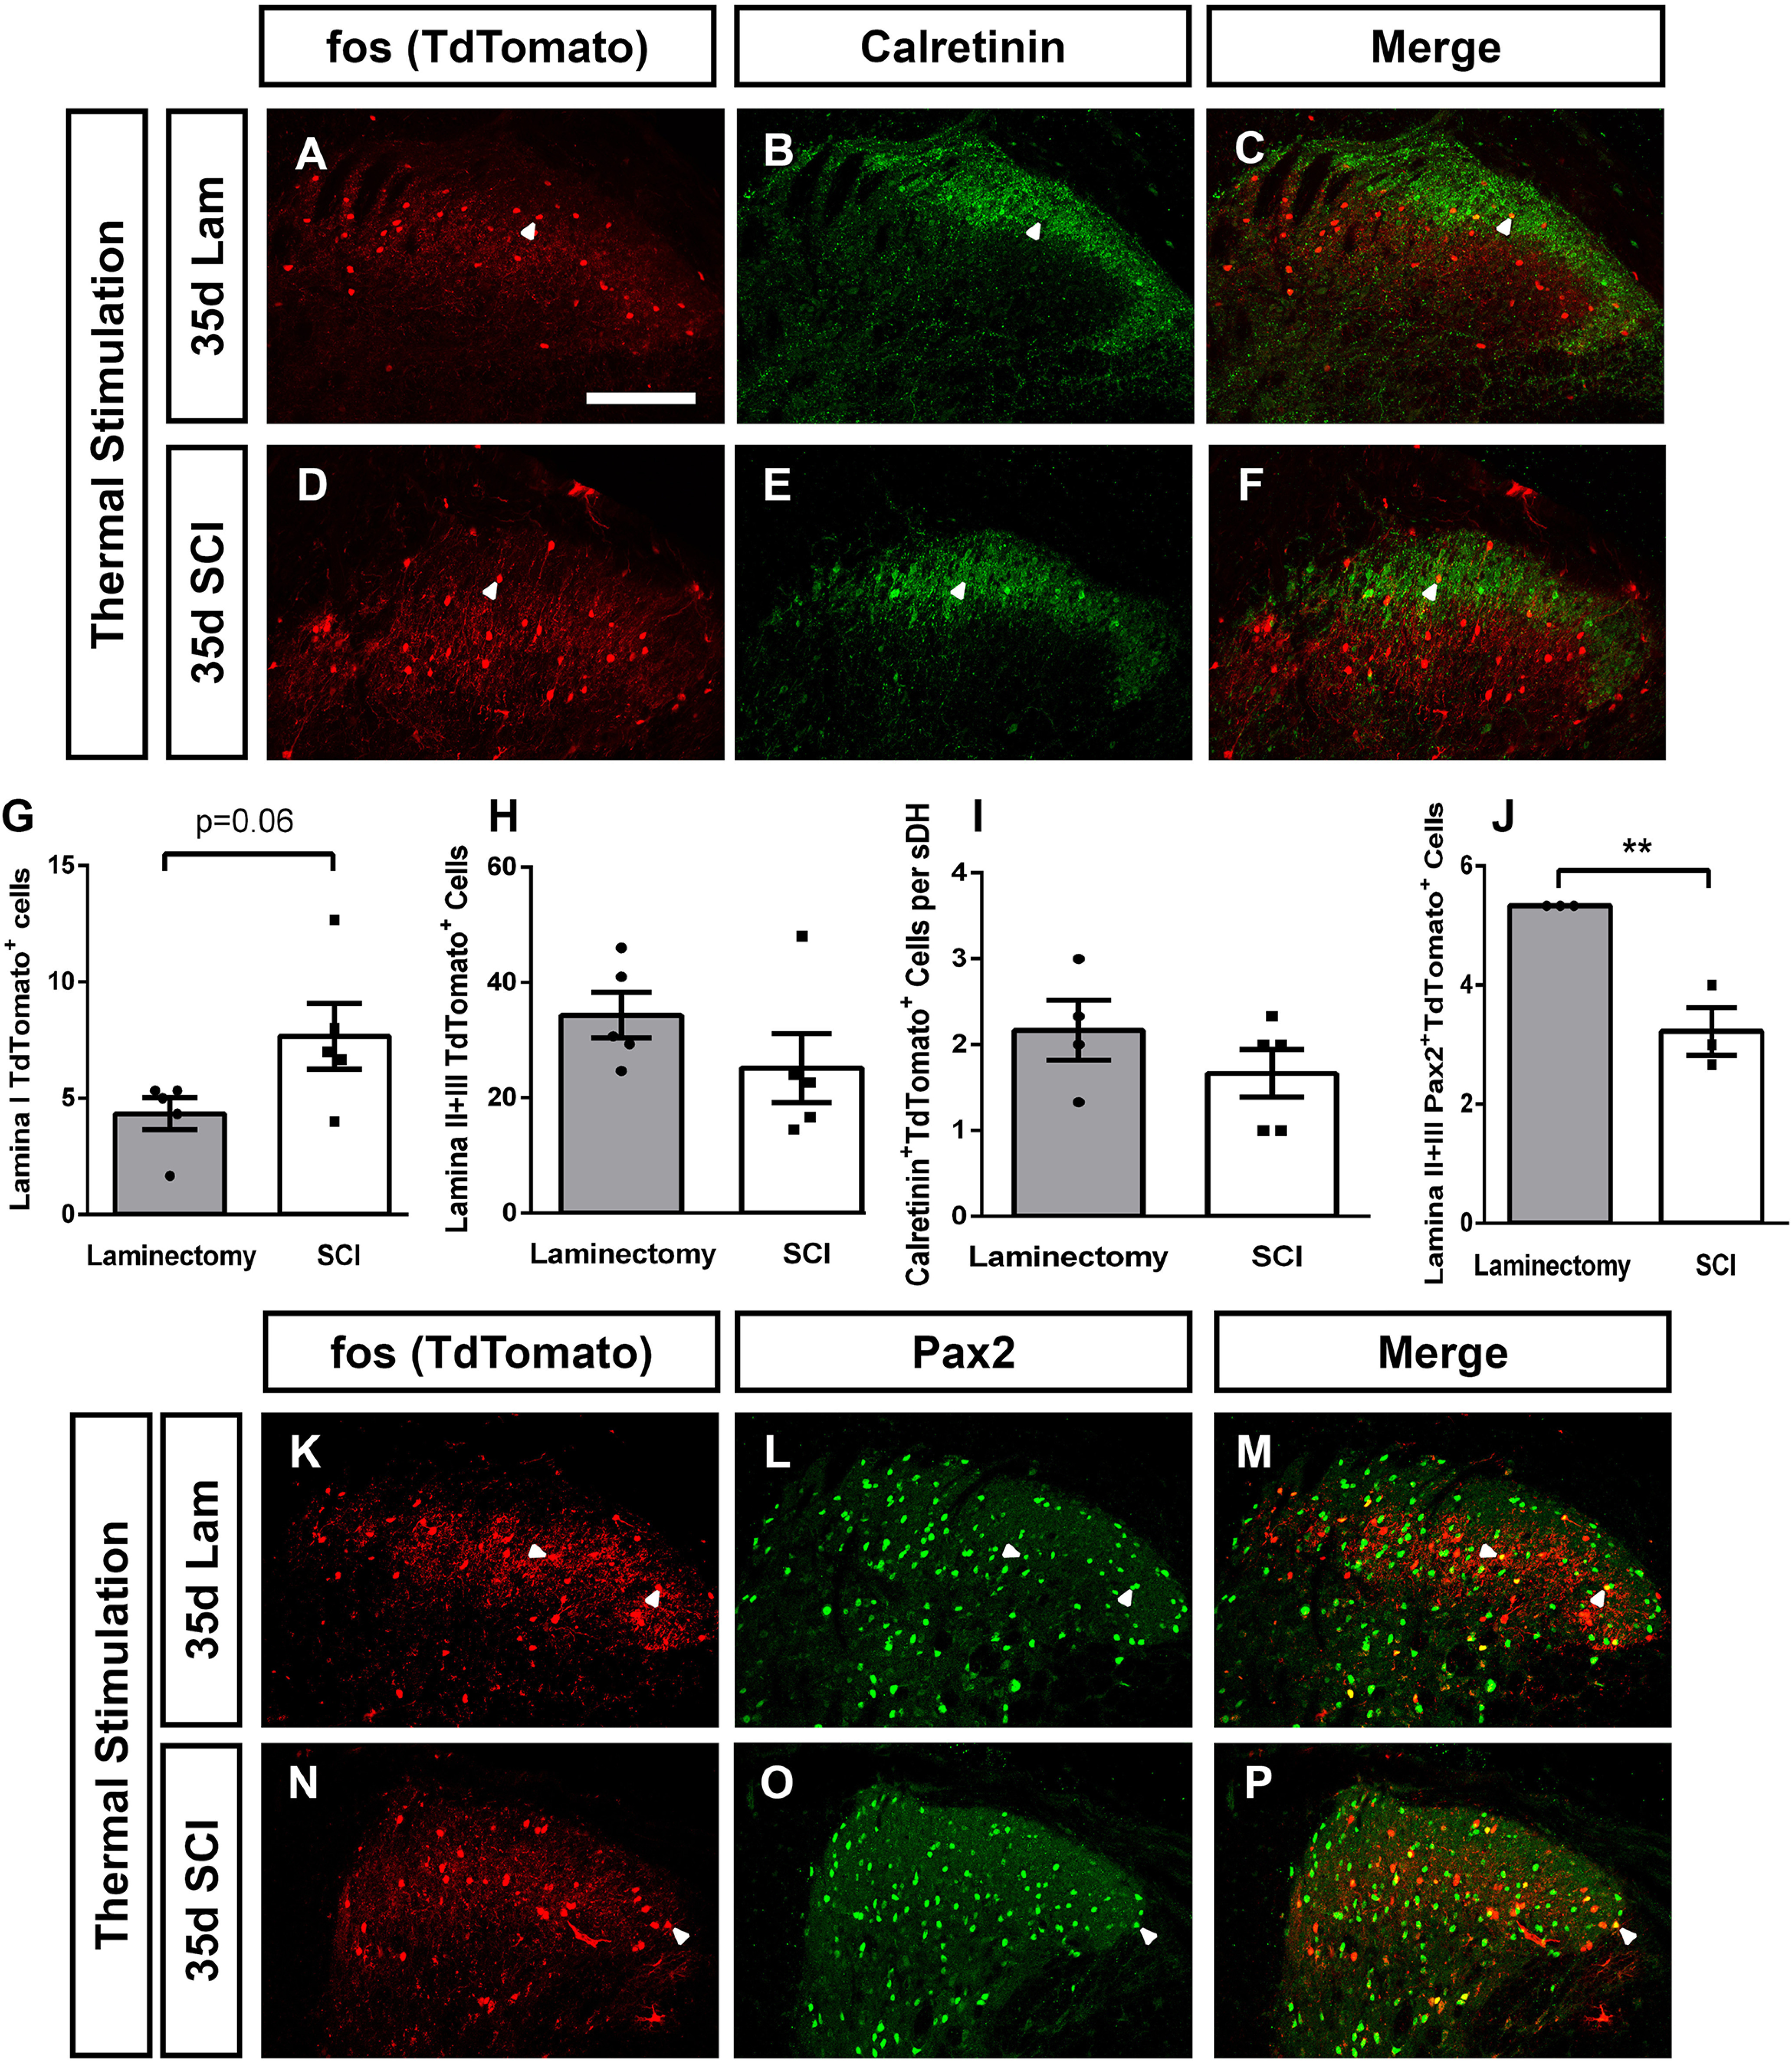
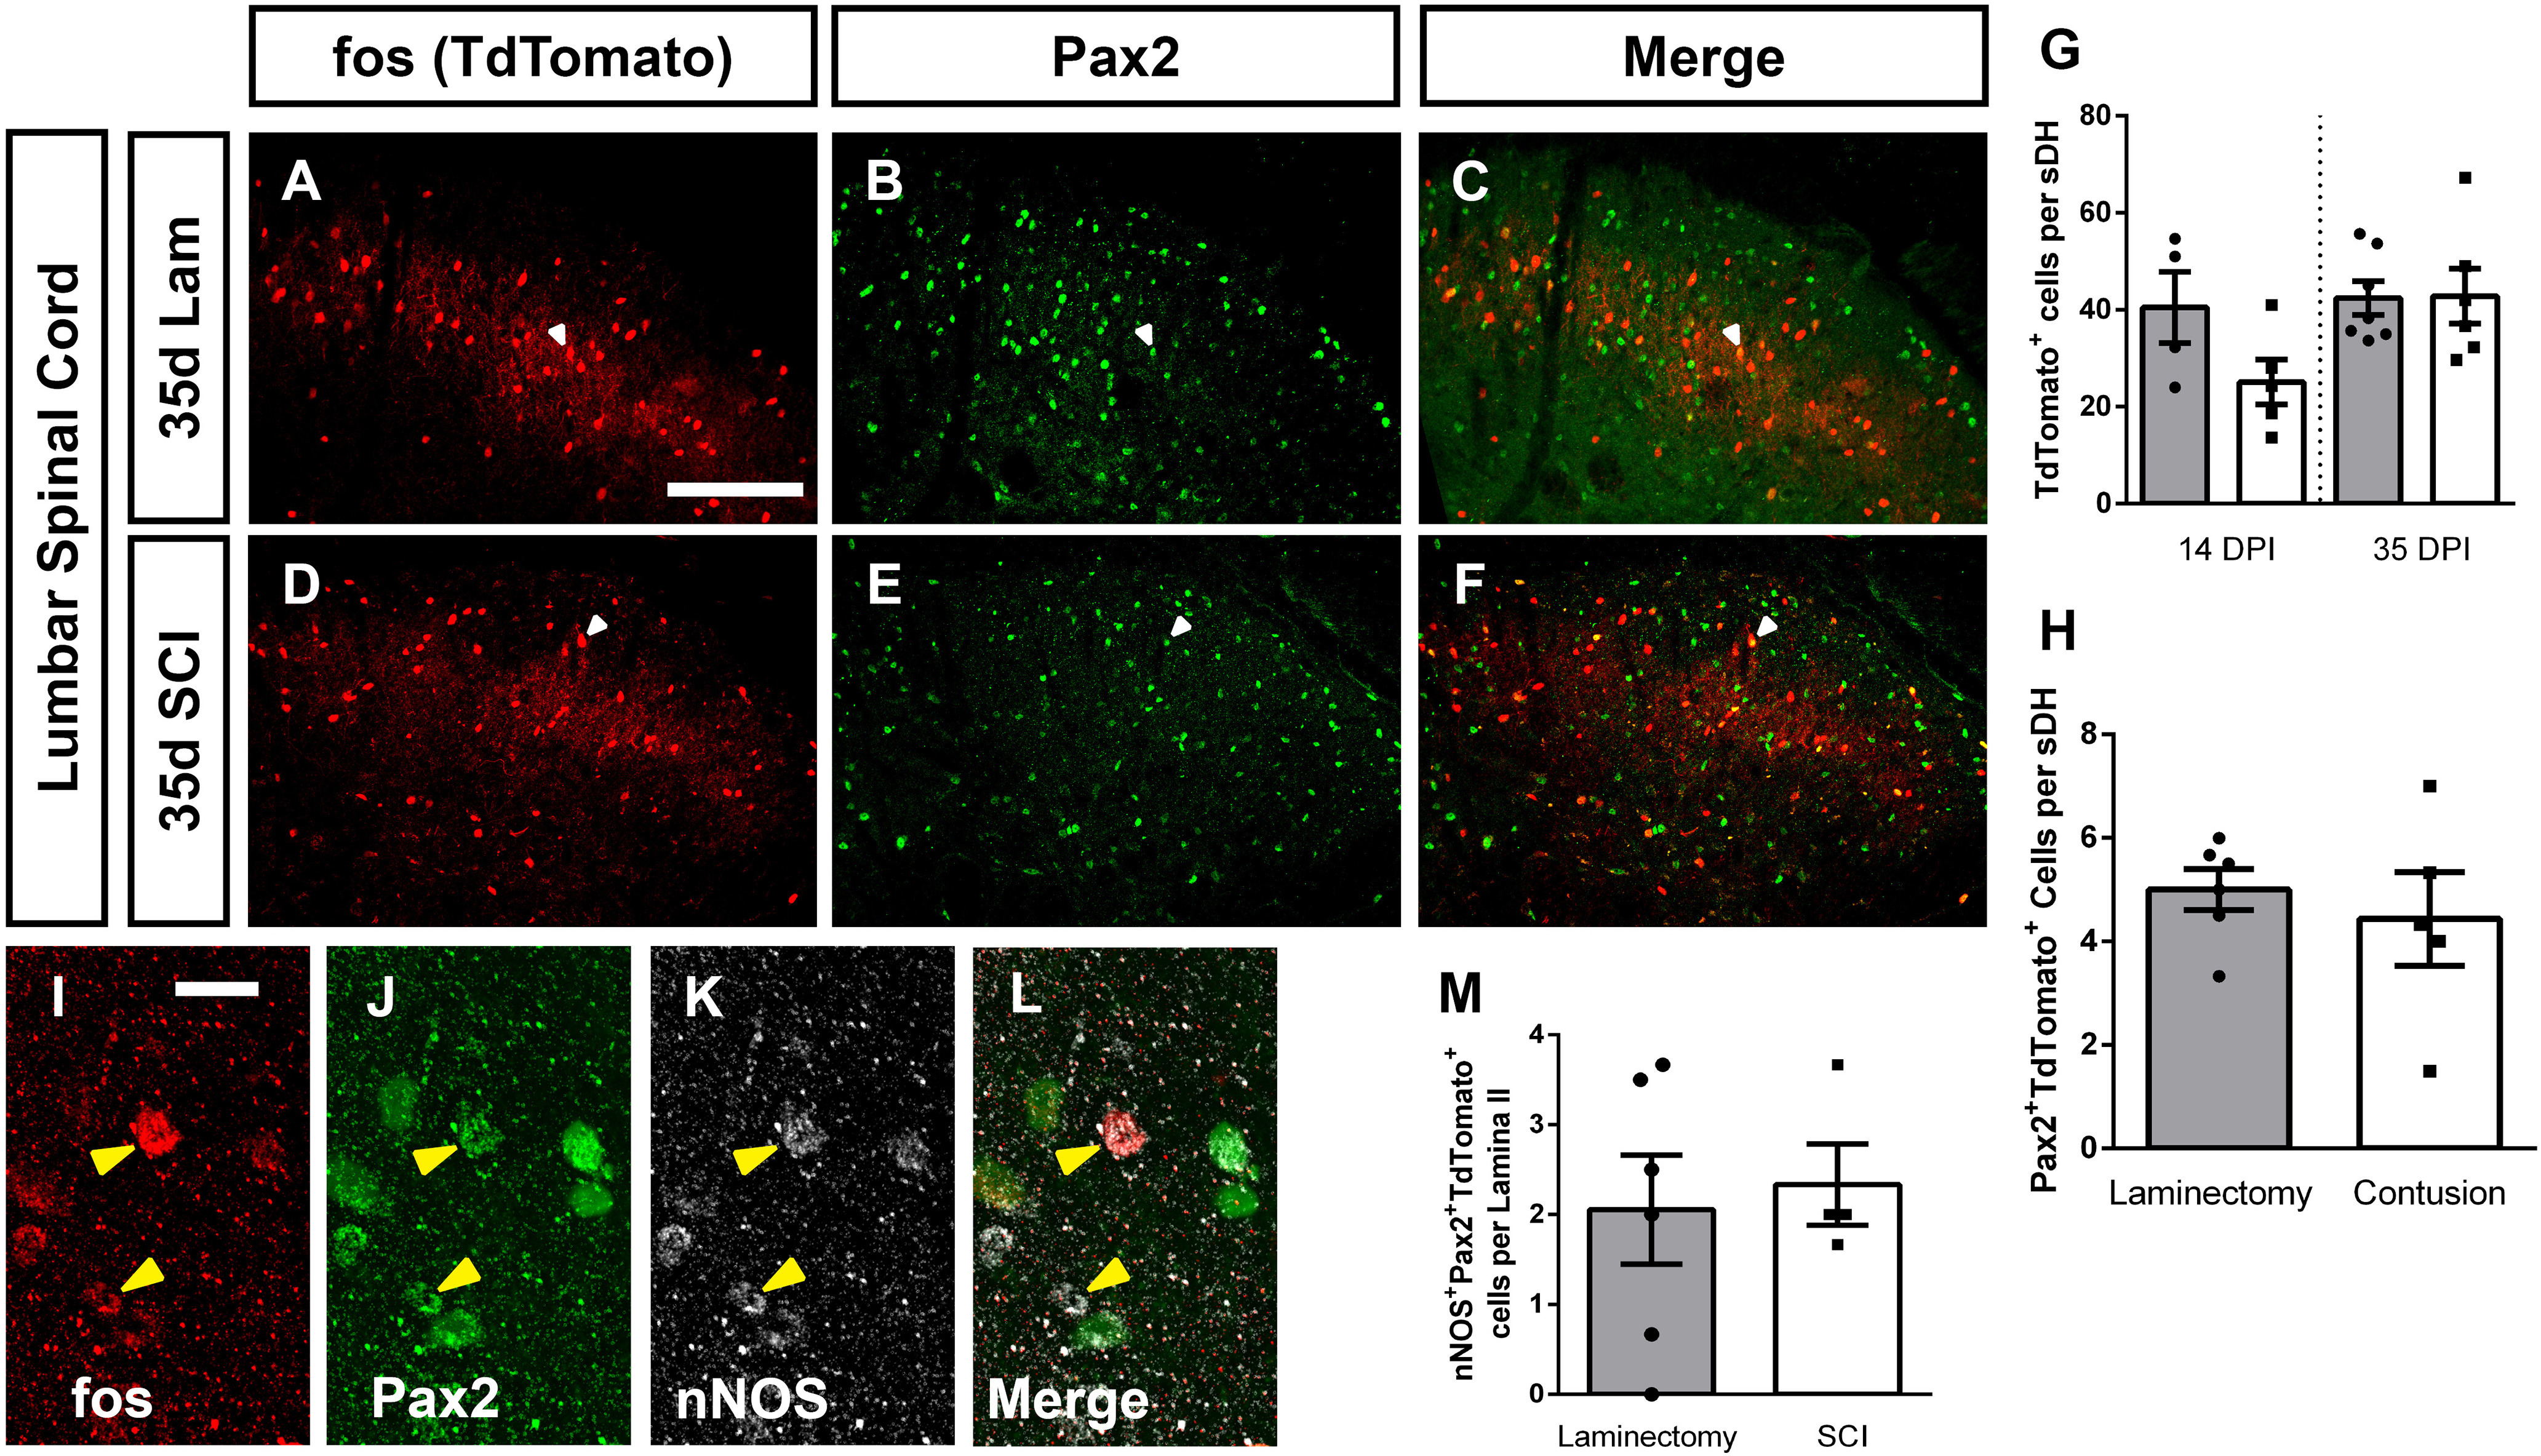
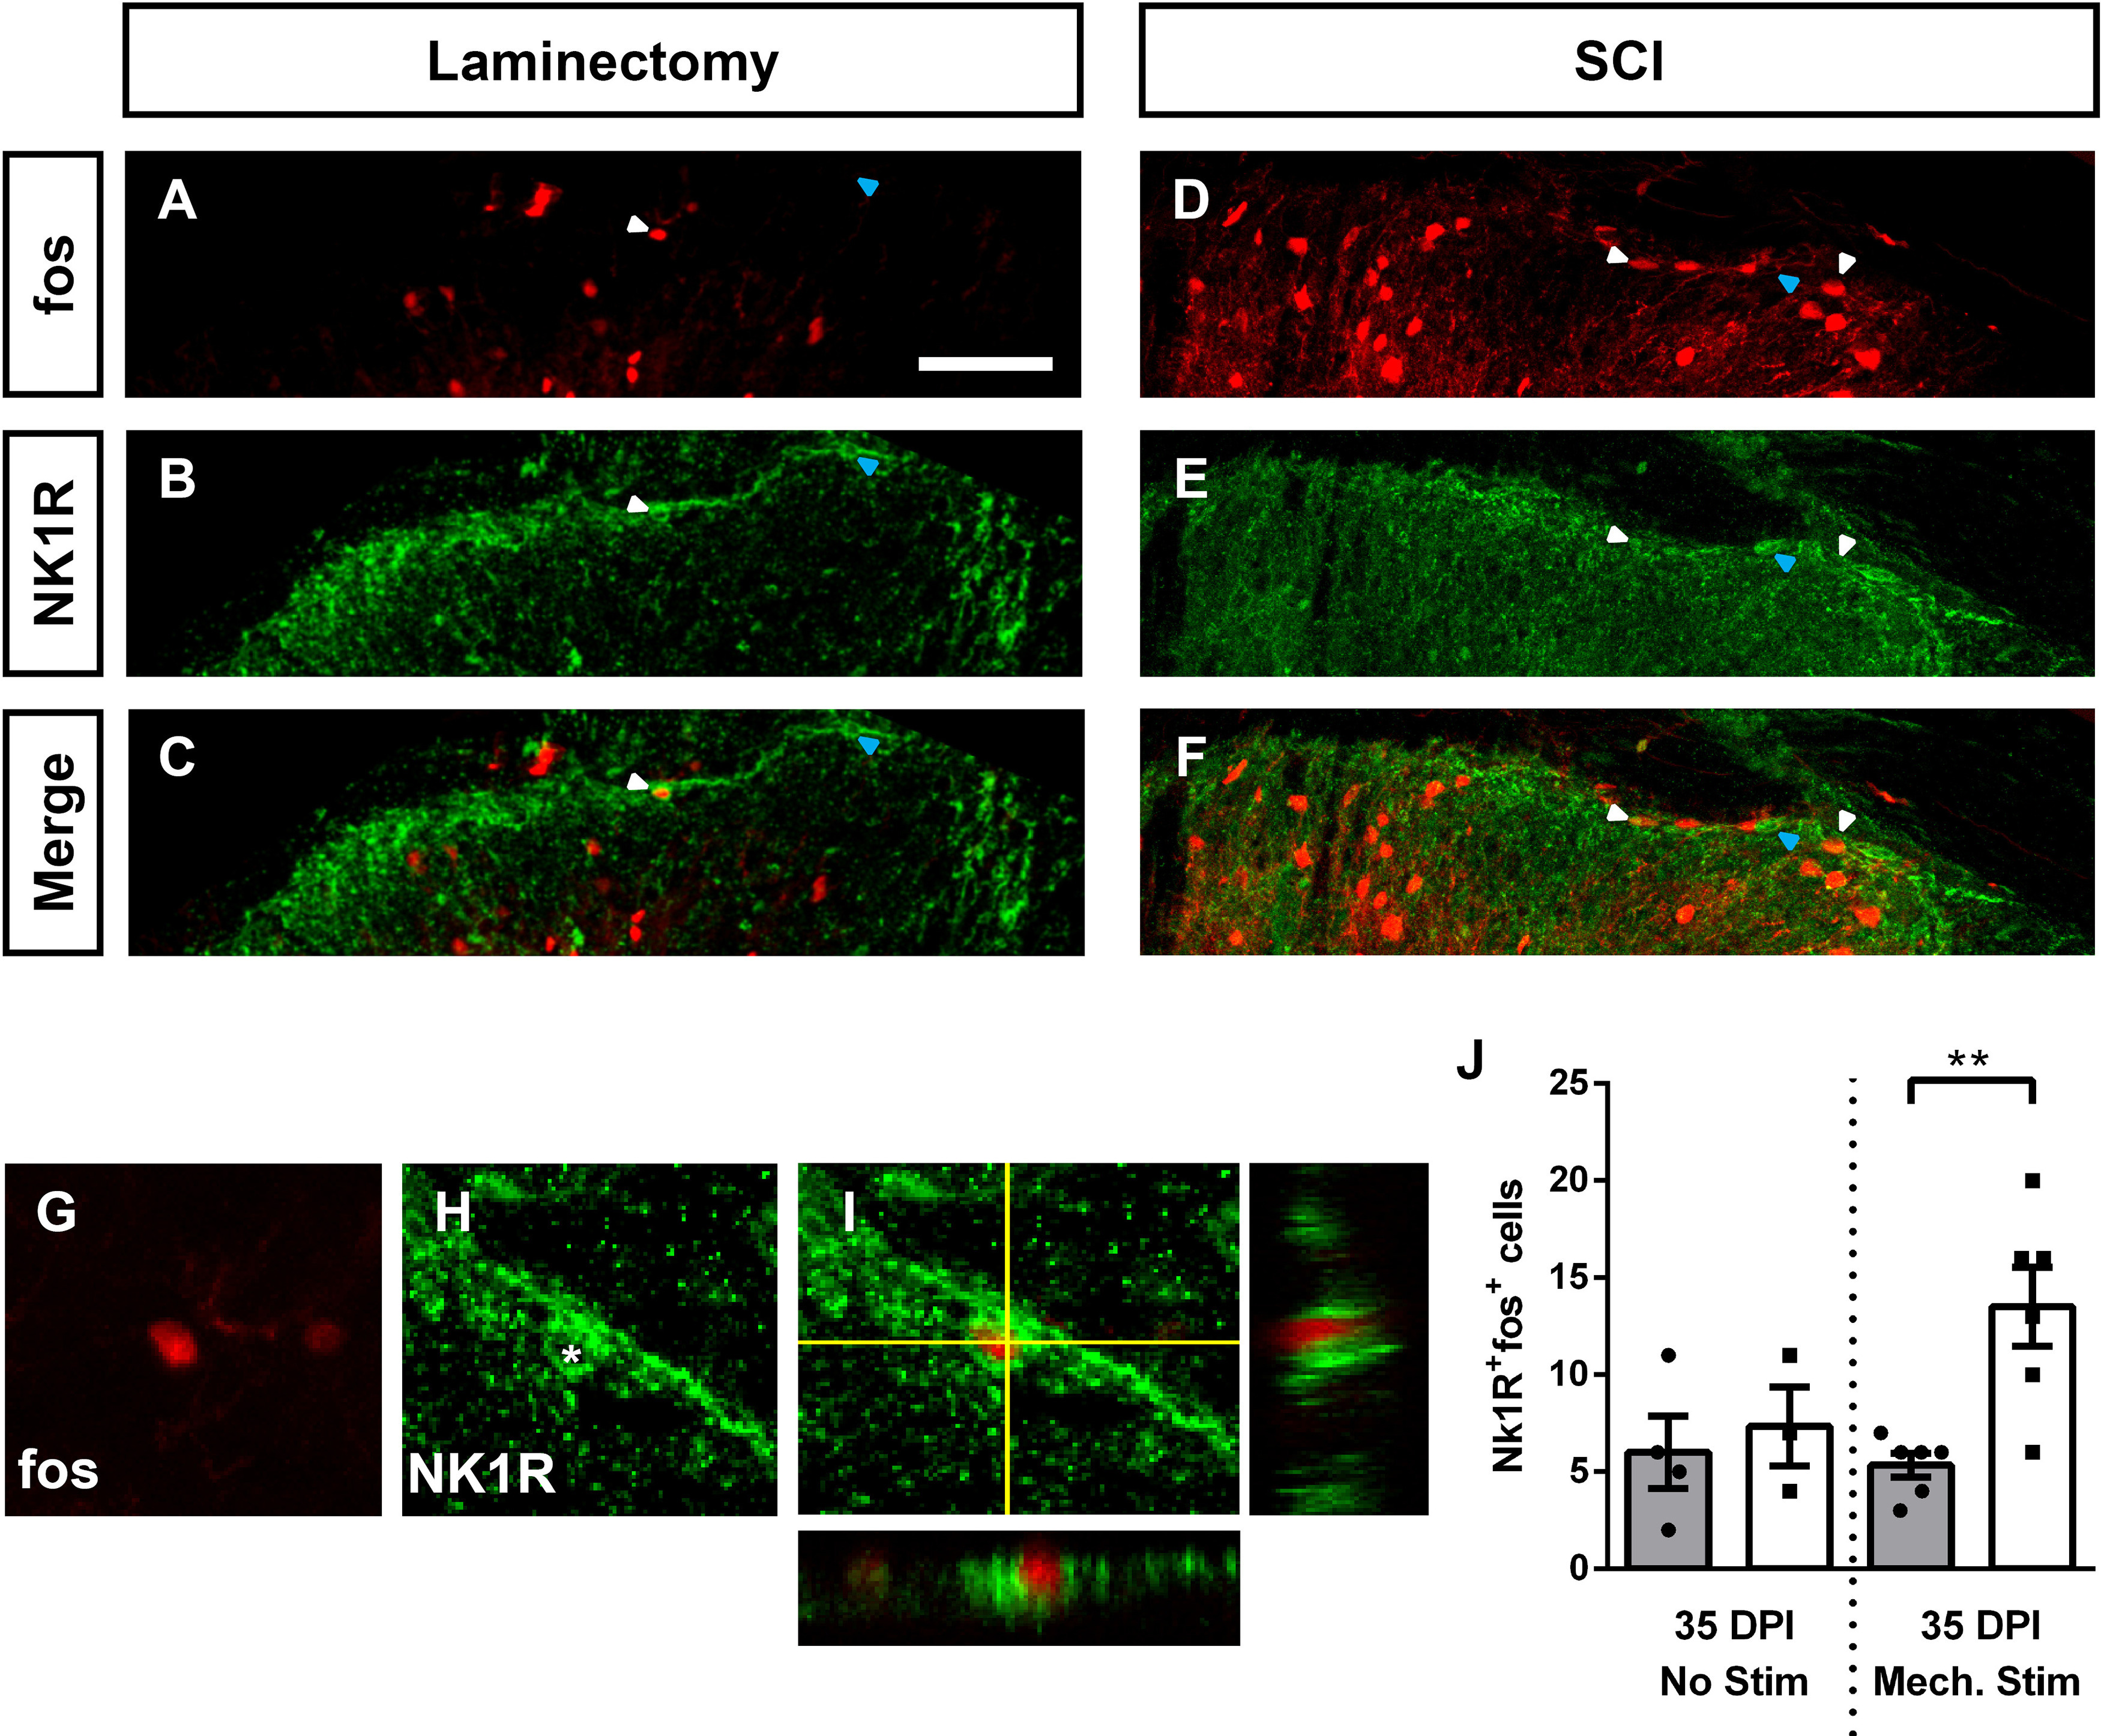
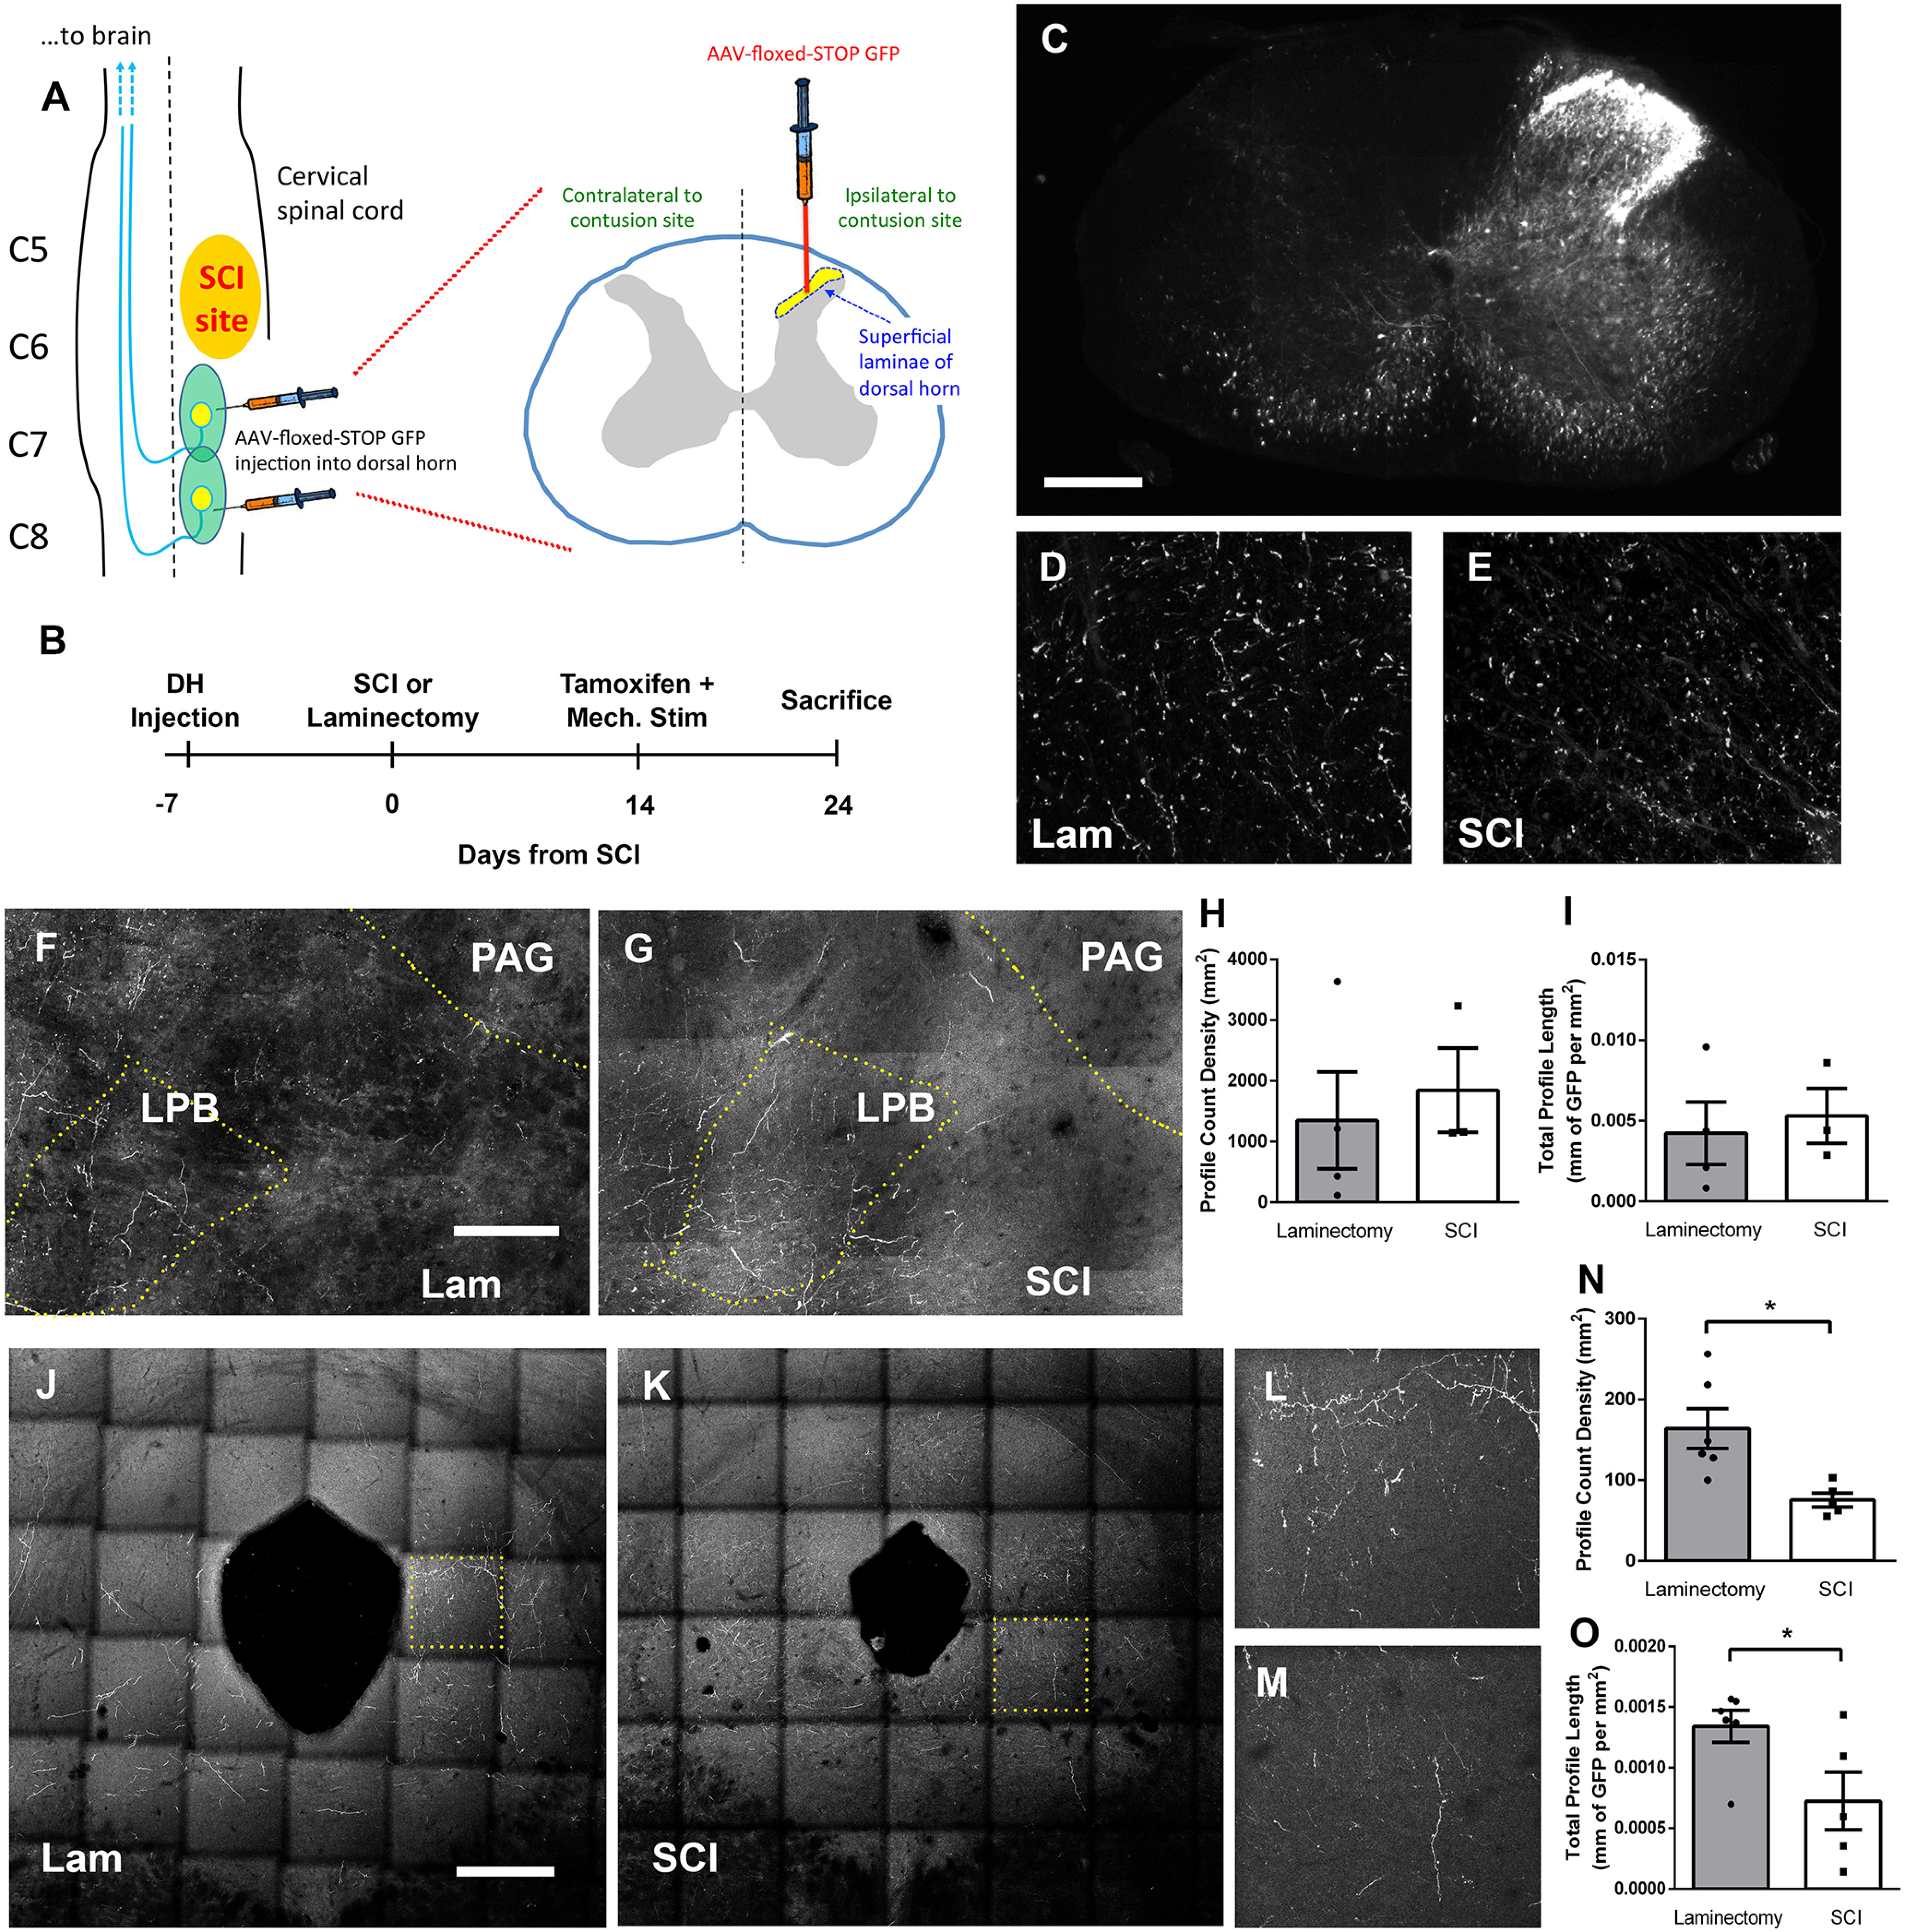
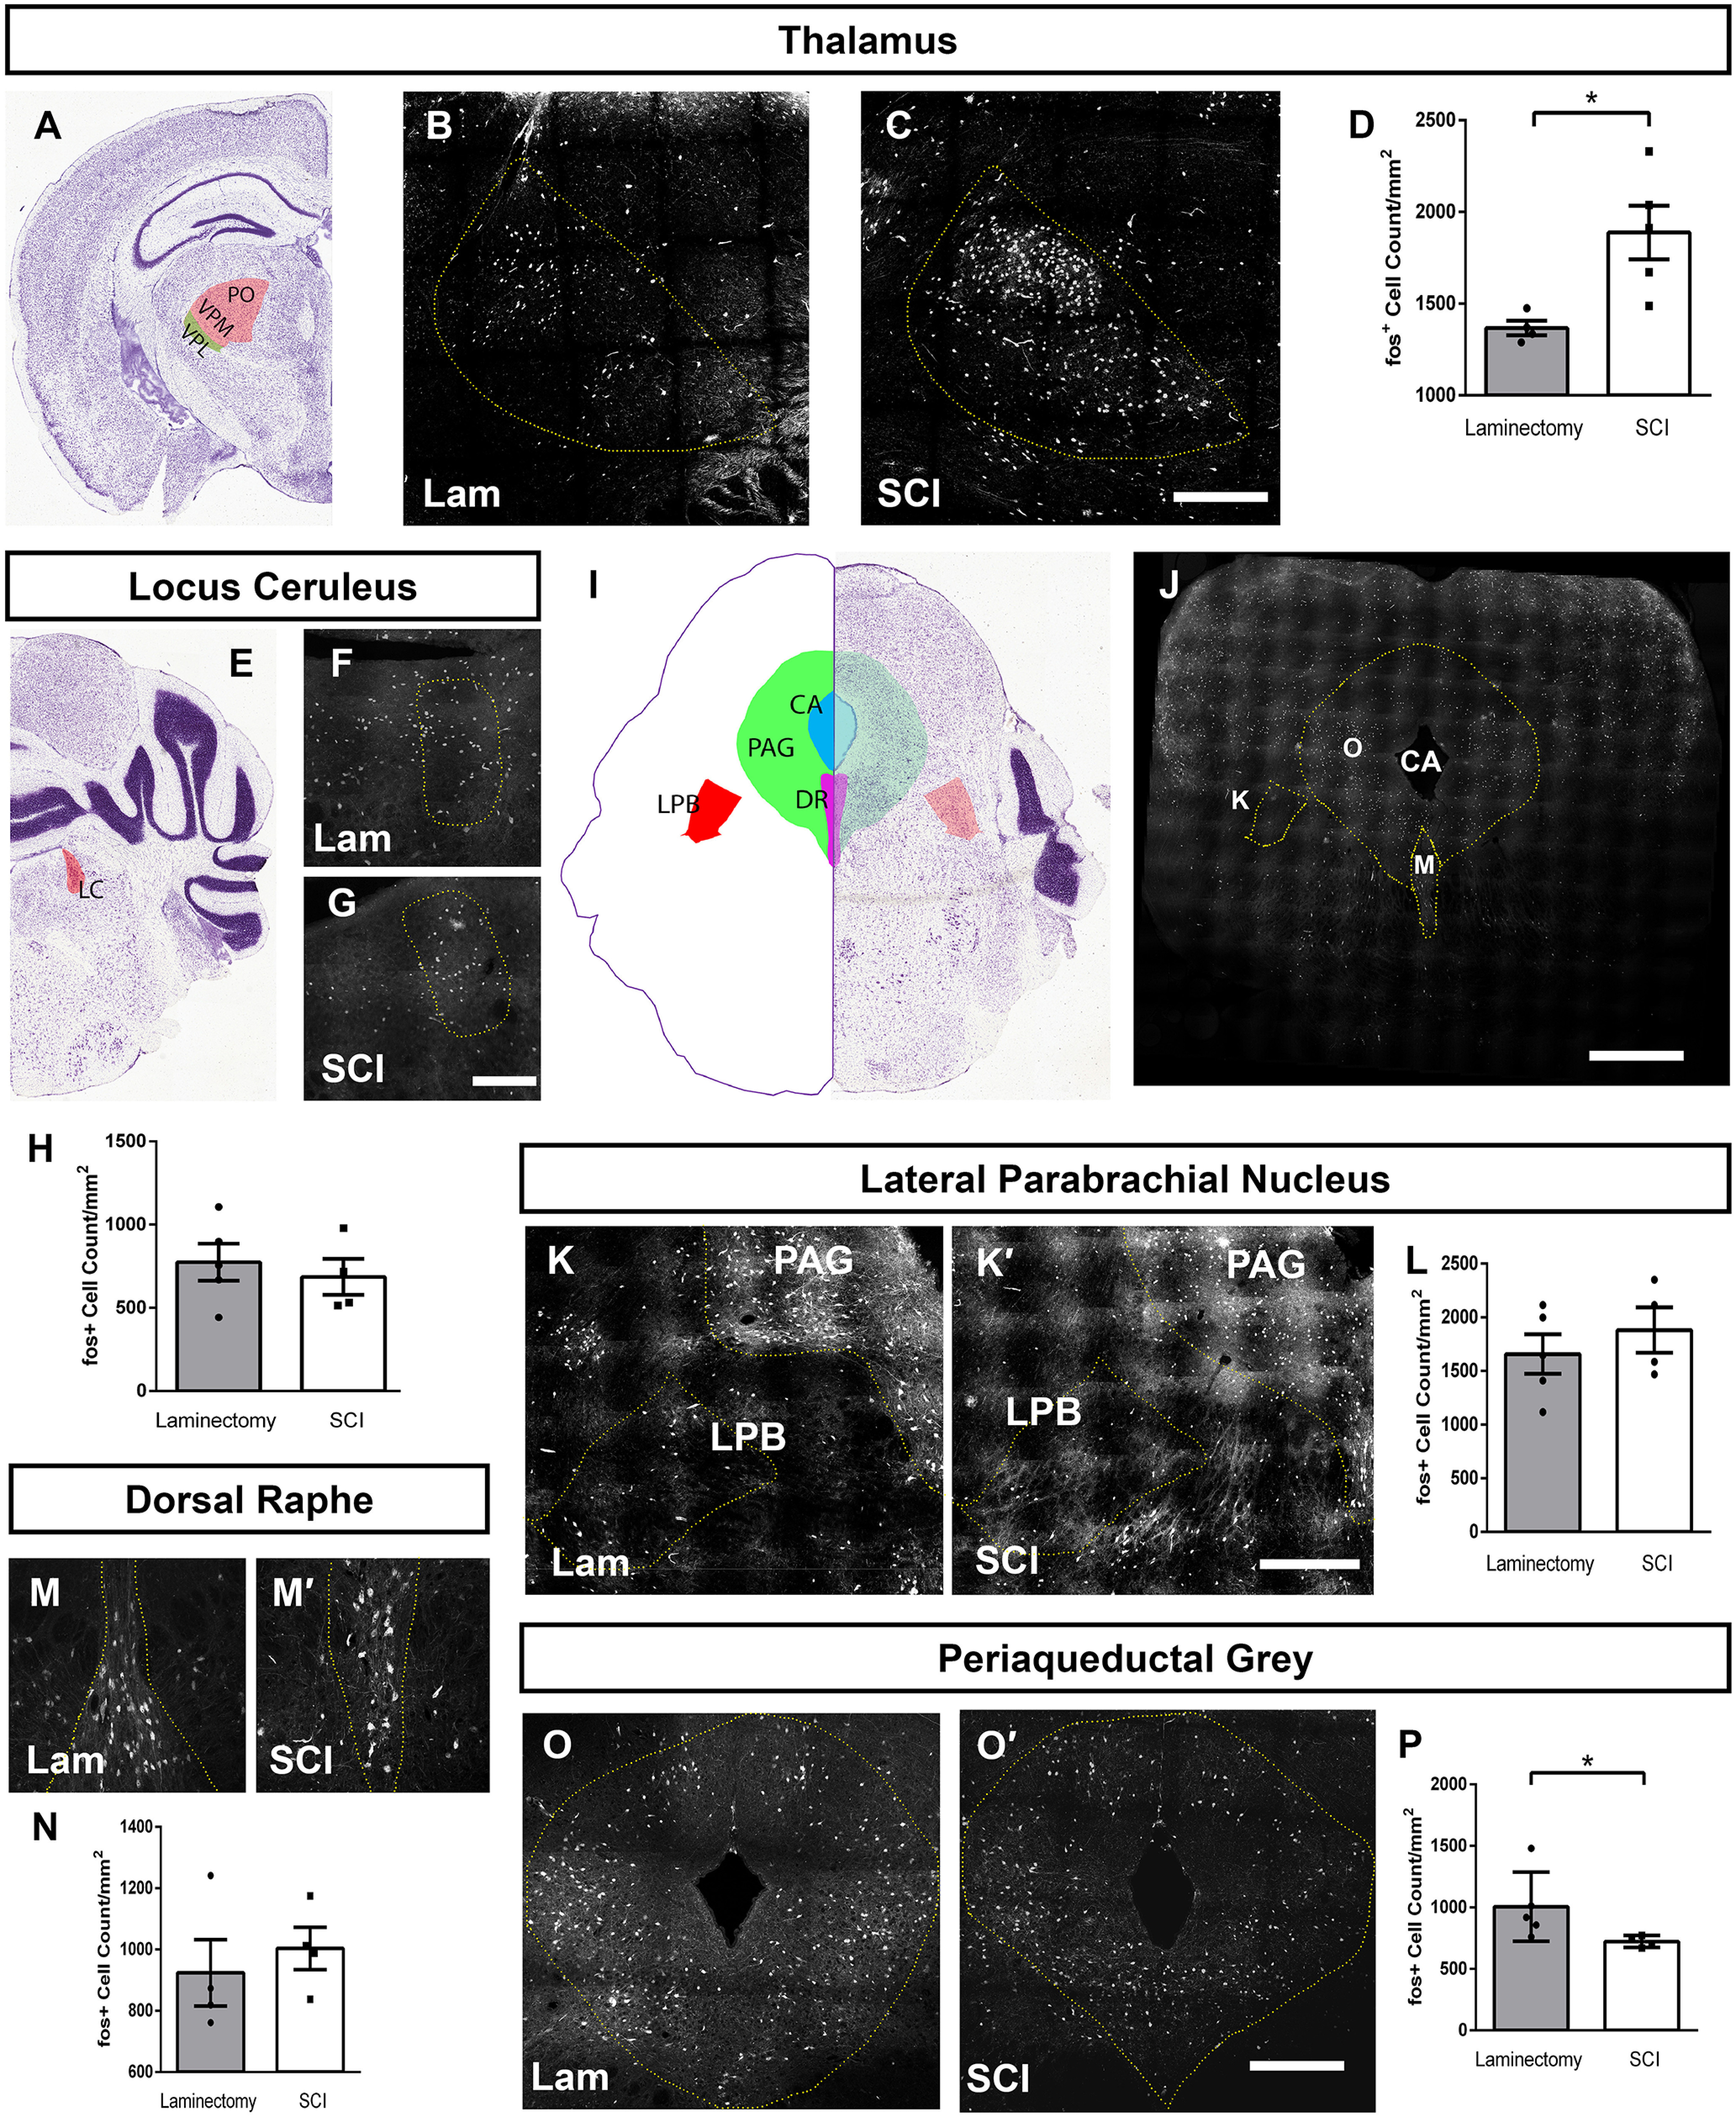
Neuropathic pain (NP) is one of the most common and debilitating comorbidities of spinal cord injury (SCI). Current therapies are often ineffective due in part to an incomplete understanding of underlying pathogenic mechanisms. In particular, it remains unclear how SCI leads to dysfunction in the excitability of nociceptive circuitry. The immediate early gene c-Fos has long been used in pain processing locations as a marker of neuronal activation. We employed a mouse reporter line with fos-promoter driven Cre-recombinase to define neuronal activity changes in relevant pain circuitry locations following cervical spinal cord level (C)5/6 contusion (using both females and males), a SCI model that results in multiple forms of persistent NP-related behavior. SCI significantly increased activation of cervical dorsal horn (DH) projection neurons, as well as induced a selective reduction in the activation of a specific DH projection neuron subpopulation that innervates the periaqueductal gray (PAG), an important brain region involved in descending inhibitory modulation of DH pain transmission. SCI also increased the activation of both protein kinase C (PKC)γ and calretinin excitatory DH interneuron populations. Interestingly, SCI promoted a significant decrease in the activation selectively of neuronal nitric oxide synthase (nNOS)-expressing inhibitory interneurons of cervical DH. In addition, SCI altered activation of various supraspinal neuron populations associated with pain processing, including a large increase in thalamus and a significant decrease in PAG. These findings reveal a complex and diverse set of SCI-induced neuron activity changes across the pain circuitry neuraxis. Moving forward, these results can be used to inform therapeutic targeting of defined neuronal populations in NP.SIGNIFICANCE STATEMENT Neuropathic pain (NP) is one of the most common and highly debilitating comorbidities of spinal cord injury (SCI). Unfortunately, current therapies are often ineffective due in part to an incomplete understanding of underlying pathogenic mechanisms. In particular, it remains unclear how SCI leads to dysfunction in excitability of nociceptive circuitry. Using a FosTRAP2 reporter mouse line in a model of SCI-induced NP, we show SCI alters activation of a number of important interneuron and projection neuron populations across relevant spinal cord and brain locations of the pain circuitry neuraxis. These data suggest a role for maladaptive plasticity involving specific subpopulations of neurons and circuits in driving SCI-induced chronic pain. Moving forward, these results can be used to inform therapeutic targeting of defined neuronal populations in NP.

Keywords: TRAP; dorsal horn; fos; interneuron; neuropathic pain; spinal cord injury.


Figures

Figure 1.
Figure 1.
Lesion size quantification. Lesion size was quantified via cresyl violet staining. Representative images of intact spinal cord (A), lesion epicenter (B), and damaged spinal cord location caudal to the epicenter (C). Quantification of lesion size (D).
Figure 2.
Figure 2.
Cervical SCI altered DH neuron activation in a lamina-specific manner. Unilateral C5/6 contusion or C5/6 laminectomy-only control was delivered to the right side of FosTRAP2 mice, and TdTomoto+ cell counts were performed in the intact, ipsilateral DH at C7/8. Diagram of injury and site of analysis (A). Activated neurons were quantified at 14 and 35 dpi, in the absence of ipsilateral forepaw stimulation, following mechanical stimulation of the ipsilateral forepaw (at 14 or 35 dpi), or following thermal stimulation of the ipsilateral forepaw (at 35 dpi). Timeline of experiments (B). Representative images of the DH at 14 d (C) and 35 d (D) after laminectomy, and 14 d (E) and 35 d (F) post-SCI. Quantification of Lamina I activated cell counts (G), and Laminae II+III activated cell counts (H). Representative images of DH following ipsilateral forepaw stimulation in laminectomy animals at 14 d (I) and 35 d (J), and contusion animals at 14 d (K) and 35 d (L). Quantification of activated neurons in Lamina I (M) and in Laminae II+III (N). Gray bars in graphs: laminectomy-only; white bars in graphs: cervical contusion. Scale bar: 100 µm.
Figure 3.
Figure 3.
SCI increased the number of c-Fos protein-expressing DH neurons. Immunohistochemistry against c-Fos in the DH 35 d following laminectomy (A) or contusion (B). Quantification of c-Fos+ cells in Lamina I (C), and Laminae II+III (D). SCI-induced Fos expression in ventral horn astrocytes: higher-magnification image of a FosTRAP2 reporter+ astrocyte in ipsilateral C7 ventral horn (E). Representative transverse section of C7 spinal cord following laminectomy (F) or contusion (G). Scale bar: 300 µm (F, G).
Figure 4.
Figure 4.
SCI increased activation of excitatory DH interneurons. Cervical SCI increased the activation of calretinin+ DH interneurons following mechanical stimulation of ipsilateral forepaw. Representative DH images of animals that received stimulation 35 d after laminectomy: TdTomato reporter expression (A), calretinin expression (B), and merged (C). Representative DH images of mechanically stimulated animals at 35 d after SCI: reporter expression (D), calretinin (E), and merged (F). High-magnification orthogonal projection of a TdTomato expressing calretinin+ cell (G). Quantification of activated calretinin+ neurons (H). SCI increased the activation of PKCγ+ excitatory interneurons both with and without mechanical forepaw stimulation. Representative DH images of mechanically stimulated animals 35 d after laminectomy: TdTomato (I), PKCγ (J), merge (K); and mechanically stimulated animals 35 d post-SCI: TdTomato (L), PKCγ (M), merge (N). High-magnification orthogonal projection of an activated PKCγ+ interneuron (O). Quantification in P. Gray bars in graphs: laminectomy-only; white bars in graphs: cervical contusion. White arrowheads indicate co-labeled cells. Scale bar: 100 µm.
Figure 5.
Figure 5.
SCI decreased activation of Laminae II/III inhibitory interneurons. SCI alone decreased the activation of Laminae II/III inhibitory interneurons. Representative images of DH without stimulation 35 d following laminectomy: TdTomato (A), Pax2 (B), and merge (C), and following SCI: TdTomato (D), Pax2 (E), and merge (F). Quantification of SCI-induced activation of Laminae II+III Pax2+ inhibitory interneurons in the absence of stimulation (G). Representative DH images following mechanical stimulation at 35 d after laminectomy: TdTomato (H), Pax2 (I), and merge (J), and 35 d post-SCI: TdTomato (K), Pax2 (L), and merge (M). Quantification of mechanical stimulation induced Pax2+ inhibitory interneuron activation (N). Representative images of cells triple-labeled for: TdTomato, Pax2, and interneuron subtype-specific marker: parvalbumin (O), NPY (P), and nNOS (Q). Quantification of marker+Pax2+TdTomato+ triple-labeled cells 35 d after injury with mechanical stimulation (R). Gray bars in graphs: laminectomy-only; white bars in graphs: cervical contusion. White arrowheads indicate double-labeled (in panels A–F and H–M) or triple-labeled (in panels O–Q) cells; blue arrowheads indicate TdTomato+ Pax2- subtype marker+ cells. Scale bars: 100 µm (A) and 15 µm (O).
Figure 6.
Figure 6.
Interneuron numbers were not altered by SCI in the ipsilateral DH caudal to injury. Numbers of neurons expressing Pax2 (A), PKCγ (B) or calretinin (C) were quantified 35 d after laminectomy (white bars) or SCI (gray bars). No significant differences in any population were observed between SCI and laminectomy-only conditions (t test, p > 0.05).
Figure 7.
Figure 7.
DH neuron activation changes induced by thermal stimulation. Representative DH images 35 d postsurgery following thermal stimulation of the ipsilateral forepaw in laminectomy: TdTomato (A), calretinin (B), and merge (C), and contusion: TdTomato (D), calretinin (E), and merge (F). Quantification of thermal stimulation induced activation of Lamina I cells (G), Laminae II+III cells (H), activated calretinin+ cells (I), and activated Laminae II+III Pax2+ inhibitory neurons (J). Representative ipsilateral DH images 35 d postsurgery following thermal stimulation in the ipsilateral forepaw in laminectomy: TdTomato (K), Pax2 (L), and merge (M), and contusion: TdTomato (N), Pax2 (O), and merge (P). White arrowheads indicate double-labeled cells. Scale bar: 100 µm.
Figure 8.
Figure 8.
Cervical SCI did not alter DH neuron activation in lumbar spinal cord. Representative DH images from L4/L5 spinal cord 35 d after laminectomy: TdTomato (A), Pax2 (B), merge (C), 35 d postcontusion: TdTomato (D), Pax2 (E), merge (F). Quantification of the number of TdTomato+ (activated) cells per superficial DH section (G), and of Tdtomato+Pax2+ cells per superficial DH (H). High-magnification representative images of TdTomato+nNOS+Pax2+ triple-labeled cells: TdTomato (I), Pax2 (J), nNOS (K), merge (L). Quantification of triple-labeled cells (M). Gray bars in graphs: laminectomy-only; white bars in graphs: cervical contusion. White arrowheads indicate double-labeled cells (in panels A–F); yellow arrowheads indicate triple-labeled cells (in panels I–L). Scale bar: 100 µm.
Figure 9.
Figure 9.
SCI increased activation of DH projection neurons. Representative images of activated Lamina I DH projection neurons following mechanical stimulation at 35 d after laminectomy: TdTomato (A), NK1R (B), merge (C); at 35 d postcontusion: TdTomato (D), NK1R (E), merge (F). Representative high-magnification orthogonal projection of an activated NK1R+ cell: TdTomato (G), NK1R (H), merge (I). Quantification of activated NK1R+ cells in Lamina I (J). White arrowheads indicate co-labeled cells; blue arrowheads indicate NK1R+TdTomato- cells. Gray bars in graphs: laminectomy-only; white bars in graphs: cervical contusion. Scale bar: 70 μm.
Figure 10.
Figure 10.
SCI altered activation of DH projection neuron subpopulations. Diagram of intraspinal viral injection experimental paradigm to selectively target ipsilateral DH (A). Experimental timeline (B). Representative transverse cervical spinal cord section of AAV1-flex-GFP virus injection 10 d post-tamoxifen administration; scale bar: 250 µm (C). Representative transverse cervical spinal cord images of FosTRAP2-labeled axons in the contralateral ALT, rostral to the injury site at 10 d post-tamoxifen induction in laminectomy (D) or SCI (E) animals. Representative coronal images of the LPB following laminectomy (F) or SCI (G); scale bar: 150 µm. LPB quantification of GFP+ axon profile counts (H) and total GFP+ axon length (I). Representative coronal images of the PAG following laminectomy (J) or SCI (K); scale bar 375 µm. Higher-magnification insets showing GFP+ axon fibers in the PAG following laminectomy (L) or contusion (M). PAG quantification of GFP+ axon profile counts (N) and total GFP+ axon length (O).
Figure 11.
Figure 11.
SCI altered neuron activation in pain processing brain regions. Diagram of the location of thalamus quantification (A). Representative coronal images of thalamus 35 d after laminectomy (B) or contusion (C) with mechanical stimulation; scale bar: 350 µm. Quantification of activated cells in thalamus (D). Diagram of the location of LC quantification (E). Representative coronal LC images following laminectomy (F) or contusion (G); scale Bar: 150 µm. Quantification of activated LC cells (H). Diagram of brainstem cross-section showing locations for quantification of PAG, LPB, and DR. Low magnification of TRAP2 mouse brainstem in cross-section corresponding to diagram in panel I (J); scale bar: 400 µm. Representative coronal images of LPB and PAG following laminectomy (K) or contusion (K'). Quantification of activated cell counts in LPB (L). Representative coronal images of activated cells in DR following laminectomy (M) or contusion (M'); scale bar: 350 µm. Quantification of activated DR neurons (N). Representative coronal images of activated cells in PAG following laminectomy (O) or contusion (O'); scale bar: 250 µm. Quantification of activated cell counts in PAG (P). Image credit for coronal brain images (A,E,I): Allen Institute (2004).

References

    1. Acton D, Ren X, Costanzo SD, Dalet A, Bourane S, Bertocchi I, Eva C, Goulding M (2019) Spinal neuropeptide Y1 receptor-expressing neurons form an essential excitatory pathway for mechanical itch. Cell Rep 28:625–639.e6. 10.1016/j.celrep.2019.06.033 - DOI - PMC - PubMed
    1. Al-Khater KM, Todd AJ (2009) Collateral projections of neurons in laminae I, III, and IV of rat spinal cord to thalamus, periaqueductal gray matter, and lateral parabrachial area. J Comp Neurol 515:629–646. 10.1002/cne.22081 - DOI - PMC - PubMed
    1. Allen Institute (2004) Allen mouse brain atlas. Available at https://mouse.brain-map.org/static/atlas.
    1. Bernardi PS, Valtschanoff JG, Weinberg RJ, Schmidt HH, Rustioni A (1995) Synaptic interactions between primary afferent terminals and GABA and nitric oxide-synthesizing neurons in superficial laminae of the rat spinal cord. J Neurosci 15:1363–1371. 10.1523/JNEUROSCI.15-02-01363.1995 - DOI - PMC - PubMed
    1. Brown EV, Falnikar A, Heinsinger N, Cheng L, Andrews CE, DeMarco M, Lepore AC (2021) Cervical spinal cord injury-induced neuropathic pain in male mice is associated with a persistent pro-inflammatory macrophage/microglial response in the superficial dorsal horn. Exp Neurol 343:113757. 10.1016/j.expneurol.2021.113757 - DOI - PMC - PubMed

Publication types