. 2022 Feb 28;31(1):42-53.
doi: 10.5607/en21032.

Interleukin 13 on Microglia is Neurotoxic in Lipopolysaccharide-injected Striatum in vivo

Affiliations

Interleukin 13 on Microglia is Neurotoxic in Lipopolysaccharide-injected Striatum in vivo

Ah Reum Hong et al. Exp Neurobiol. .

Abstract

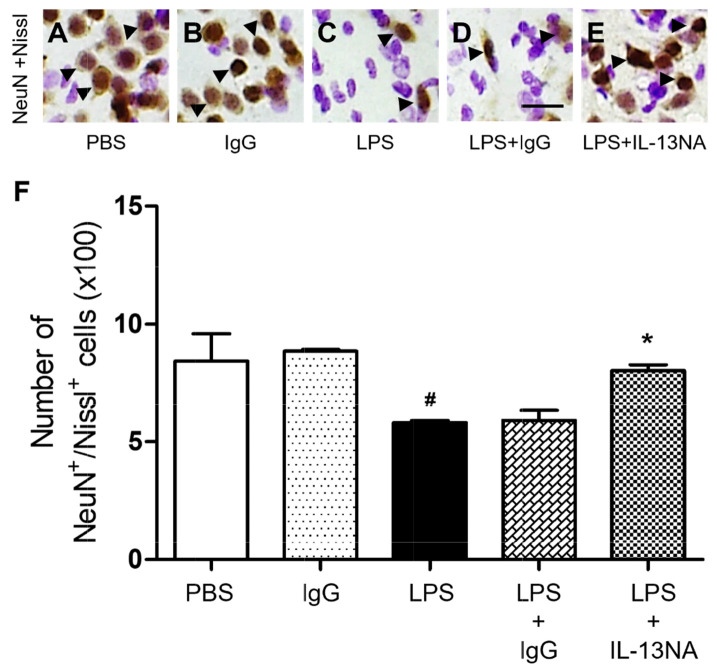
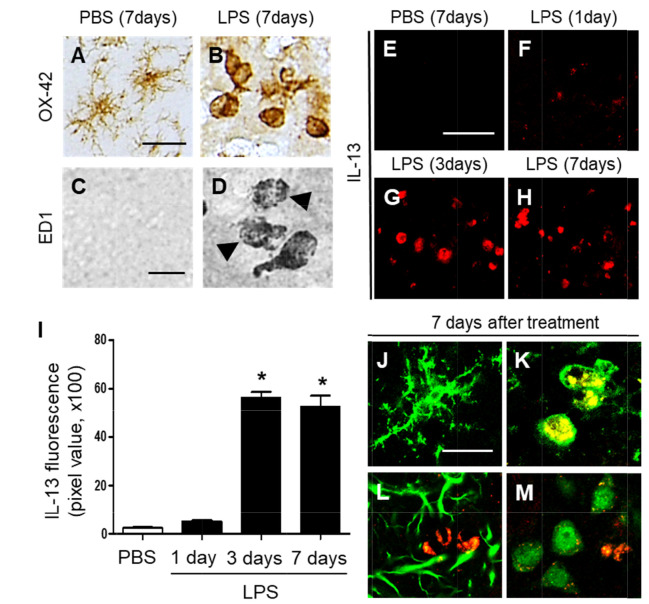
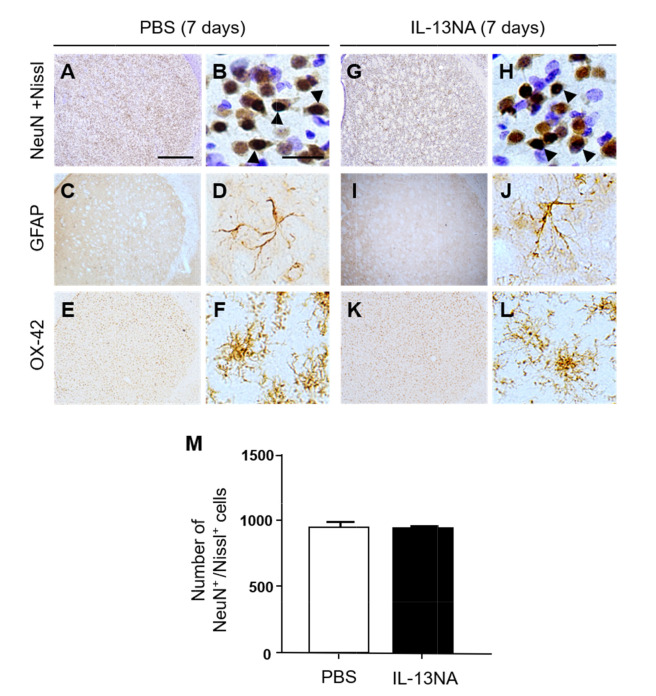
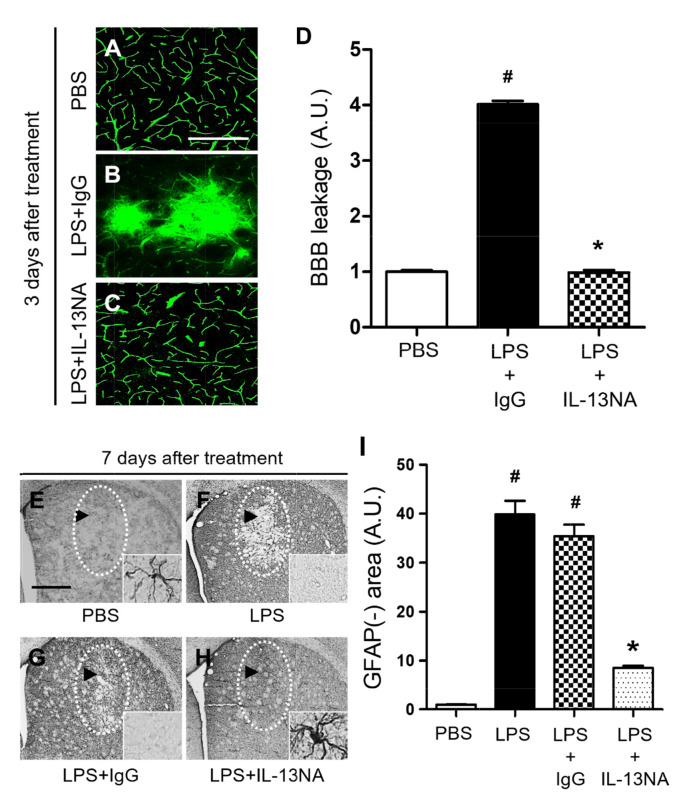
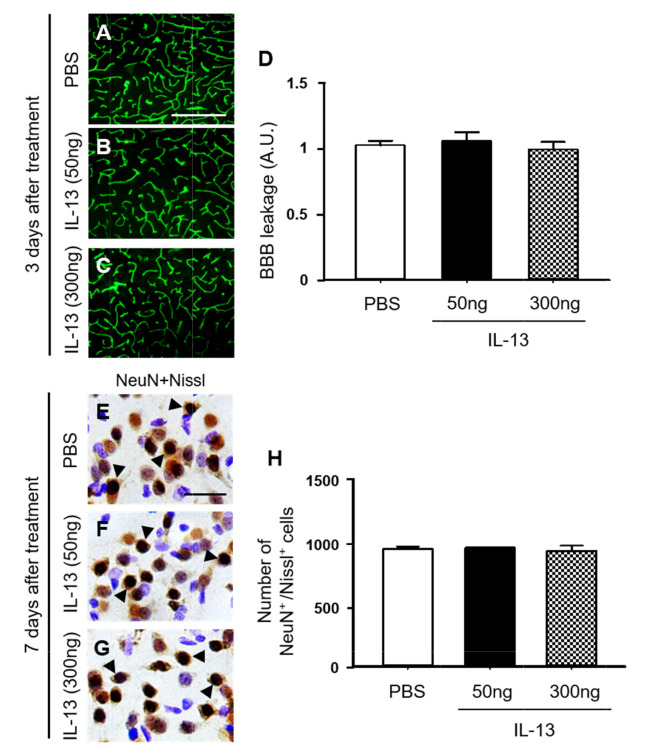
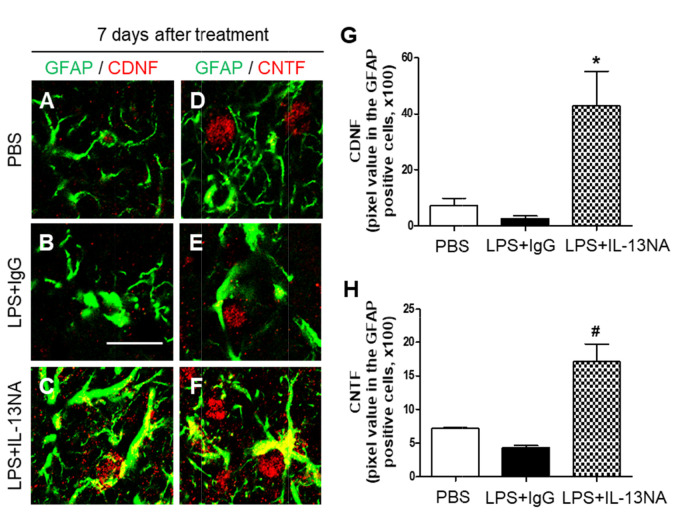
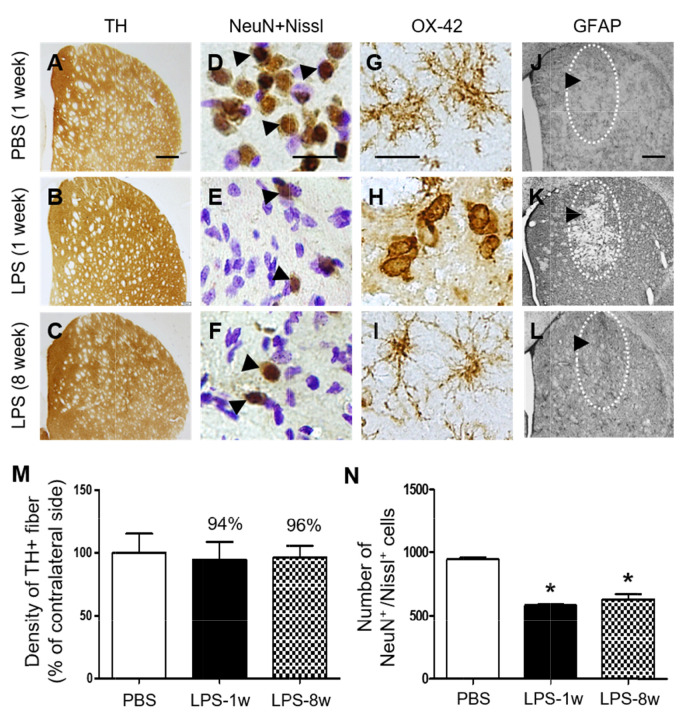
To explore the potential function of interleukin-13 (IL-13), lipopolysaccharide (LPS) or PBS as a control was unilaterally microinjected into striatum of rat brain. Seven days after LPS injection, there was a significant loss of neurons and microglial activation in the striatum, visualized by immunohistochemical staining against neuronal nuclei (NeuN) and the OX-42 (complement receptor type 3, CR3), respectively. In parallel, IL-13 immunoreactivity was increased as early as 3 days and sustained up to 7 days post LPS injection, compared to PBS-injected control and detected exclusively within microglia. Moreover, GFAP immunostaining and blood brain barrier (BBB) permeability evaluation showed the loss of astrocytes and disruption of BBB, respectively. By contrast, treatment with IL-13 neutralizing antibody (IL-13NA) protects NeuN+ neurons against LPS-induced neurotoxicity in vivo . Accompanying neuroprotection, IL-13NA reduced loss of GFAP+ astrocytes and damage of BBB in LPS-injected striatum. Intriguingly, treatment with IL-13NA produced neurotrophic factors (NTFs) on survived astrocytes in LPS-injected rat striatum. Taken together, the present study suggests that LPS induces expression of IL-13 on microglia, which contributes to neurodegeneration via damage on astrocytes and BBB disruption in the striatum in vivo.

Keywords: Astrocytes; Interleukin 13; Microglia; Neurodegeneration; Neurotrophic factor; Striatum.


Conflict of interest statement

CONFLICT OF INTEREST

The authors declare no conflict of interest.

Figures

Fig. 1
Fig. 1
Interleukin-13 contributes to neurodegeneration of LPS-injected rat striatum in vivo. Animals unilaterally received intrastriatal injection of PBS (A, 3 µl) or non-specific IgG (IgG) only (B, 1 µg) as a control, LPS (C, 5 µg), LPS+IgG (D, 1 µg) and LPS+Interleukin 13 neutralizing antibody (IL-13NA) (E, 1 µg). (A~E) At 7 days after LPS injection, animals were sacrificed, and the coronal sections (40 µm) were selected and processed for neuronal nuclei (NeuN) immunohistochemical staining and Nissl staining. Arrowheads indicate NeuN+ cells merged with Nissl+ cells (NeuN+/Nissl+). (F) Number of NeuN+/Nissl+ cells in the striatum at 7 days after LPS injection. #p<0.001, as compared with PBS, *p<0.001, as compared with LPS+IgG. One-way ANOVA and Newman–Keuls analyses. Four to eleven animals were used for each experimental group. The results represent mean±SEM. Scale bar, (A~E) 25 µm.
Fig. 2
Fig. 2
Interleukin-13 expression in the striatum of LPS-injected rat in vivo. (A~D) Striatal sections (A, C, PBS; B, D, LPS) adjacent to those used in Fig. 1A and C were immunostained with OX-42 (A, B) and ED1 (C, D) antibodies for microglia. Accumulating intracellular vacuoles are denoted by arrowheads in D. (E~H) IL-13 immunofluorescence staining in the striatum at 7 days after intrastriatal injection of PBS as a control (E), and at 1 day (F), 3 days (G), or 7 days (H) after intrastriatal injection of LPS. (I) Quantification of IL-13 expression in OX-42+ cells in the striatum at indicated time points. *p<0.001, as compared with PBS. One-way ANOVA and Newman–Keuls analyses. Seven animals were used for each experimental group. The results represent mean ± SEM. (J~M) Immunofluorescence images of interleukin 13 (IL-13, K; red) and OX-42 (J, K; green), or IL-13 (L; red) and GFAP (L; green), or IL-13 (M; red) and NeuN (M; green) and both images are merged (Yellow; K) in the striatum at 7 days after PBS (J) or LPS (K~M) injection. Scale bars, (A, B) 25 µm; (C, D) 20 µm; (E~H) 50 µm; (J~M) 20 µm.
Fig. 3
Fig. 3
Interleukin-13 neutralizing antibody has no effects on neurotoxicity and inflammation in rat striatum in vivo. Animals unilaterally received intrastriatal injection of PBS (A~F, 3 µl) or Interleukin 13 neutralizing antibody (IL-13NA, 1 µg; G~L) as a control. 7 days later, animals were sacrificed, and the coronal sections (40 µm) were selected and processed for immunostaining with neuronal nuclei (NeuN) and Nissl staining (A, B, G, H), GFAP (C, D, I, J) and OX-42 (E, F, K, L). Arrowheads indicate NeuN+ cells merged with Nissl+ cells (NeuN+/Nissl+). (M) Number of NeuN+/Nissl+ cells in the striatum at 7 days after injection. Three animals were used for each experimental group. The results represent mean±SEM. Scale bar, (A, C, E, G, I, K) 100 µm; (B, D, F, H, J, L) 25 µm.
Fig. 4
Fig. 4
Interleukin-13 contributes to disruption of BBB and loss of astrocytes and in LPS-injected rat striatum in vivo. (A~C) Animals unilaterally received intrastriatal injection of PBS as a control (A) or LPS+IgG (B) or IL-13NA (C). 3 days later, FITC-labeled albumin was administered to detect focal leakage of the BBB. (D) Quantification of BBB leakage density. #p<0.001, as compared with PBS, *p<0.001, as compared with LPS+IgG. One-way ANOVA and Newman–Keuls analyses. Three to four animals were used for each experimental group. The results represent mean±SEM. (E~H) Animals unilaterally received intrastriatal injection of PBS as a control (E) or LPS only (F) or LPS+IgG (G) or LPS+IL-13NA (H). 3 days later, striatal tissues were immunostained with anti-GFAP antibody for astrocyte. Dotted round indicates area lacking in GFAP+ astrocytes. Arrow indicates syringe track. (I) Quantification of GFAP immunonegative (GFAP-) area at 7 days after LPS injection. #p<0.001, as compared with PBS, *p<0.001, as compared with LPS+IgG. One-way ANOVA and Newman–Keuls analyses. Four animals were used for each experimental group. The results represent mean±SEM. Scale bars, (A~C) 500 µm; (E~H) 100 µm.
Fig. 5
Fig. 5
Interleukin-13 has no effects on BBB damage and neurotoxicity in rat striatum in vivo. (A~C) Animals unilaterally received intrastriatal injection of PBS as a control (A) or IL-13 (B, 50 ng) or IL-13 (C, 300 ng). 3 days later, FITC-labeled albumin was administered to detect focal leakage of the BBB. (D) Quantification of BBB leakage density. Three to four animals were used for each experimental group. The results represent mean±SEM. Scale bars, (A~C) 500 µm. (E~H) Animals unilaterally received intrastriatal injection of PBS as a control (E) or IL-13 (F, 50 ng), IL-13 (G, 300 ng). 7 days later, striatal tissues were selected and processed for immunostaining with neuronal nuclei (NeuN) and Nissl staining (E~G). Arrowheads indicate NeuN+ cells merged with Nissl+ cells (NeuN+/Nissl+). (H) Number of NeuN+/Nissl+ cells in the striatum at 7 days after injection. Three animals were used for each experimental group. The results represent mean±SEM. Scale bar, (A~C) 500 µm; (E~G) 25 µm.
Fig. 6
Fig. 6
Interleukin-13 inhibits expression of neurotrophic factors on astrocytes in LPS-injected rat striatum in vivo. Sections (A, D, PBS; B, E, LPS+IgG; C, F, LPS+IL-13NA) adjacent to those used in Figure 3 were immunostained with GFAP (A~F) antibody for astrocytes, and cerebral dopamine neurotrophic factor (CDNF: A~C) or ciliary neurotrophic factor (CNTF: D~F) antibodies. (A~C) Immunofluorescence images of GFAP (green) and CDNF (red), and both images are merged (Yellow) in the striatum at 7 days after LPS+IgG injection. (D~F) Immunofluorescence images of GFAP (green) and CNTF (red), and both images are merged (Yellow) in the striatum at 7 days after LPS+IgG injection. (G) Quantification of CDNF expression in GFAP+ cells in the striatum at 7 days after LPS injection. *p<0.05, as compared with LPS+IgG. One-way ANOVA and Newman–Keuls analyses. Three animals were used for each experimental group. The results represent mean±SEM. (H) Quantification of CNTF expression in GFAP+ cells in the striatum at 7 days after LPS+IgG injection. #p<0.01, as compared with LPS+IgG. One-way ANOVA and Newman–Keuls analyses. Three animals were used for each experimental group. The results represent mean±SEM. Scale bar, (A~F) 20 µm.
Fig. 7
Fig. 7
Temporal effects of LPS on dopamine fibers and inflammation in the striatum in vivo. Animals unilaterally received intrastriatal injection of PBS (A, D, G, J, 3 μl) as a control and LPS (B, C, E, F, H, I, K, L, 5 μg/3 μl). (A~C) At 1 week after LPS injection, animals were sacrificed and the coronal sections (40 μm) were selected and processed for tyrosine hydroxylase (TH) immunohistochemical staining, (D~F) neuronal nuclei (NeuN) immunohistochemical staining and Nissl staining, (G~I) OX-42 immunohistochemical staining (insert images are ED1 Immunohistochemical staining) and (J~L) GFAP immunohistochemical staining. (D~F) Arrowheads indicate NeuN+ cells merged with Nissl+ cells (NeuN+/Nissl+). (J~L) Dotted round indicates area lacking in GFAP+ astrocytes. Arrow indicates syringe track. (M) Density of TH+ fibers in the striatum at 1 week after intrastriatal injection of PBS as a control (A) or at 1 week (B) and 8 weeks (C) after intrastriatal injection of LPS. Density of striatal TH+ fibers was not significantly affected by LPS in rat striatum. One-way ANOVA and Newman–Keuls analyses. Three animals were used for each experimental group. The results represent mean±SEM. (N) Number of NeuN+/Nissl+ cells in the striatum at 1 week after intrastriatal injection of PBS as a control (D) or at 1 week (E) and 8 weeks (F) after intrastriatal injection of LPS. *p<0.001, as compared with PBS. One-way ANOVA and Newman–Keuls analyses. Four to five animals were used for each experimental group. The results represent mean±SEM. Scale bar, (A~C) 500 µm; (D~I) 20 µm; (J~L) 500 µm.

Similar articles

Cited by

References

    1. Leng F, Edison P. Neuroinflammation and microglial activation in Alzheimer disease: where do we go from here? Nat Rev Neurol. 2021;17:157–172. doi: 10.1038/s41582-020-00435-y. - DOI - PubMed
    1. Chung YC, Ko HW, Bok E, Park ES, Huh SH, Nam JH, Jin BK. The role of neuroinflammation on the pathogenesis of Parkinson's disease. BMB Rep. 2010;43:225–232. doi: 10.5483/BMBRep.2010.43.4.225. - DOI - PubMed
    1. Deng I, Corrigan F, Zhai G, Zhou XF, Bobrovskaya L. Lipopolysaccharide animal models of Parkinson's disease: recent progress and relevance to clinical disease. Brain Behav Immun Health. 2020;4:100060. doi: 10.1016/j.bbih.2020.100060. - DOI - PMC - PubMed
    1. Jeong JY, Wi R, Chung YC, Jin BK. Interleukin-13 propagates prothrombin kringle-2-induced neurotoxicity in hippocampi in vivo via oxidative stress. Int J Mol Sci. 2021;22:3486. doi: 10.3390/ijms22073486. - DOI - PMC - PubMed
    1. Nam JH, Park ES, Won SY, Lee YA, Kim KI, Jeong JY, Baek JY, Cho EJ, Jin M, Chung YC, Lee BD, Kim SH, Kim EG, Byun K, Lee B, Woo DH, Lee CJ, Kim SR, Bok E, Kim YS, Ahn TB, Ko HW, Brahmachari S, Pletinkova O, Troconso JC, Dawson VL, Dawson TM, Jin BK. TRPV1 on astrocytes rescues nigral dopamine neurons in Parkinson's disease via CNTF. Brain. 2015;138(Pt 12):3610–3622. doi: 10.1093/brain/awv297. - DOI - PMC - PubMed