. 2022 Mar 7;13(3):216.
doi: 10.1038/s41419-022-04661-8.

Reducing N6AMT1-mediated 6mA DNA modification promotes breast tumor progression via transcriptional repressing cell cycle inhibitors

Affiliations

Reducing N6AMT1-mediated 6mA DNA modification promotes breast tumor progression via transcriptional repressing cell cycle inhibitors

Jiongyu Chen et al. Cell Death Dis. .

Abstract

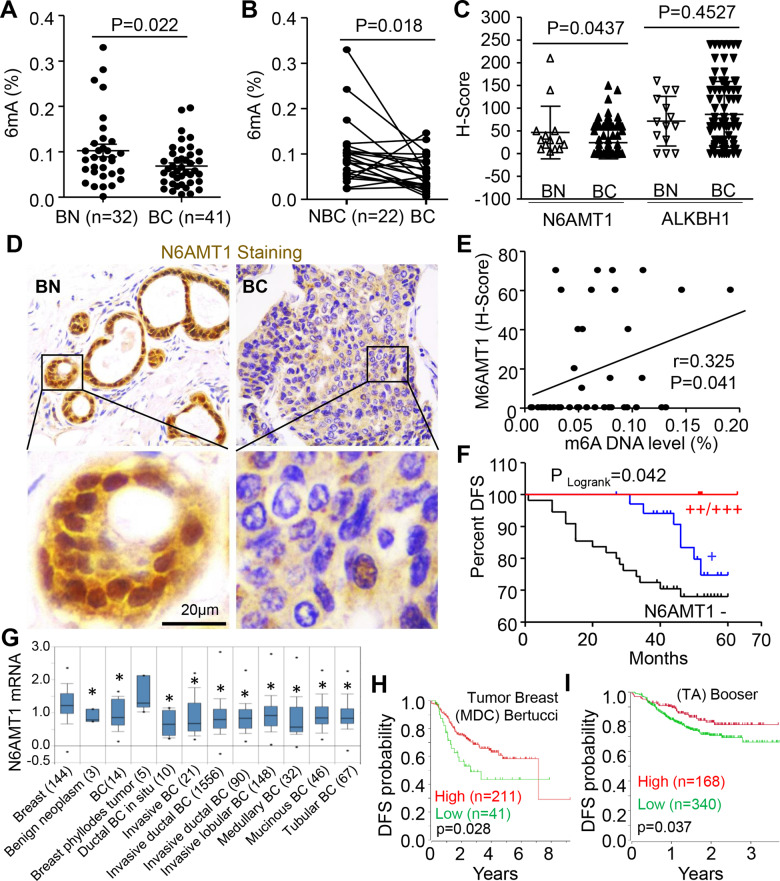
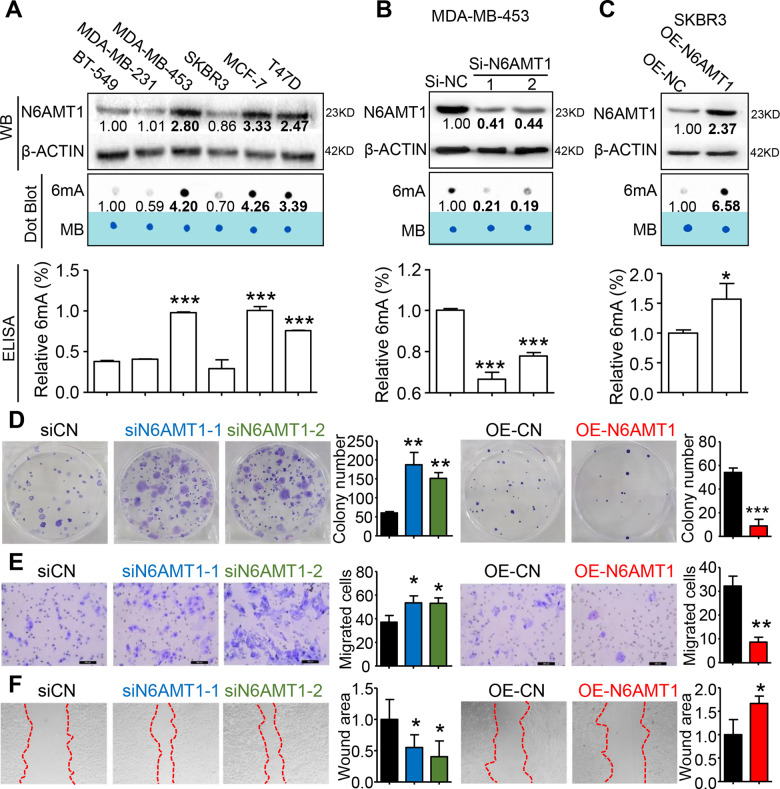
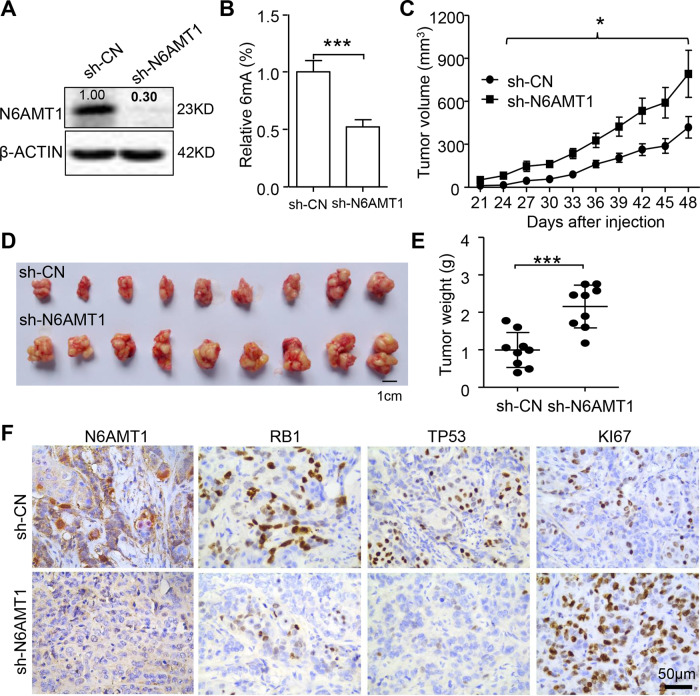
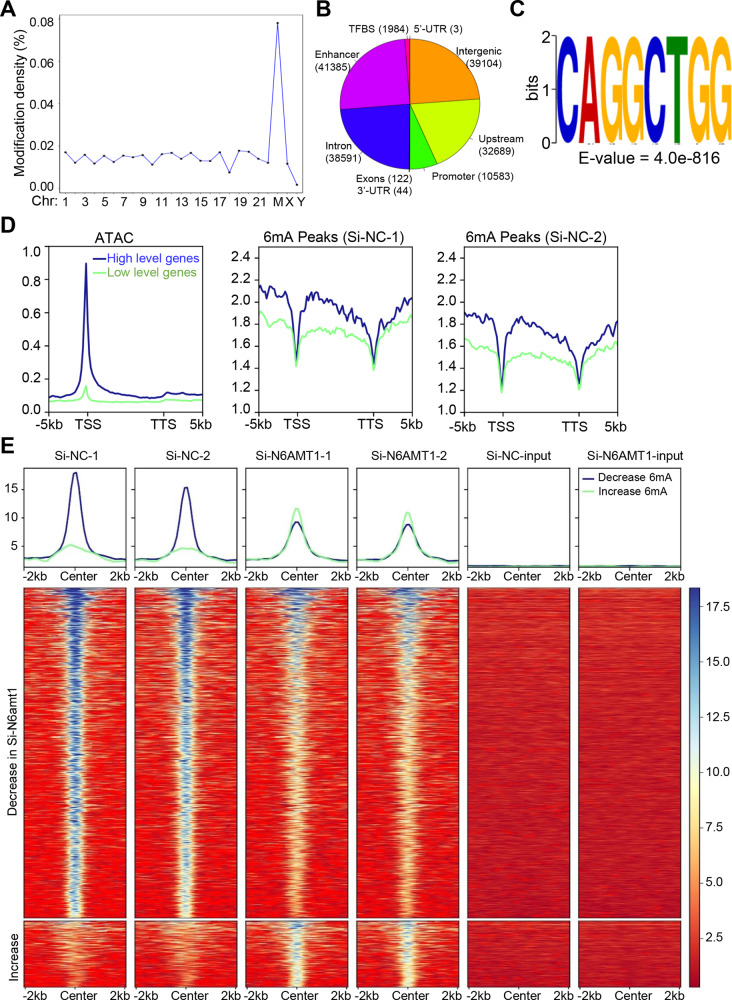
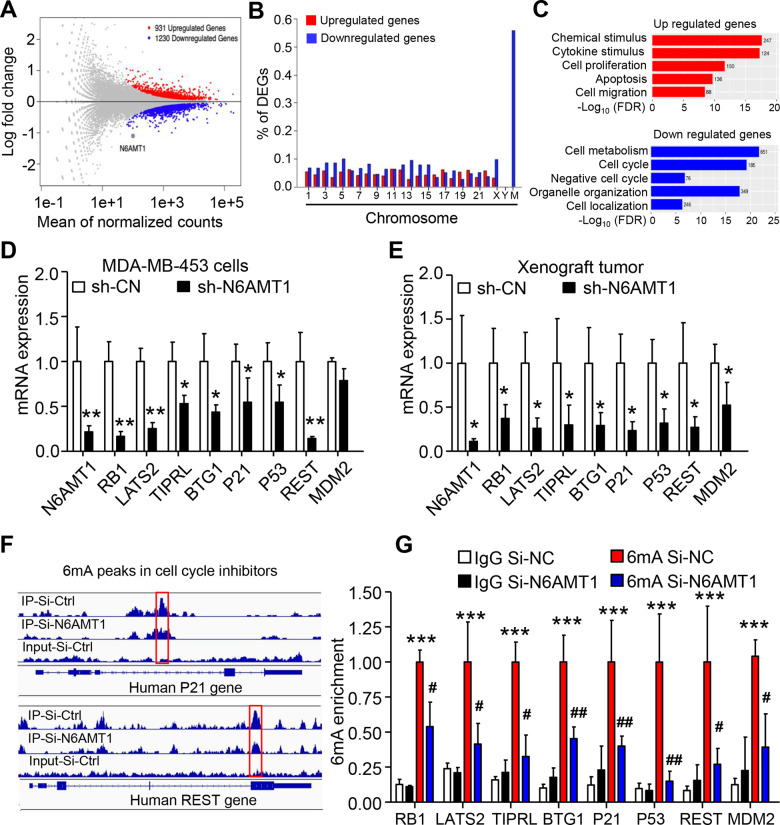
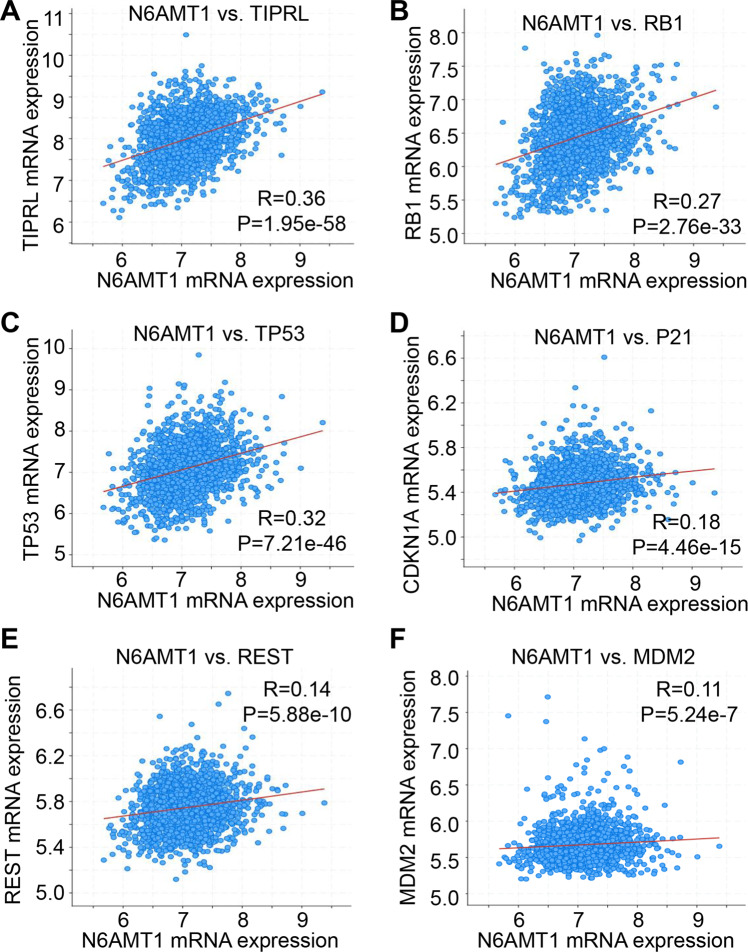
DNA N6-methyladenosine (6mA) is a novel epigenetic signaling modification in humans and has been implicated in the progression and tumorigenesis of several cancers. However, the function and mechanism of 6mA in breast cancer (BC), the most common cancer among women, are unclear. Here, we found that decreases in N6AMT1 correlated with the extent of 6mA in clinical BC tissues and predicted a worse survival of BC patients. Functionally, knockdown of N6AMT1 markedly reduced 6mA in DNA and promoted colony formation and migration of BC cells, whereas overexpression of N6AMT1 had the opposite effect. Moreover, silencing of N6AMT1 reduced 6mA modification and enhanced the growth of BC cells in vitro and tumors in vivo. 6mA immunoprecipitation sequencing (6mA-IP-seq), RNA-seq, 6mA-IP-PCR, and bioinformatics analysis indicated that N6AMT1 was a functional methyltransferase for genomic 6mA DNA modifications and related to gene transcriptional activity. Critical negative regulators of the cell cycle, such as RB1, P21, REST, and TP53 were identified as targets of N6AMT1 in BC. These results suggest N6AMT1 enhances DNA 6mA levels to repress tumor progression via transcriptional regulation of cell cycle inhibitors.


Conflict of interest statement

The authors declare no competing interests.

Figures

Fig. 1
Fig. 1. Reduction of N6AMT1 and DNA 6mA levels correlates with poor prognosis of BC patients.
A, B Levels of the global N6-methyladenine (6mA) in DNA were assessed via ELISA in primary breast cancer tissues (BC), normal breast tissues (BN), and adjacent non-breast cancerous tissues (NBC). Unpaired and paired t-tests were performed in (A) and (B), respectively. C Statistical analysis (Student’s t-test) of N6AMT1 and ALKBH1 protein between BC (n = 96) and NC (n = 14). D IHC staining for N6AMT1 in BC and BN samples. E Correlation between N6AMT1 protein and DNA 6mA levels in BC tissue was analyzed by Spearman’s t-test. F Kaplan–Meier survival curves of the disease-free survival (DFS) based on N6AMT1 expression level. G Box plots showing N6AMT1 mRNA expression from the ONCOMINE database analysis of breast statistics. *P < 0.05 vs. normal breast tissues. H, I Prognostic value of N6AMT1 mRNA levels in BC patients from the studies of Tumor Breast (MDC) Bertucci and (Taxane–Anthracycline) Booser. Statistical analysis was done using the log-rank test.
Fig. 2
Fig. 2. N6AMT1-mediated 6mA modification represses proliferation and migration of BC cells in vitro.
A Levels of N6AMT1 protein (top panel) and DNA 6mA levels (middle and lower panels) in various breast cancer cells were analyzed by western blot (WB, n = 3), dot-blot (n = 4), and ELISA (n = 4), respectively. β-ACTIN and methylene blue staining (MB) were used as the loading control for WB and dot-blot assays, respectively. The value is the relative ratio to BT-549 cells. Bold fonts indicate p-values less than 0.05, calculated by one-way ANOVA followed by the Bonferroni test. B Levels of N6AMT1 protein and 6mA in MDA-MB-453 cells following siN6AMT1 or si-NC transfection. The value is the relative ratio to si-NC. Bold fonts indicate p-values less than 0.05, calculated by one-way ANOVA followed by the Bonferroni test. C Levels of N6AMT1 protein and 6mA in SKBR3 cells following lentivirus-N6AMT1 (OE-N6AMT1) or -control (OE-CN) transduction. The value is the relative ratio of OE-NC. Bold fonts indicate p-values less than 0.05, calculated by Student’s t-test. DF, Knockdown of N6AMT1 enhanced colony formation and migration of MDA-MB-453 cells, whereas N6AMT1 overexpression impaired colony formation and migration of SKBR3 cells. *p < 0.05, **p < 0.01, **p < 0.001 vs. si-CN or OE-CN.
Fig. 3
Fig. 3. Silencing N6AMT1 reduces DNA 6mA and promotes the growth of BC cells in vivo.
A Western blot showing N6AMT1 was successfully knocked down by shN6AMT1 lentivirus in MDA-MB-453 cells. The value is the relative ratio to sh-NC. Bold fonts indicate p-values less than 0.05, calculated by Student’s t-test. B Reduction of 6mA in MDA-MB-453 cells following N6AMT1 knockdown, as determined by ELISA. CE Tumor growth curves (C), representative xenografts (D), and tumor weights (E) show that N6AMT1 knockdown enhances MDA-MB-453 cell xenograft growth. F Representative immunostaining for N6AMT1, RB1, TP53, and Ki67 in xenografts of sh-N6AMT1 and sh-Control tumors.
Fig. 4
Fig. 4. N6AMT1 is a functional methyltransferase for DNA 6mA modification in BC cells.
A, B 6mA distribution across all chromosomes and the functional elements of human genomic DNA. C The top motif sequence in 6mA-containing DNA fragment peaks identified by 6mA-IP-seq. D Profile plot showing the 6mA-IP-seq and ATAC-seq signals over the 1000 highest/lowest expressed protein-coding genes in MDA-MB-453 cells. E Heatmap demonstrating the change of 6mA signal by N6AMT1 knockdown over 6mA peaks. TFBS transcription factor binding sites, TSS transcription start site, TTS transcription termination site.
Fig. 5
Fig. 5. Negative regulators of the cell cycle are targets of N6AMT1 in BC cells.
A MA (M, log-ratio; A, mean average) plot of differentially expressed genes (DEGs) following N6AMT1 knockdown in MDA-MB-453 cells. B Distribution of DEGs across all chromosomes. C Bar plots displaying functional enrichment of DEGs following N6AMT1 knockdown. D, E qRT-PCR verification of decreased cell cycle inhibitors in N6AMT1-silenced MDA-MB-453 cells and the xenograft. *p < 0.05 by the unpaired two-tailed Student’s t-test. F IGV shows the decrease of piled 6 mA reads of cell cycle inhibitor genes from 6mA-IP-seq in MDA-MB-453 cells by N6AMT1 knockdown. The thinnest blue lines are the introns. The medium and thickest thickness segments are untranslated and translated exons, respectively. G 6mA-IP-qPCR assay indicates that silencing N6AMT1 reduced 6mA enrichment. ***P < 0.0001 vs. IgG si-CN. #P < 0.05 vs. 6mA si-CN by one-way ANOVA followed by the Bonferroni test. Data are expressed as mean ± standard deviation.
Fig. 6
Fig. 6
Correlations between N6AMT1 mRNA level and 6 critical negative cell cycle genes expression in 2509 BC tissues in TCGA cohort. Spearman correlation test shows N6AMT1 mRNA expression positively correlates with TIPRL (A), RB1 (B), TP53 (C), P21 (D), REST (E), and MDM2 (F).

References

    1. Siegel RL, Miller KD, Jemal A. Cancer Statistics, 2017. CA Cancer J Clin. 2017;67:7–30. - PubMed
    1. Harbeck N, Penault-Llorca F, Cortes J, Gnant M, Houssami N, Poortmans P, et al. Breast cancer. Nat Rev Dis Prim. 2019;5:66. - PubMed
    1. Ginsburg O, Bray F, Coleman MP, Vanderpuye V, Eniu A, Kotha SR, et al. The global burden of women’s cancers: a grand challenge in global health. Lancet. 2017;389:847–60. - PMC - PubMed
    1. Buocikova V, Rios-Mondragon I, Pilalis E, Chatziioannou A, Miklikova S, Mego M, et al. Epigenetics in breast cancer therapy-new strategies and future nanomedicine perspectives. Cancers (Basel) 2020;12:3622. - PMC - PubMed
    1. Lee YT, Tan YJ, Falasca M, Oon CE. Cancer-associated fibroblasts: epigenetic regulation and therapeutic intervention in breast cancer. Cancers (Basel) 2020;12:2949.. - PMC - PubMed

Publication types

MeSH terms

Substances