. 2022 Mar 7;12(1):4027.
doi: 10.1038/s41598-022-08047-w.

Simulated visual hallucinations in virtual reality enhance cognitive flexibility

Affiliations

Simulated visual hallucinations in virtual reality enhance cognitive flexibility

Clara Rastelli et al. Sci Rep. .

Abstract

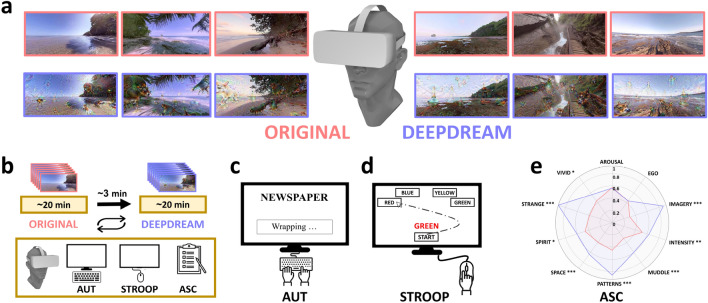
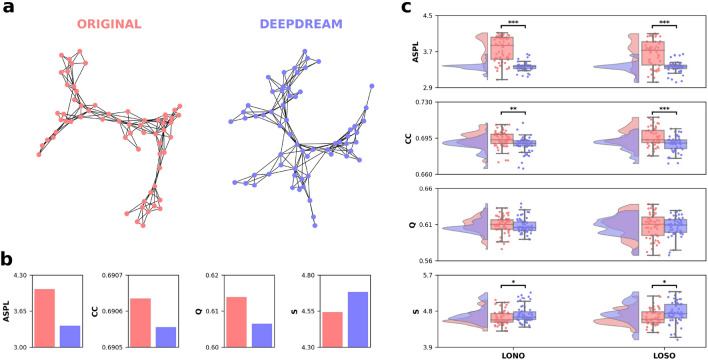
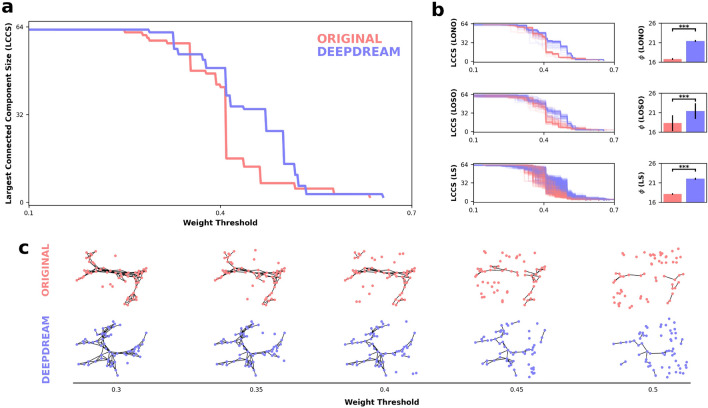
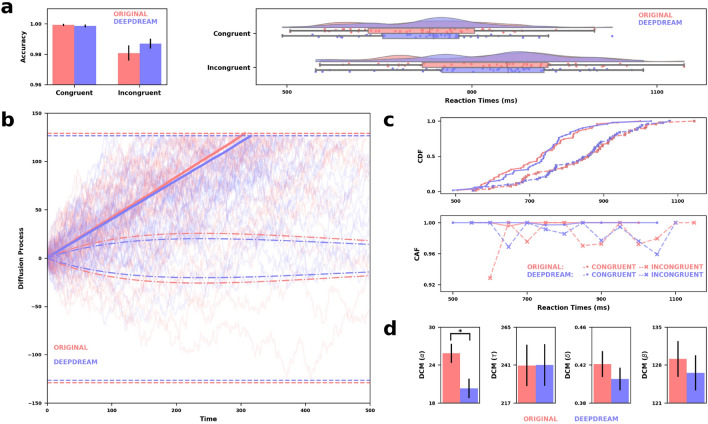
Historically, psychedelic drugs are known to modulate cognitive flexibility, a central aspect of cognition permitting adaptation to changing environmental demands. Despite proof suggesting phenomenological similarities between artificially-induced and actual psychedelic altered perception, experimental evidence is still lacking about whether the former is also able to modulate cognitive flexibility. To address this, we measure participants' cognitive flexibility through behavioral tasks after the exposure to virtual reality panoramic videos and their hallucinatory-like counterparts generated by the DeepDream algorithm. Results show that the estimated semantic network has a flexible structure when preceded by altered videos. Crucially, following the simulated psychedelic exposure, individuals also show an attenuated contribution of the automatic process and chaotic dynamics underlying the decision process. This suggests that simulated altered perceptual phenomenology enhances cognitive flexibility, presumably due to a reorganization in the cognitive dynamics that facilitates the exploration of uncommon decision strategies and inhibits automated choices.


Conflict of interest statement

The authors declare no competing interests.

Figures

Figure 1
Figure 1
Experimental design and stimuli. (a) Visual stimuli presented in VR. They were panoramic 360° videos depicting natural scenes (red frames) and their DeepDream modified counterparts (blue frames). (b) Experimental design. Recurring arrows refer to the counterbalanced order of the conditions across participants. (c) Schematic example of the AUT. (d) Schematic example of the Stroop task. (e) Radar plot of the ASC results. Red and blue areas represent OR and DD conditions, respectively. Statistical significance. *p < 0.05; **p < 0.01, ***p < 0.001.
Figure 2
Figure 2
Semantic networks, topological quantifiers and statistical results. (a) Undirected, unweighted semantic networks of the OR and DD conditions, visualized using the spring layout, with nodes as unique AUT responses and edges as cosine similarity. (b) Barplots depicting the topological quantifiers of the full networks. (c) Raincloud plots represent the results from the LONO and LOSO procedures on the topological quantifiers. Horizontal black bars represent statistical significance.
Figure 3
Figure 3
Network percolation and statistical results. (a) Line plot representing the percolation process of the OR (red) and DD (blue) full networks. The x-axis represents the weight threshold, starting from the smallest weight in the network (0.1) to a weight strength in which the giant component is smaller than three nodes (0.7). (b) On the left, line plots of the LONO, LOSO, and LS procedures. Each line is an iteration, colors encode the conditions. On the right, barplots show the ϕ between conditions and across the three procedures. Error bars represent the standard error of the mean (SEM). Horizontal black bars represent statistical significance. (c) OR and DD semantic networks undergoing the percolation process, visualized at different weight thresholds.
Figure 4
Figure 4
(a) On the left, bar plots of the accuracies between OR (red) and DD (blue) conditions, and congruent and incongruent trials, with error bars indicating SEM and horizontal bars representing statistical significance. On the right, raincloud plots of the RT across Stroop conditions. (b) Graphical depiction of the results from the DCM. Semi-transparent solid lines are 10,000 trials simulated per condition using recovered parameters from model fitting. Solid lines are the average of the simulated trials per condition. Dash-dotted lines represent the automatic process, while dashed lines represent boundaries. (c) Group-level statistics were used for fitting the DCM. On the top, the cumulative distribution functions (CDF), while on the bottom are the conditional accuracy functions (CAF), both plotted across Stroop conditions. (d) Barplots indicating the estimated parameters from DCM [α = amplitude of the automatic process, τ = decay of the automatic process, δ = drift of the controlled process, β = decision boundary]. Error bars indicating SEM and horizontal bars representing statistical significance.
Figure 5
Figure 5
(a) On the top, mouse trajectories of OR (red) and DD (blue) spatially aligned to the four targets and divided by congruent (left) and incongruent (right) trials. On the bottom, mouse trajectories spatially aligned to the same initial (0,0) and ending (1,1) point. (b) Barplots depicting the measures applied to the mouse trajectories. Error bars indicating SEM and horizontal bars representing statistical significance. (c) GMM clusters of mouse trajectories. Grey dashed lines represent the trajectories, crosses are the centroids of each cluster while ellipsoids are the covariances. (d) Transition probability matrices for each condition and split between congruent and incongruent trials. (e) Barplots representing dwell time for each state. Error bars indicating SEM and horizontal bars representing statistical significance.

References

    1. Uddin LQ. Cognitive and behavioural flexibility: Neural mechanisms and clinical considerations. Nat. Rev. Neurosci. 2021;22:167–179. - PMC - PubMed
    1. Scott WA. Cognitive complexity and cognitive flexibility. Sociometry. 1962;25:405–414.
    1. Mednick S. The associative basis of the creative process. Psychol. Rev. 1962;69:220–232. - PubMed
    1. Kenett YN, et al. Flexibility of thought in high creative individuals represented by percolation analysis. Proc. Natl. Acad. Sci. 2018;115:867–872. - PMC - PubMed
    1. De Pisapia, N. & Rastelli, C. Creativity as an information-based process.

Publication types