. 2022 Mar;6(3):246-256.
doi: 10.1038/s41551-022-00850-0. Epub 2022 Mar 7.

Field validation of the performance of paper-based tests for the detection of the Zika and chikungunya viruses in serum samples

Affiliations

Field validation of the performance of paper-based tests for the detection of the Zika and chikungunya viruses in serum samples

Margot Karlikow et al. Nat Biomed Eng. 2022 Mar.

Abstract

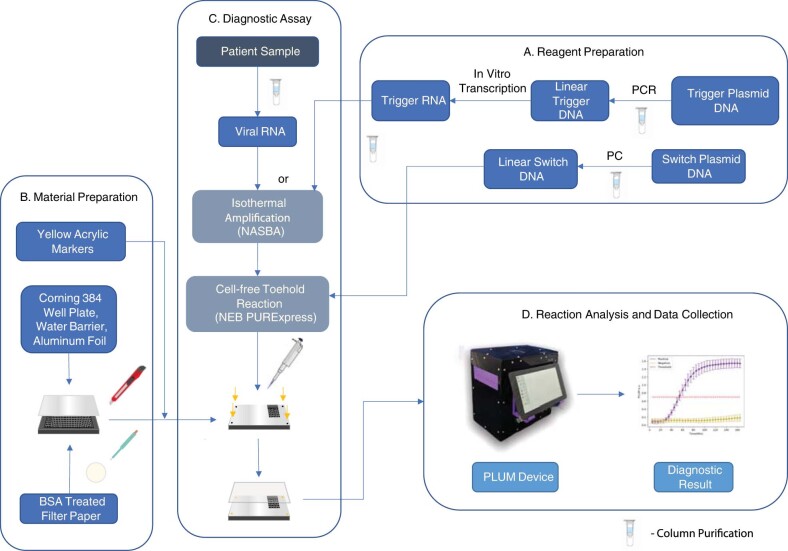
In low-resource settings, resilience to infectious disease outbreaks can be hindered by limited access to diagnostic tests. Here we report the results of double-blinded studies of the performance of paper-based diagnostic tests for the Zika and chikungunya viruses in a field setting in Latin America. The tests involved a cell-free expression system relying on isothermal amplification and toehold-switch reactions, a purpose-built portable reader and onboard software for computer vision-enabled image analysis. In patients suspected of infection, the accuracies and sensitivities of the tests for the Zika and chikungunya viruses were, respectively, 98.5% (95% confidence interval, 96.2-99.6%, 268 serum samples) and 98.5% (95% confidence interval, 91.7-100%, 65 serum samples) and approximately 2 aM and 5 fM (both concentrations are within clinically relevant ranges). The analytical specificities and sensitivities of the tests for cultured samples of the viruses were equivalent to those of the real-time quantitative PCR. Cell-free synthetic biology tools and companion hardware can provide de-centralized, high-capacity and low-cost diagnostics for use in low-resource settings.


Conflict of interest statement

K.P., A.A.G. and J.J.C. are co-inventors of paper-based toehold sensor-related technologies. Y.G., S.C. and K.P. are co-founders of LSK Technologies, Inc. and are co-inventors of the PLUM-related technologies. M.K., K.P. and A.A.G. are co-founders of En Carta Diagnostics Ltd. Provisional patent applications related to this work are 62/982,323 (to Y.G., S.C. and K.P., filed 27 February 2020), WO2014074648A3 (to A.A.G. and J.J.C., filed 6 November 2012), US15/963,831 (to K.P. and J.J.C., filed 6 December 2013), 62/403,778 (to K.P., A.A.G. and J.J.C., filed 4 October 2016) and 62/341,221 (to K.P., A.A.G. and J.J.C., filed 25 May 2016). The other authors declare no competing interests.

Figures

Fig. 1
Fig. 1. Schematic of the paper-based diagnostic system.
a, System development. Virus-specific toehold-switch-based sensors were computationally designed based on the target virus genomic sequence. DNA encoding the toehold switch was then embedded into paper discs with a cell-free system (CFS) that transcribes the RNA-based sensor. In the presence of target viral RNA, the toehold switch enables cell-free translation of the LacZ (CFS: LacZ) reporter gene to create a colorimetric output (yellow → purple). The system is programmable and can be similarly applied to detect any pathogen sequence, enabling the formation of a molecular tools library. b, Field trial. Using cultured virus, the analytical sensitivity and specificity of the paper-based diagnostic were first validated using a two-step NASBA and toehold switch-based method. All of the data were collected and analysed using the in-house PLUM reader. RT–qPCR was performed in parallel for all experiments for comparison. Using the same method, validation was followed by a patient trial using RNA extracted from patient serum samples.
Fig. 2
Fig. 2. Optimization of the molecular tools for the Zika virus diagnostic test and development of the hardware and software components of the portable, low-cost PLUM reader.
a, Schematic showing the assay workflow for tests using synthetic RNA (1), extracted RNA from lentivirus containing the target Zika virus sequence (2) and direct use of lysed lentivirus containing the target Zika RNA sequence (3). bd, Bar graphs of analytical sensitivity determination using synthetic RNA at 1.24 × 10x molecules per µl (b) column-extracted RNA from engineered lentivirus carrying the target RNA sequence (c) and heat-lysed engineered lentivirus carrying the target sequence (d). All data represent technical replicates from a single representative experiment (three independent biological triplicates were performed). Absorbance at 570 nm was measured on a commercial plate reader. Analysis is the mean absorbance ± s.d. of the cell-free experiments at 130 min, which were preceded by a 70 min NASBA reaction. e, Schematic of the PLUM reader labelled with hardware components, including Raspberry Pi computer, camera, light box, heater for incubation and an LCD touch screen for device operation. f, Image of the GUI showing the map setup screen for user-friendly PLUM operation and onboard data analysis. Here the map shows the plate locations of five triplicate LacZ-positive (purple) and LacZ-negative (yellow) reactions used to evaluate positional effects on data collection. g, Plot of PLUM reader data analysis for the spatially distributed triplicate LacZ-positive (purple) and LacZ-negative (yellow) reactions after layout in f. Analysis is the mean of the five selected locations; error bar represents ± s.d. of all 15 wells (Supplementary Fig. 2). The red line represents a theoretical diagnostic threshold that was determined using sensitivity data from field trials.
Fig. 3
Fig. 3. Performance of the diagnostic system for the Zika virus in Latin America.
a, Specificity was determined for ZIKV Am against a panel of off-target viruses (at 106 PFU ml−1) that included ZIKV Af, CHIKV, YFV and DENV-1–4. b, Analytical sensitivity experiment using cultured Zika virus as well as the mean Ct value obtained in the parallel RT–qPCR (Supplementary Fig. 4b). NA, not applicable. Visual outputs at final time point of 235 min are shown below the graphs in a and b (yellow, negative; purple, positive). The graphs in a and b represent the mean ± s.d. of technical replicates from a single representative experiment (three independent biological triplicates were performed) at 130 min of the cell-free experiments (preceded by 70 min NASBA reaction). RT–qPCR experiments were run in parallel for results confirmation using the CDC gold-standard assay (Supplementary Fig. 4a,b). c, Logistic test for threshold value determination (a.u.) of Zika virus diagnostic at 130 min, established using normalized background reading from analytical sensitivity tests performed in PLUM device. On the y axis, negative samples were plotted at 0; positive samples were plotted at 1. d, Segregation of the patient samples using the threshold value set in c is placed in perspective of the Ct values obtained by RT–qPCR for all 268 samples.
Fig. 4
Fig. 4. Performance of the diagnostic system for the chikungunya virus in Latin America.
a, Analytical sensitivity using synthetic trigger RNA on the best-performing molecular sensor. Values on the x axis are 3.25 × 10x molecules per µl. b, Analytical specificity against eight off-target arboviruses (at 106 PFU ml−1) with the addition of MAYV. c, Analytical sensitivity of the test using serial dilution of extracted RNA from cultured CHIKV PE. Visual outputs (b, c) at final time point of 235 min are shown below the graphs (yellow, negative; purple, positive) as well as the mean Ct value obtained in the parallel RT–qPCR (c and Supplementary Fig. 6b). NA, not applicable. Analysis in ac represents the mean absorbance ± s.d. of technical replicates from a single representative experiment (three independent biological triplicates were performed) and represent the experimental time point at 75 min of the cell-free experiments (preceded by 70 min NASBA reaction). In some cases for a and b, data points of the replicates are below zero on the y axis. Statistical analysis of (b): unpaired t-test, ***P = 0.0007. RT–qPCR experiments were run in parallel of (b) and (c) for results validation (Supplementary Fig. 6a,b). d, Logistic test for threshold value determination (a.u.) of CHIKV diagnostic at 75 min, established using normalized background reading from analytical sensitivity tests performed in PLUM device. On the y axis, negative samples were plotted at 0; positive samples were plotted at 1. e, Segregation of the patient samples using the threshold value set in d are placed in perspective of the Ct values obtained by RT–qPCR for all 65 samples.
Extended Data Fig. 1
Extended Data Fig. 1. Graphical workflow.
a, Reagent preparation: Linear DNA for toehold switches is obtained by PCR from a plasmid vector. Similarly, positive control trigger DNA is obtained from plasmids via PCR and subsequently in vitro transcribed into RNA. Column purification steps are indicated. b, Material preparation: Yellow acrylic markers are laser-cut to fit into the four corners of a 384-well plate. Paper discs are punched out from BSA-treated filter paper using a 2 mm biopsy punch and deposited in the bottom of each reaction well. The wells surrounding the reaction are then filled with water and an aluminum foil seal is placed on the plate. Using an utility knife, only the reaction wells are cut out. c, Diagnostic assay: Viral RNA is extracted from patient samples and then amplified through NASBA isothermal amplification, alongside positive control trigger RNA. The amplification product from NASBA is then added to cell-free reactions with linear switch DNA. Clear PCR film is applied to the plate to seal the reactions. The plate is placed inside the pre-incubated PLUM device. d, Reaction analysis and data collection: The PLUM software recognizes the plate and continues to capture the reaction (5 min intervals) over the next three hours. At the end of the reaction, the software analyzes the images generated, determining whether a purple to yellow color change has occurred in each well. PLUM generates a graphical report, which indicates whether the sample is positive or negative using a pre-determined threshold value.

References

    1. MacNamara F. Zika virus: a report on three cases of human infection during an epidemic of jaundice in Nigeria. Trans. R. Soc. Trop. Med. Hyg. 1954;48:139–145. doi: 10.1016/0035-9203(54)90006-1. - DOI - PubMed
    1. Dick GW, Kitchen S, Haddow A. Zika virus (I). Isolations and serological specificity. Trans. R. Soc. Trop. Med. Hyg. 1952;46:509–520. doi: 10.1016/0035-9203(52)90042-4. - DOI - PubMed
    1. Duffy MR, et al. Zika virus outbreak on Yap Island, Federated States of Micronesia. N. Engl. J. Med. 2009;360:2536–2543. doi: 10.1056/NEJMoa0805715. - DOI - PubMed
    1. Musso D, Nilles EJ, Cao-Lormeau VM. Rapid spread of emerging Zika virus in the Pacific area. Clin. Microbiol. Infect. 2014;20:O595–O596. doi: 10.1111/1469-0691.12707. - DOI - PubMed
    1. Lowe R, et al. The Zika virus epidemic in Brazil: from discovery to future implications. Int. J. Environ. Res. Public Health. 2018;15:96. doi: 10.3390/ijerph15010096. - DOI - PMC - PubMed

Publication types