. 2022 Mar;24(3):353-363.
doi: 10.1038/s41556-022-00853-8. Epub 2022 Mar 7.

Itaconate inhibits TET DNA dioxygenases to dampen inflammatory responses

Affiliations

Itaconate inhibits TET DNA dioxygenases to dampen inflammatory responses

Lei-Lei Chen et al. Nat Cell Biol. 2022 Mar.

Abstract

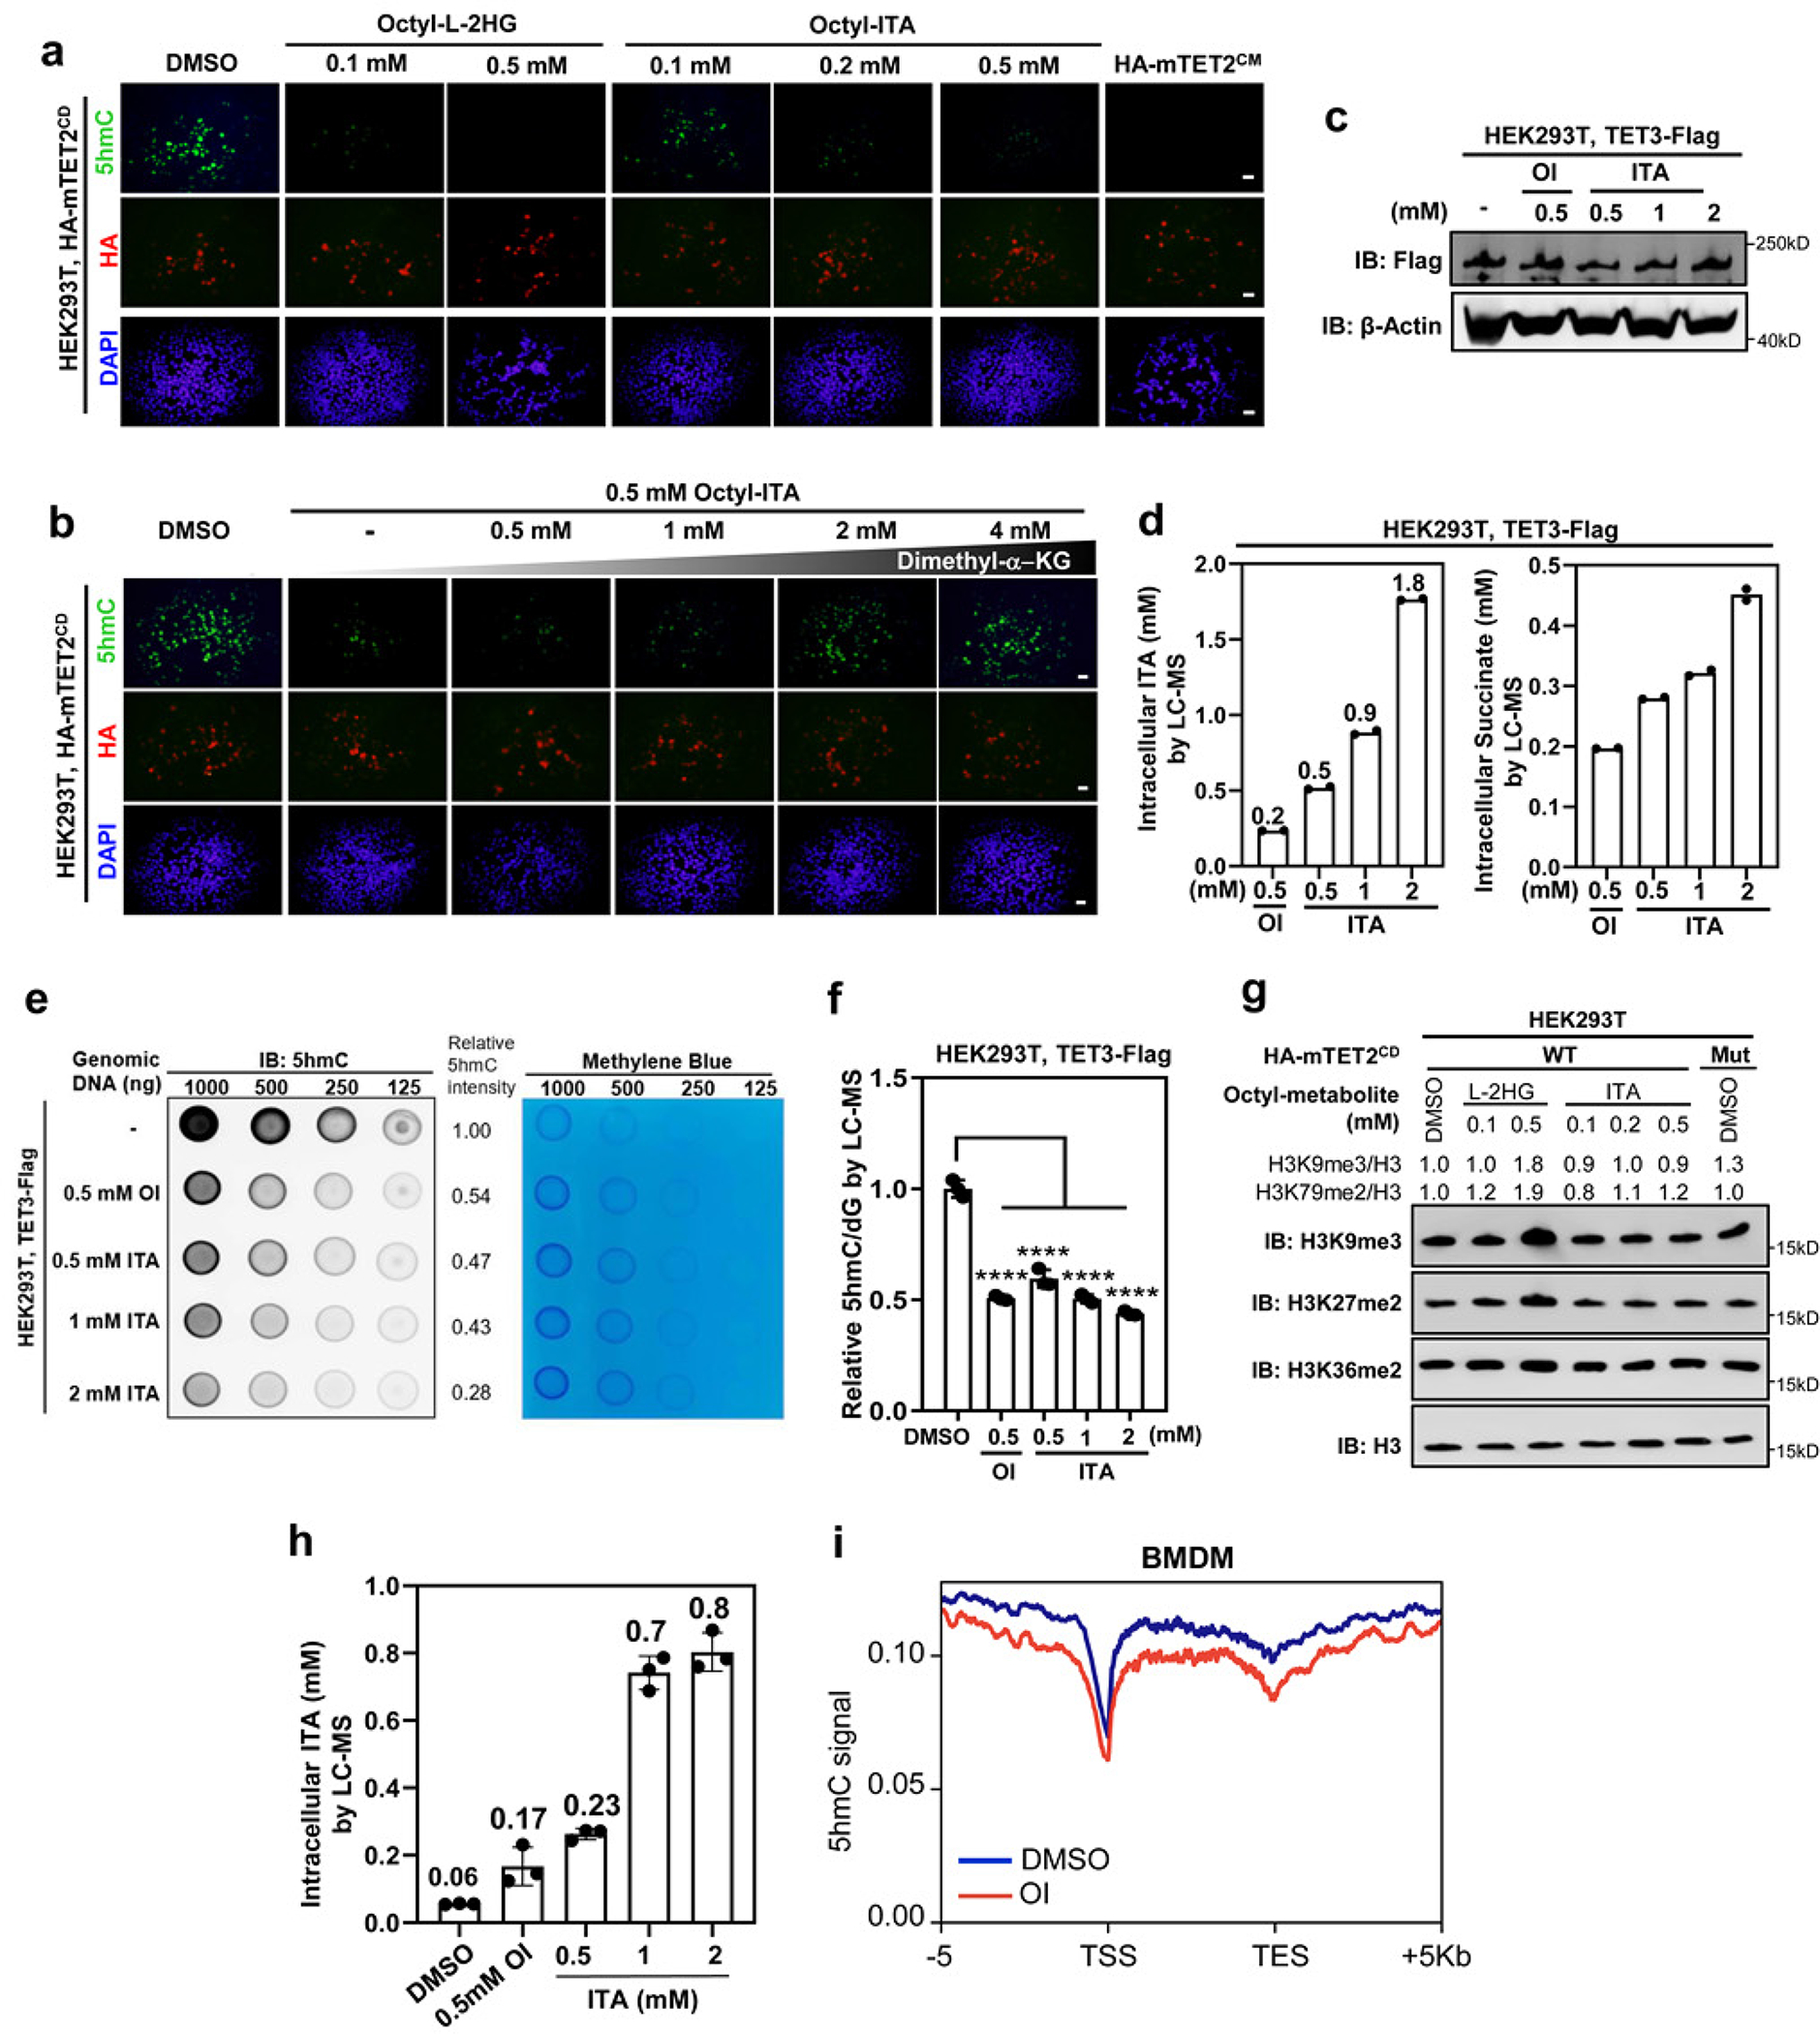
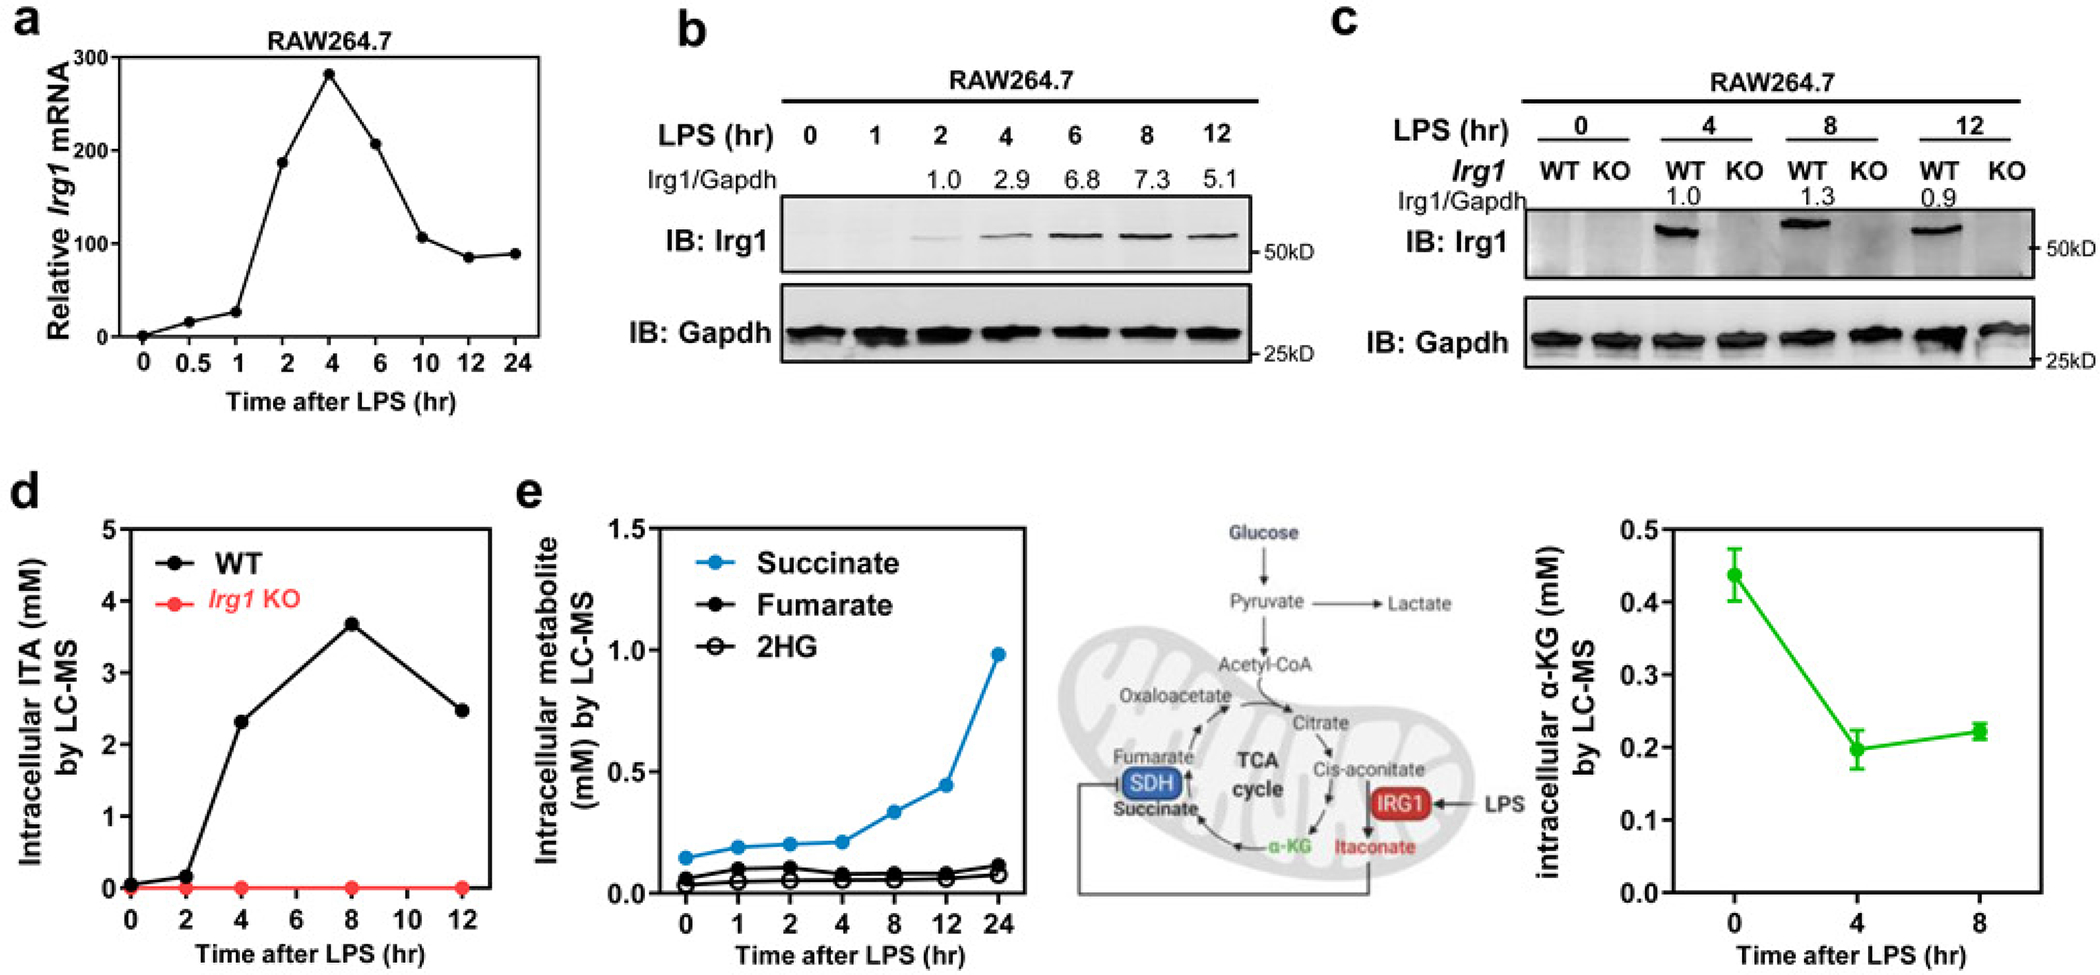
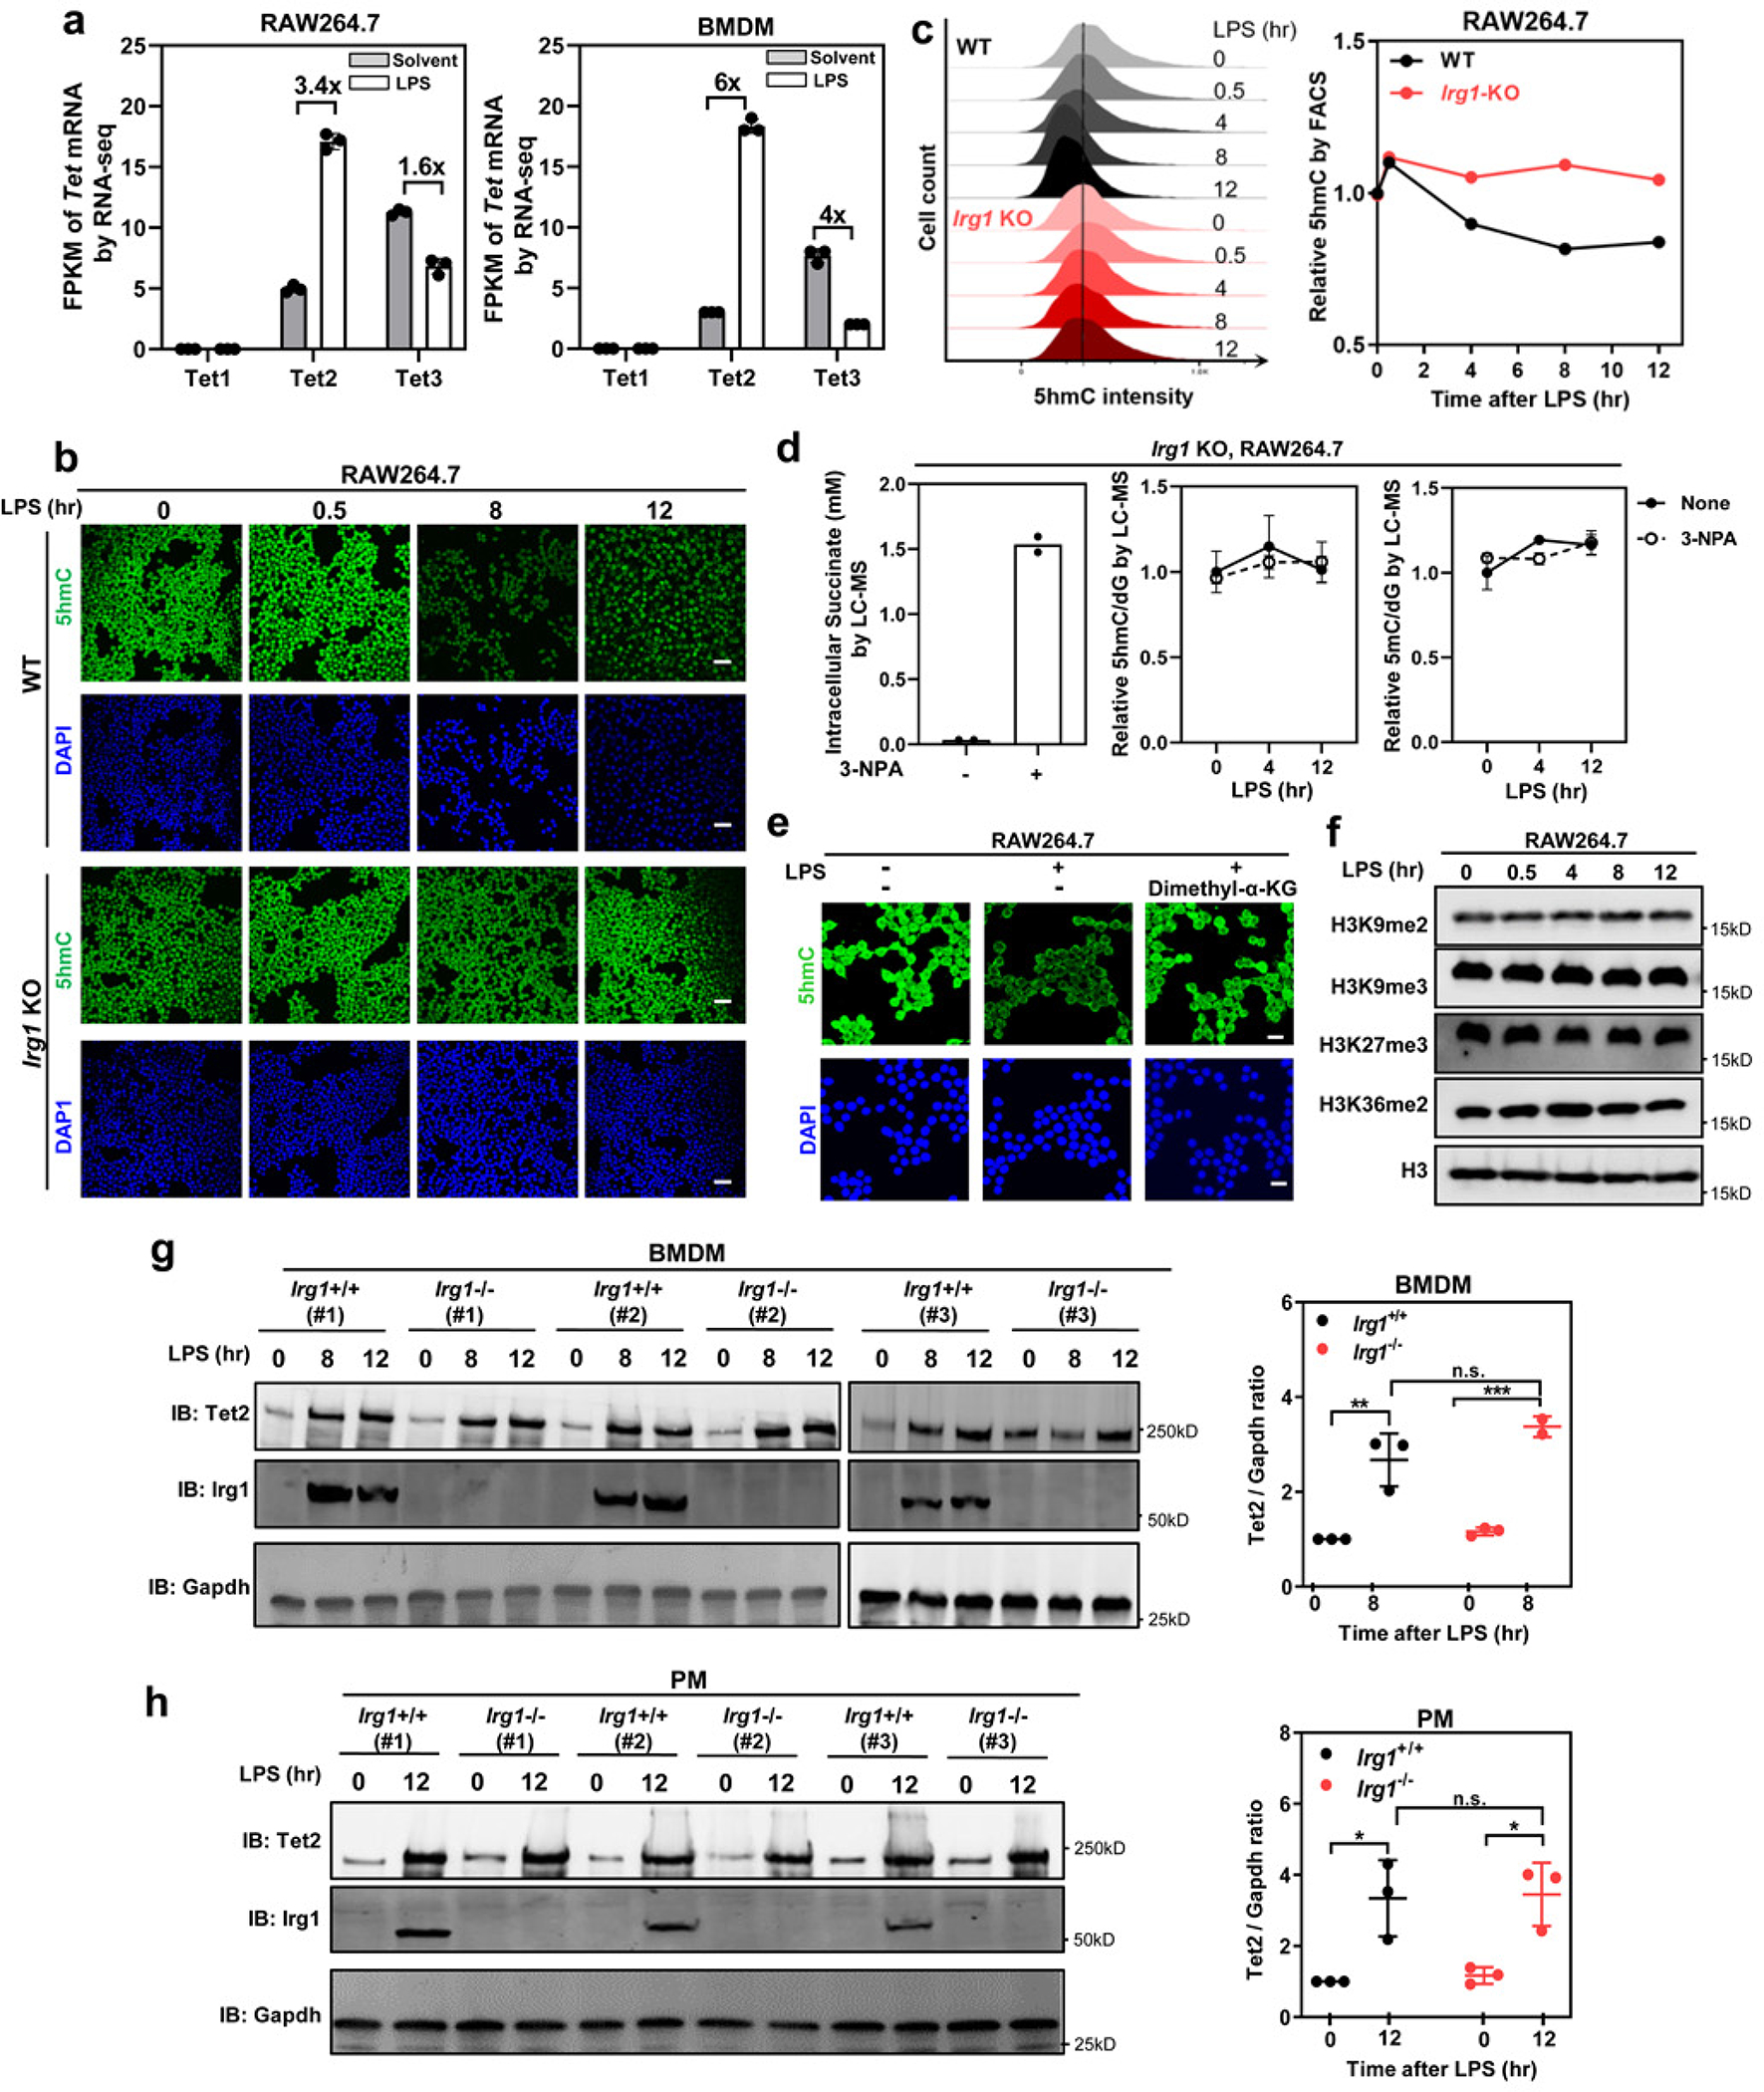
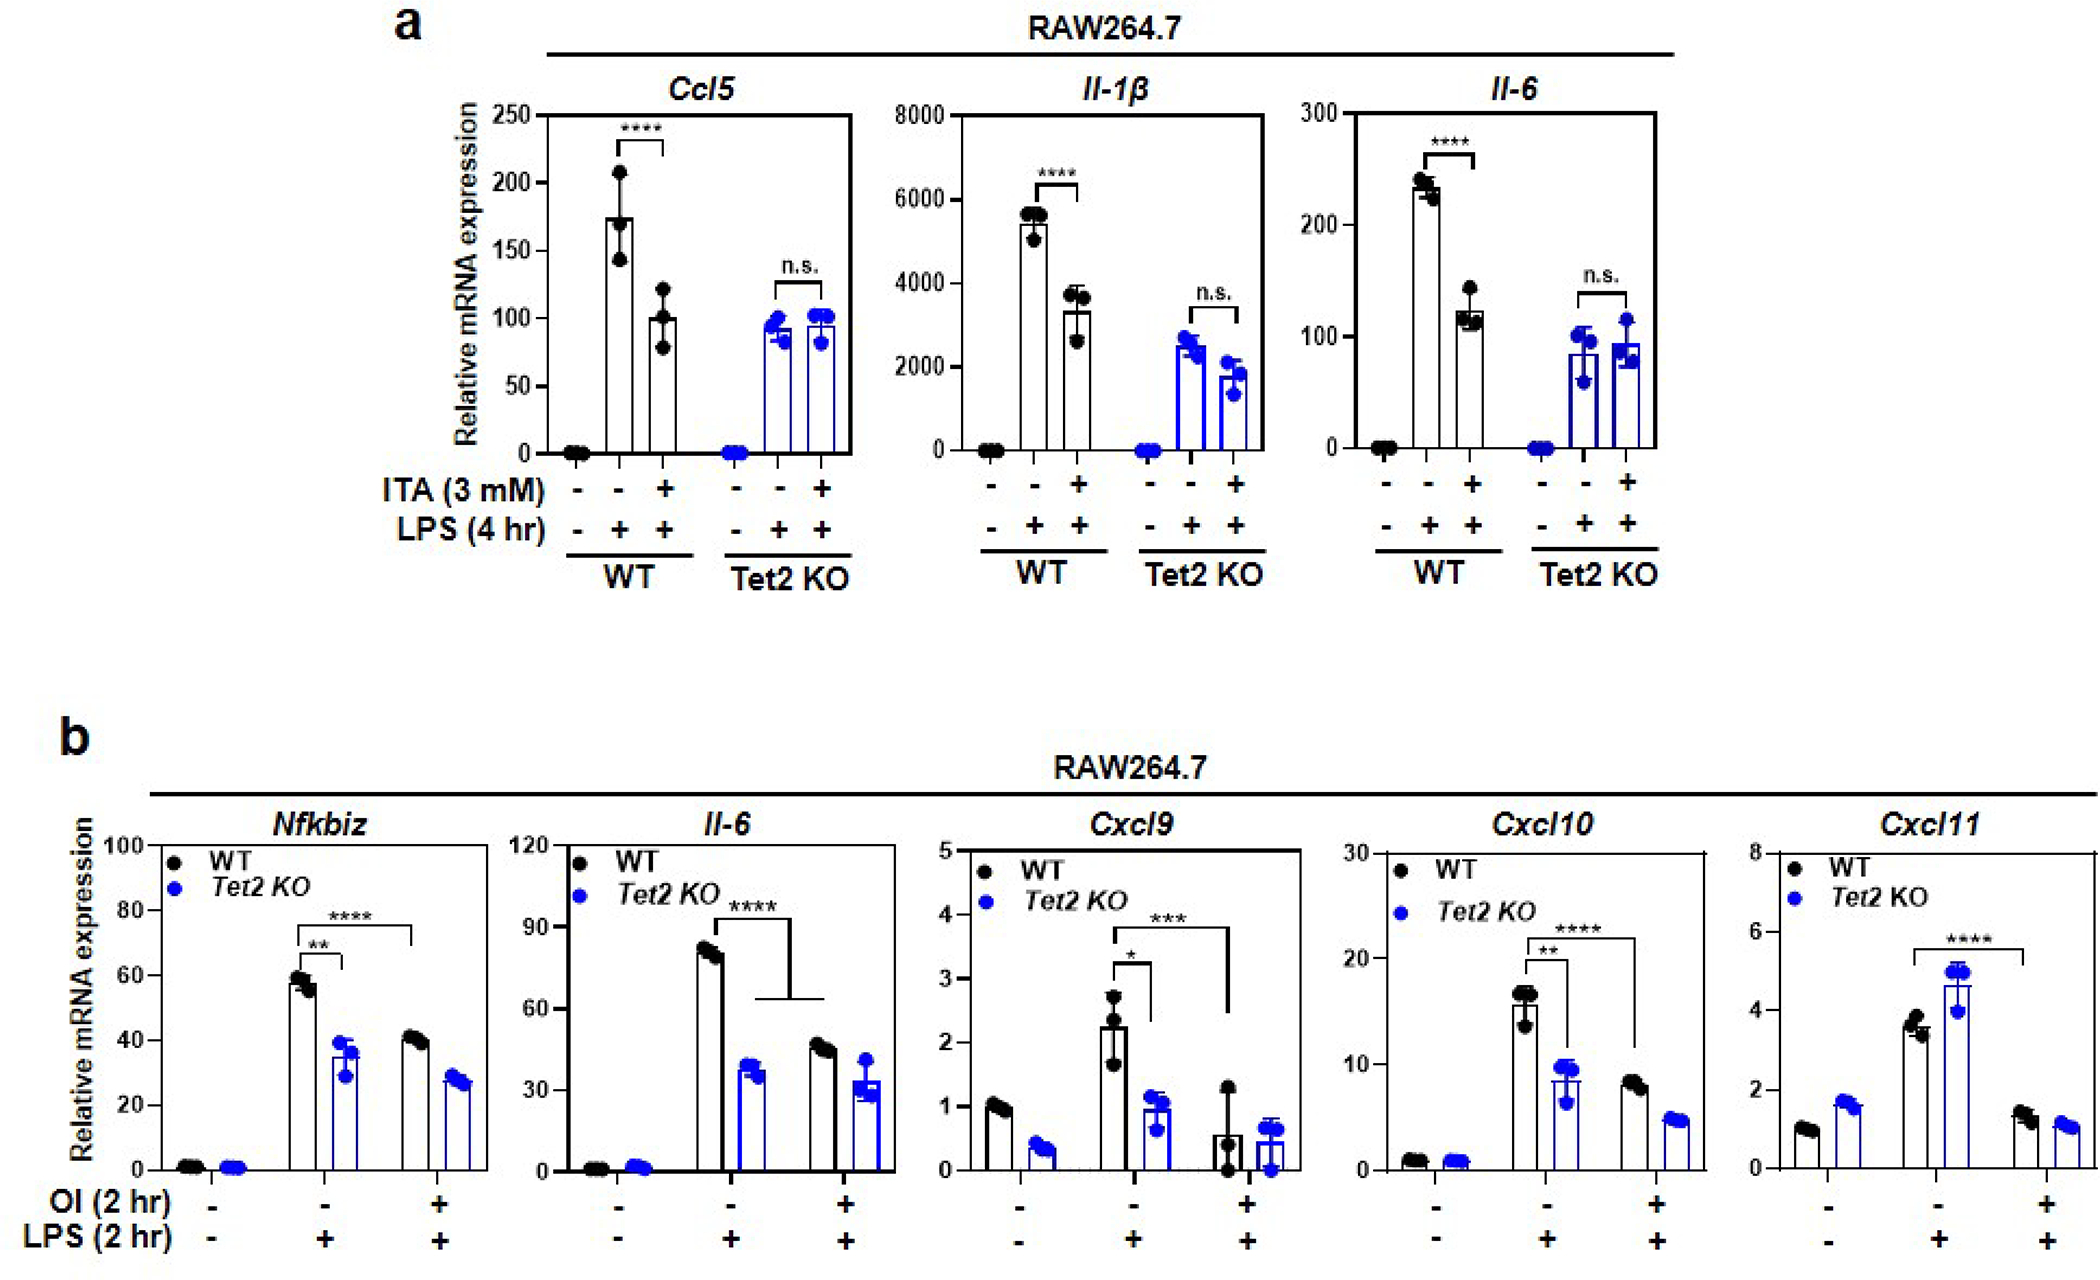
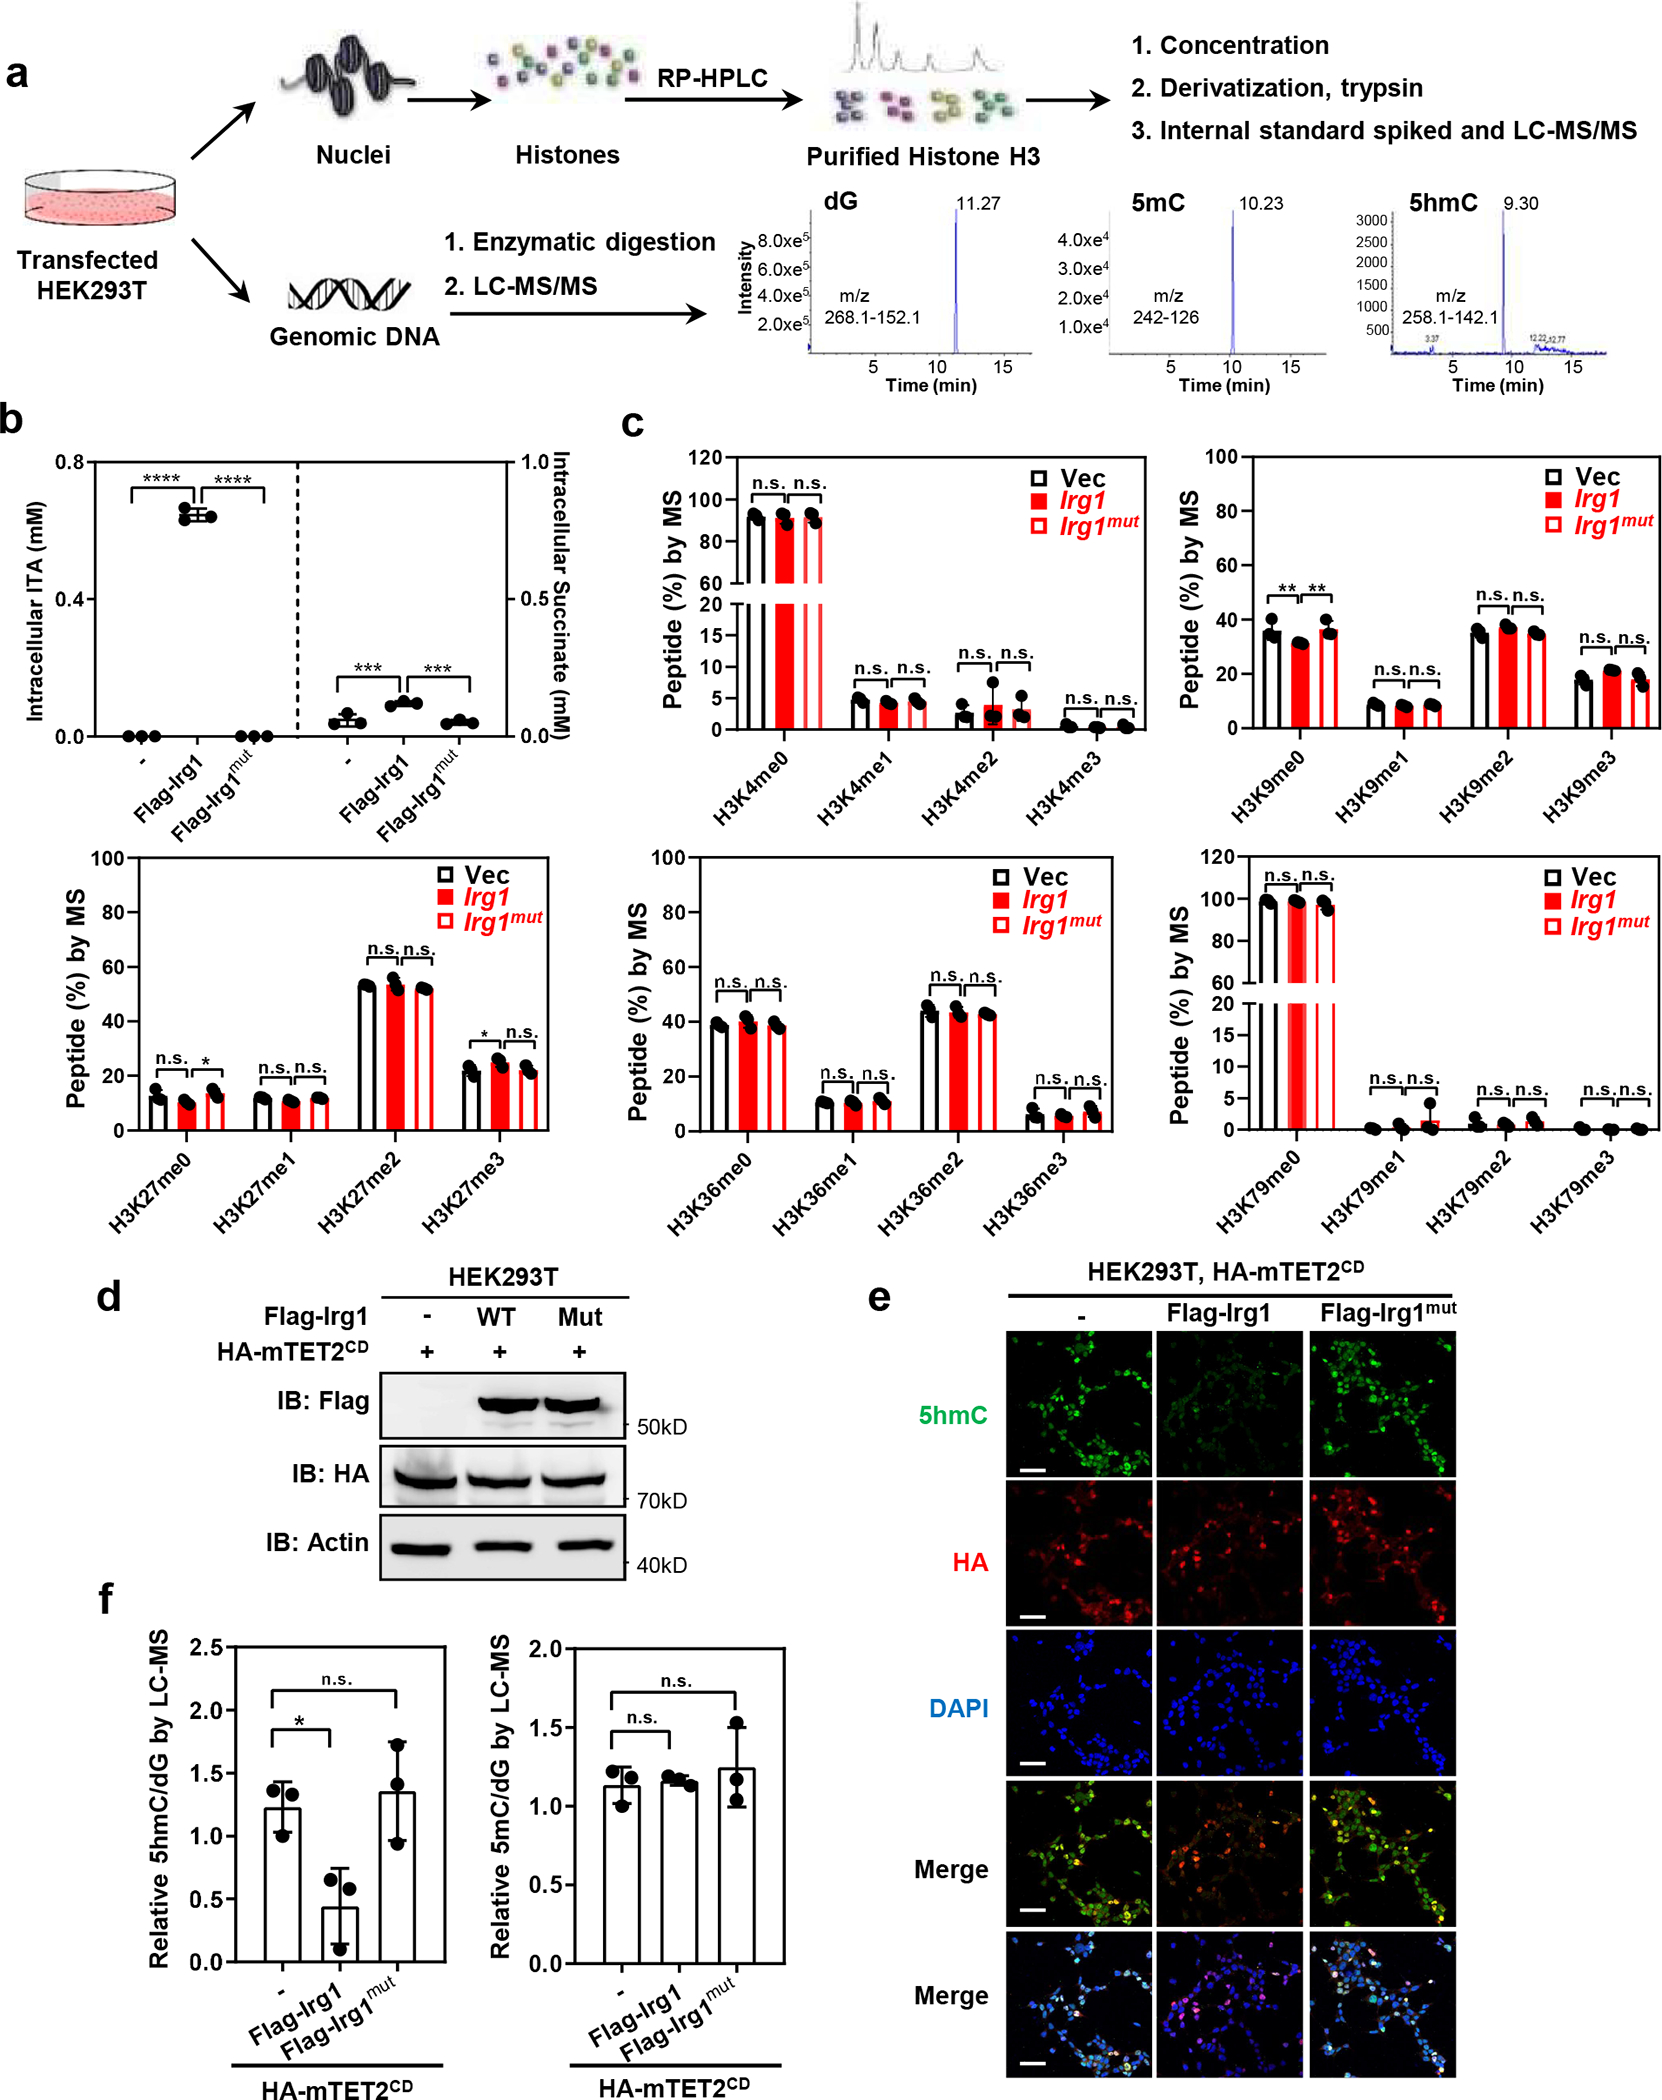
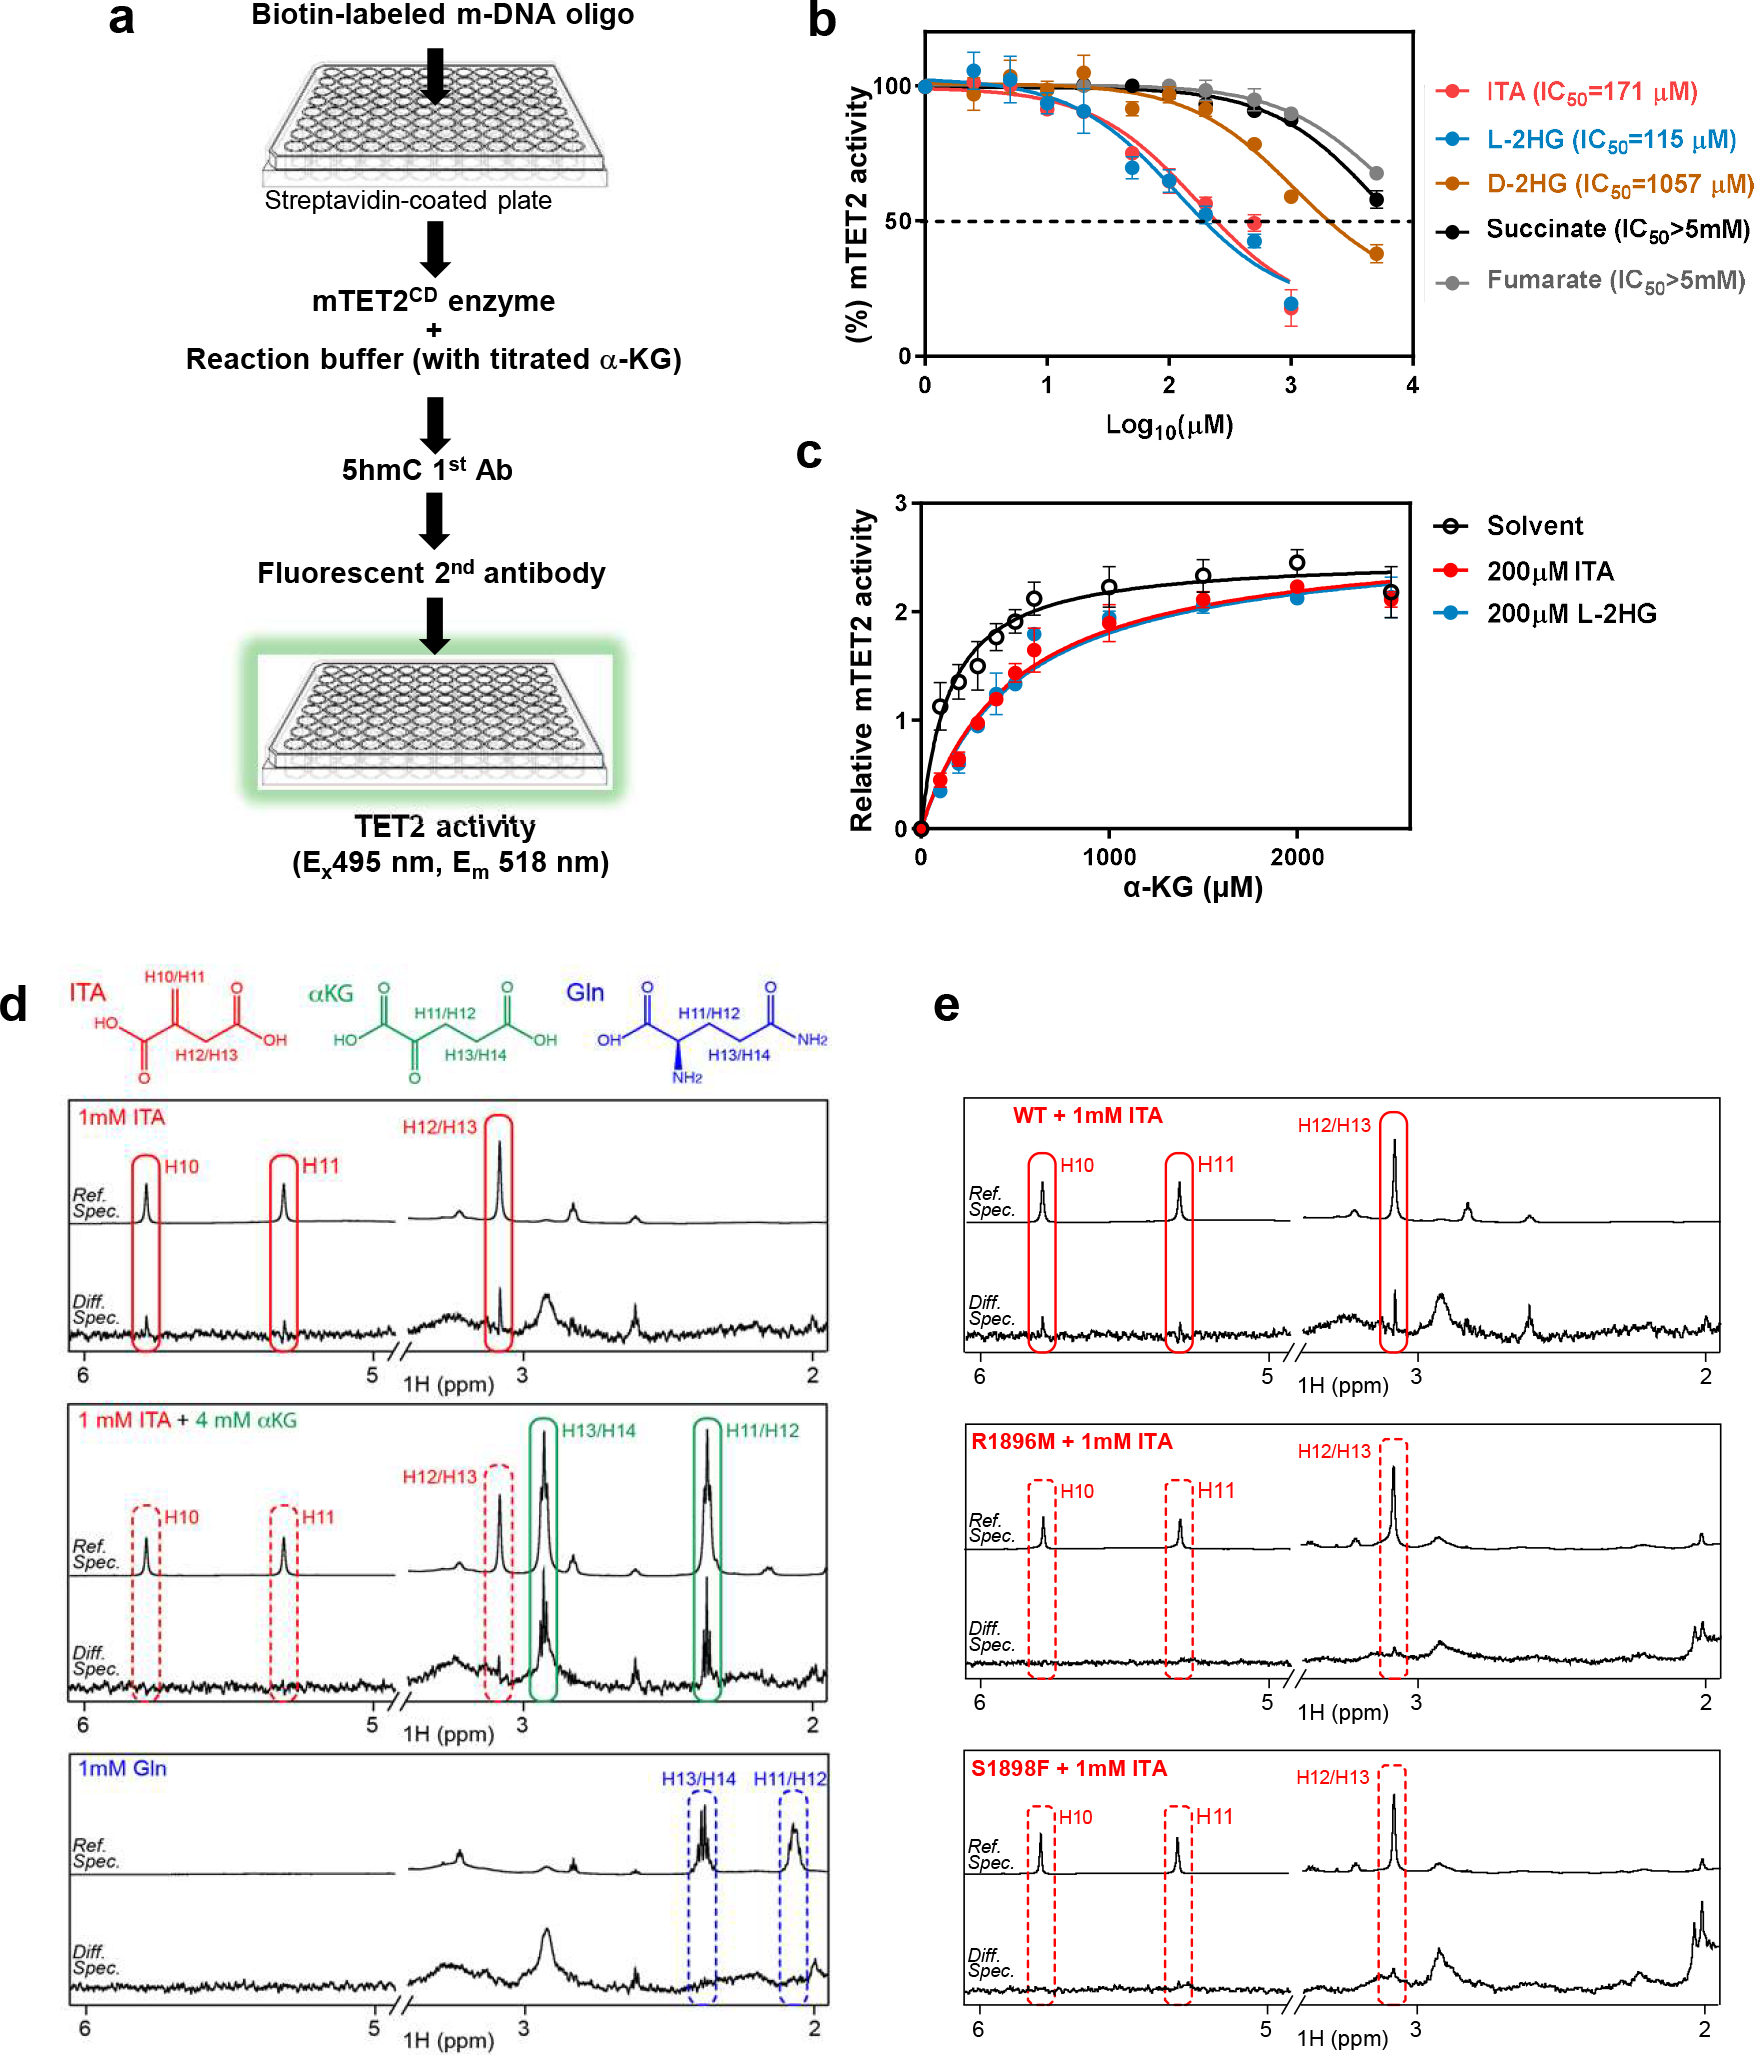
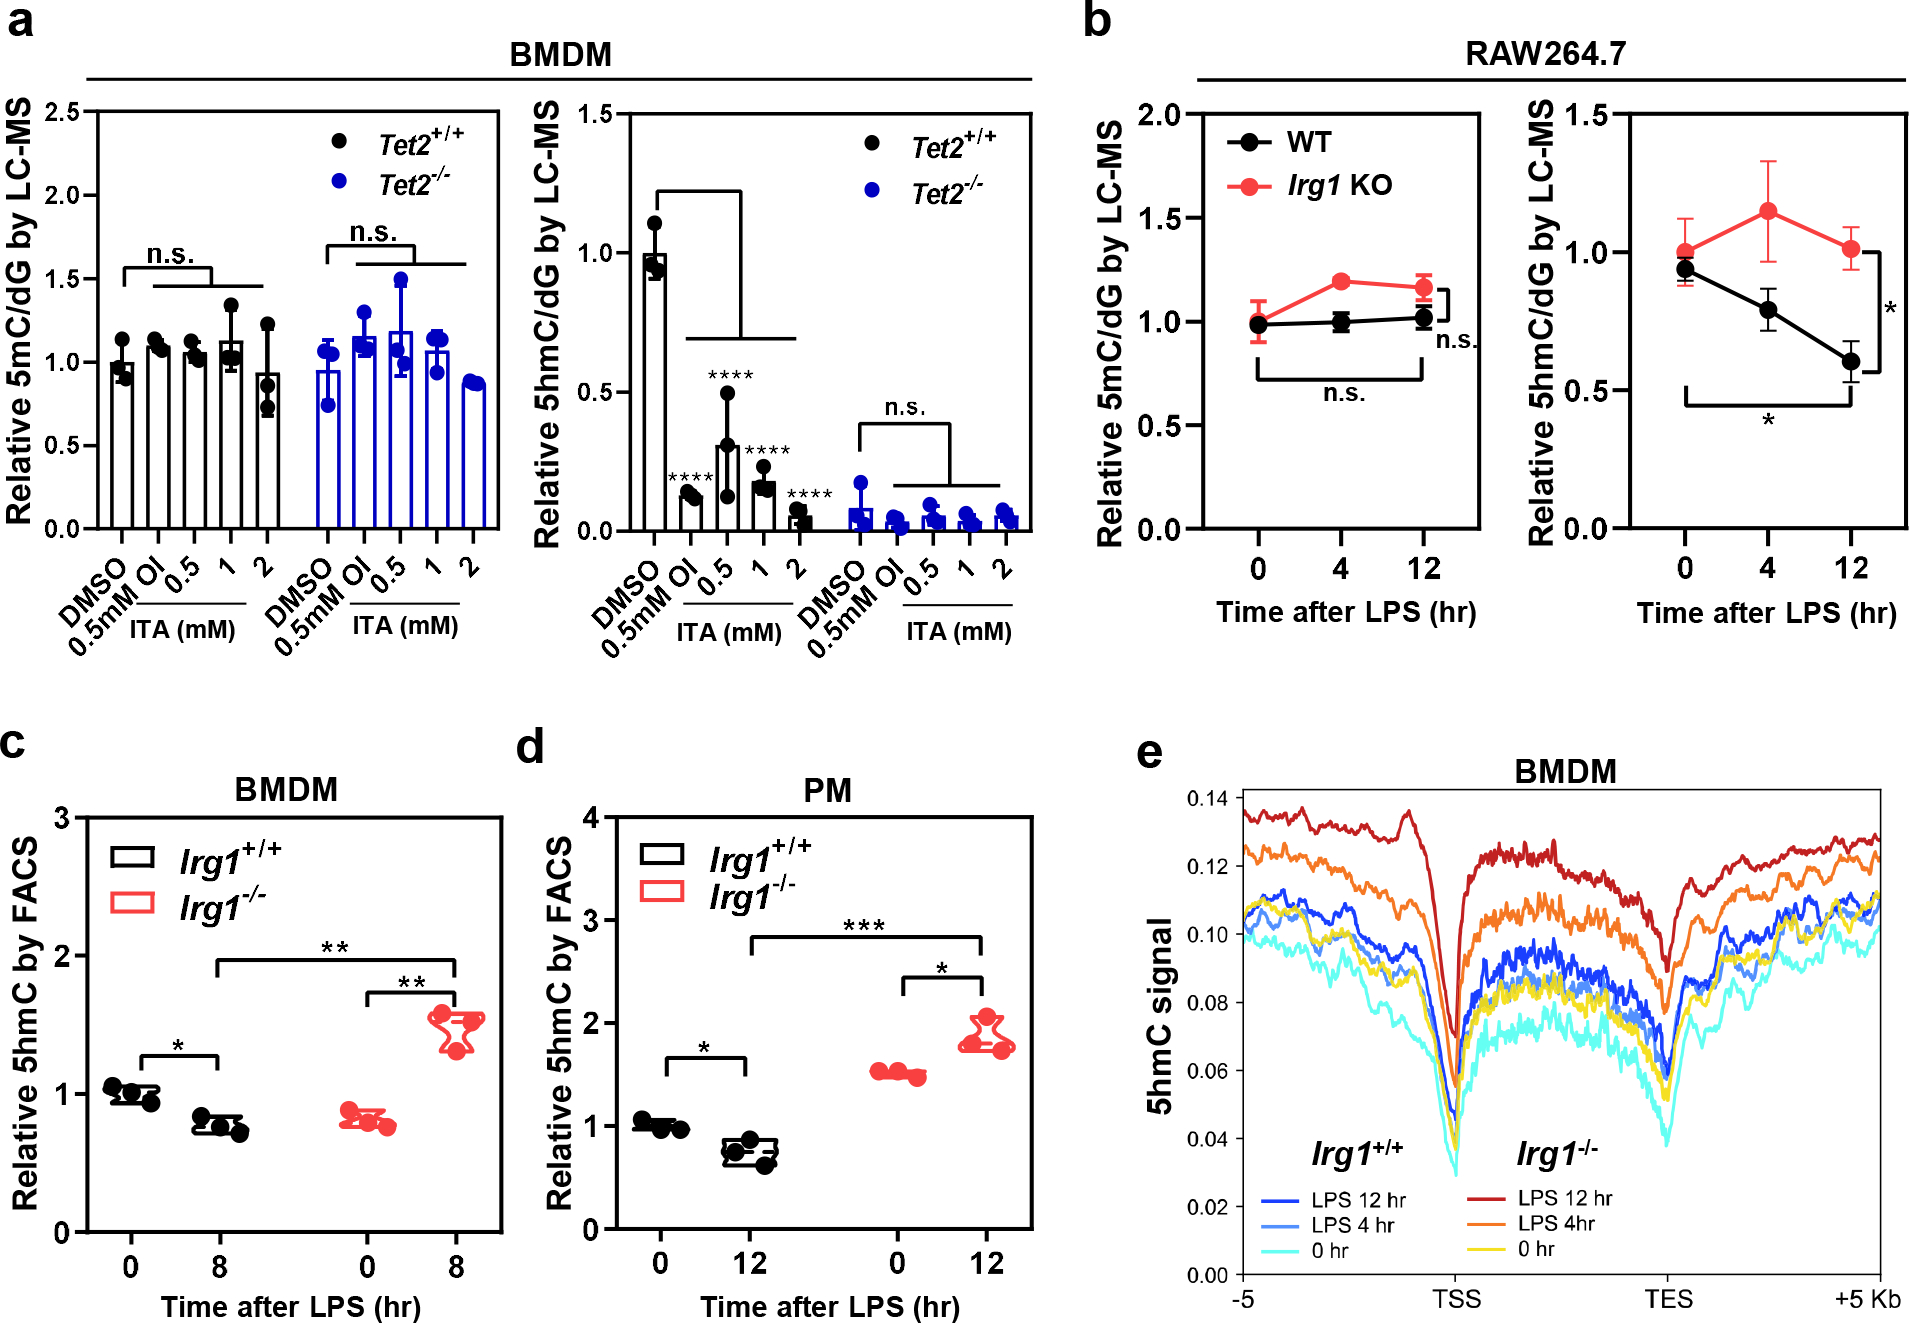
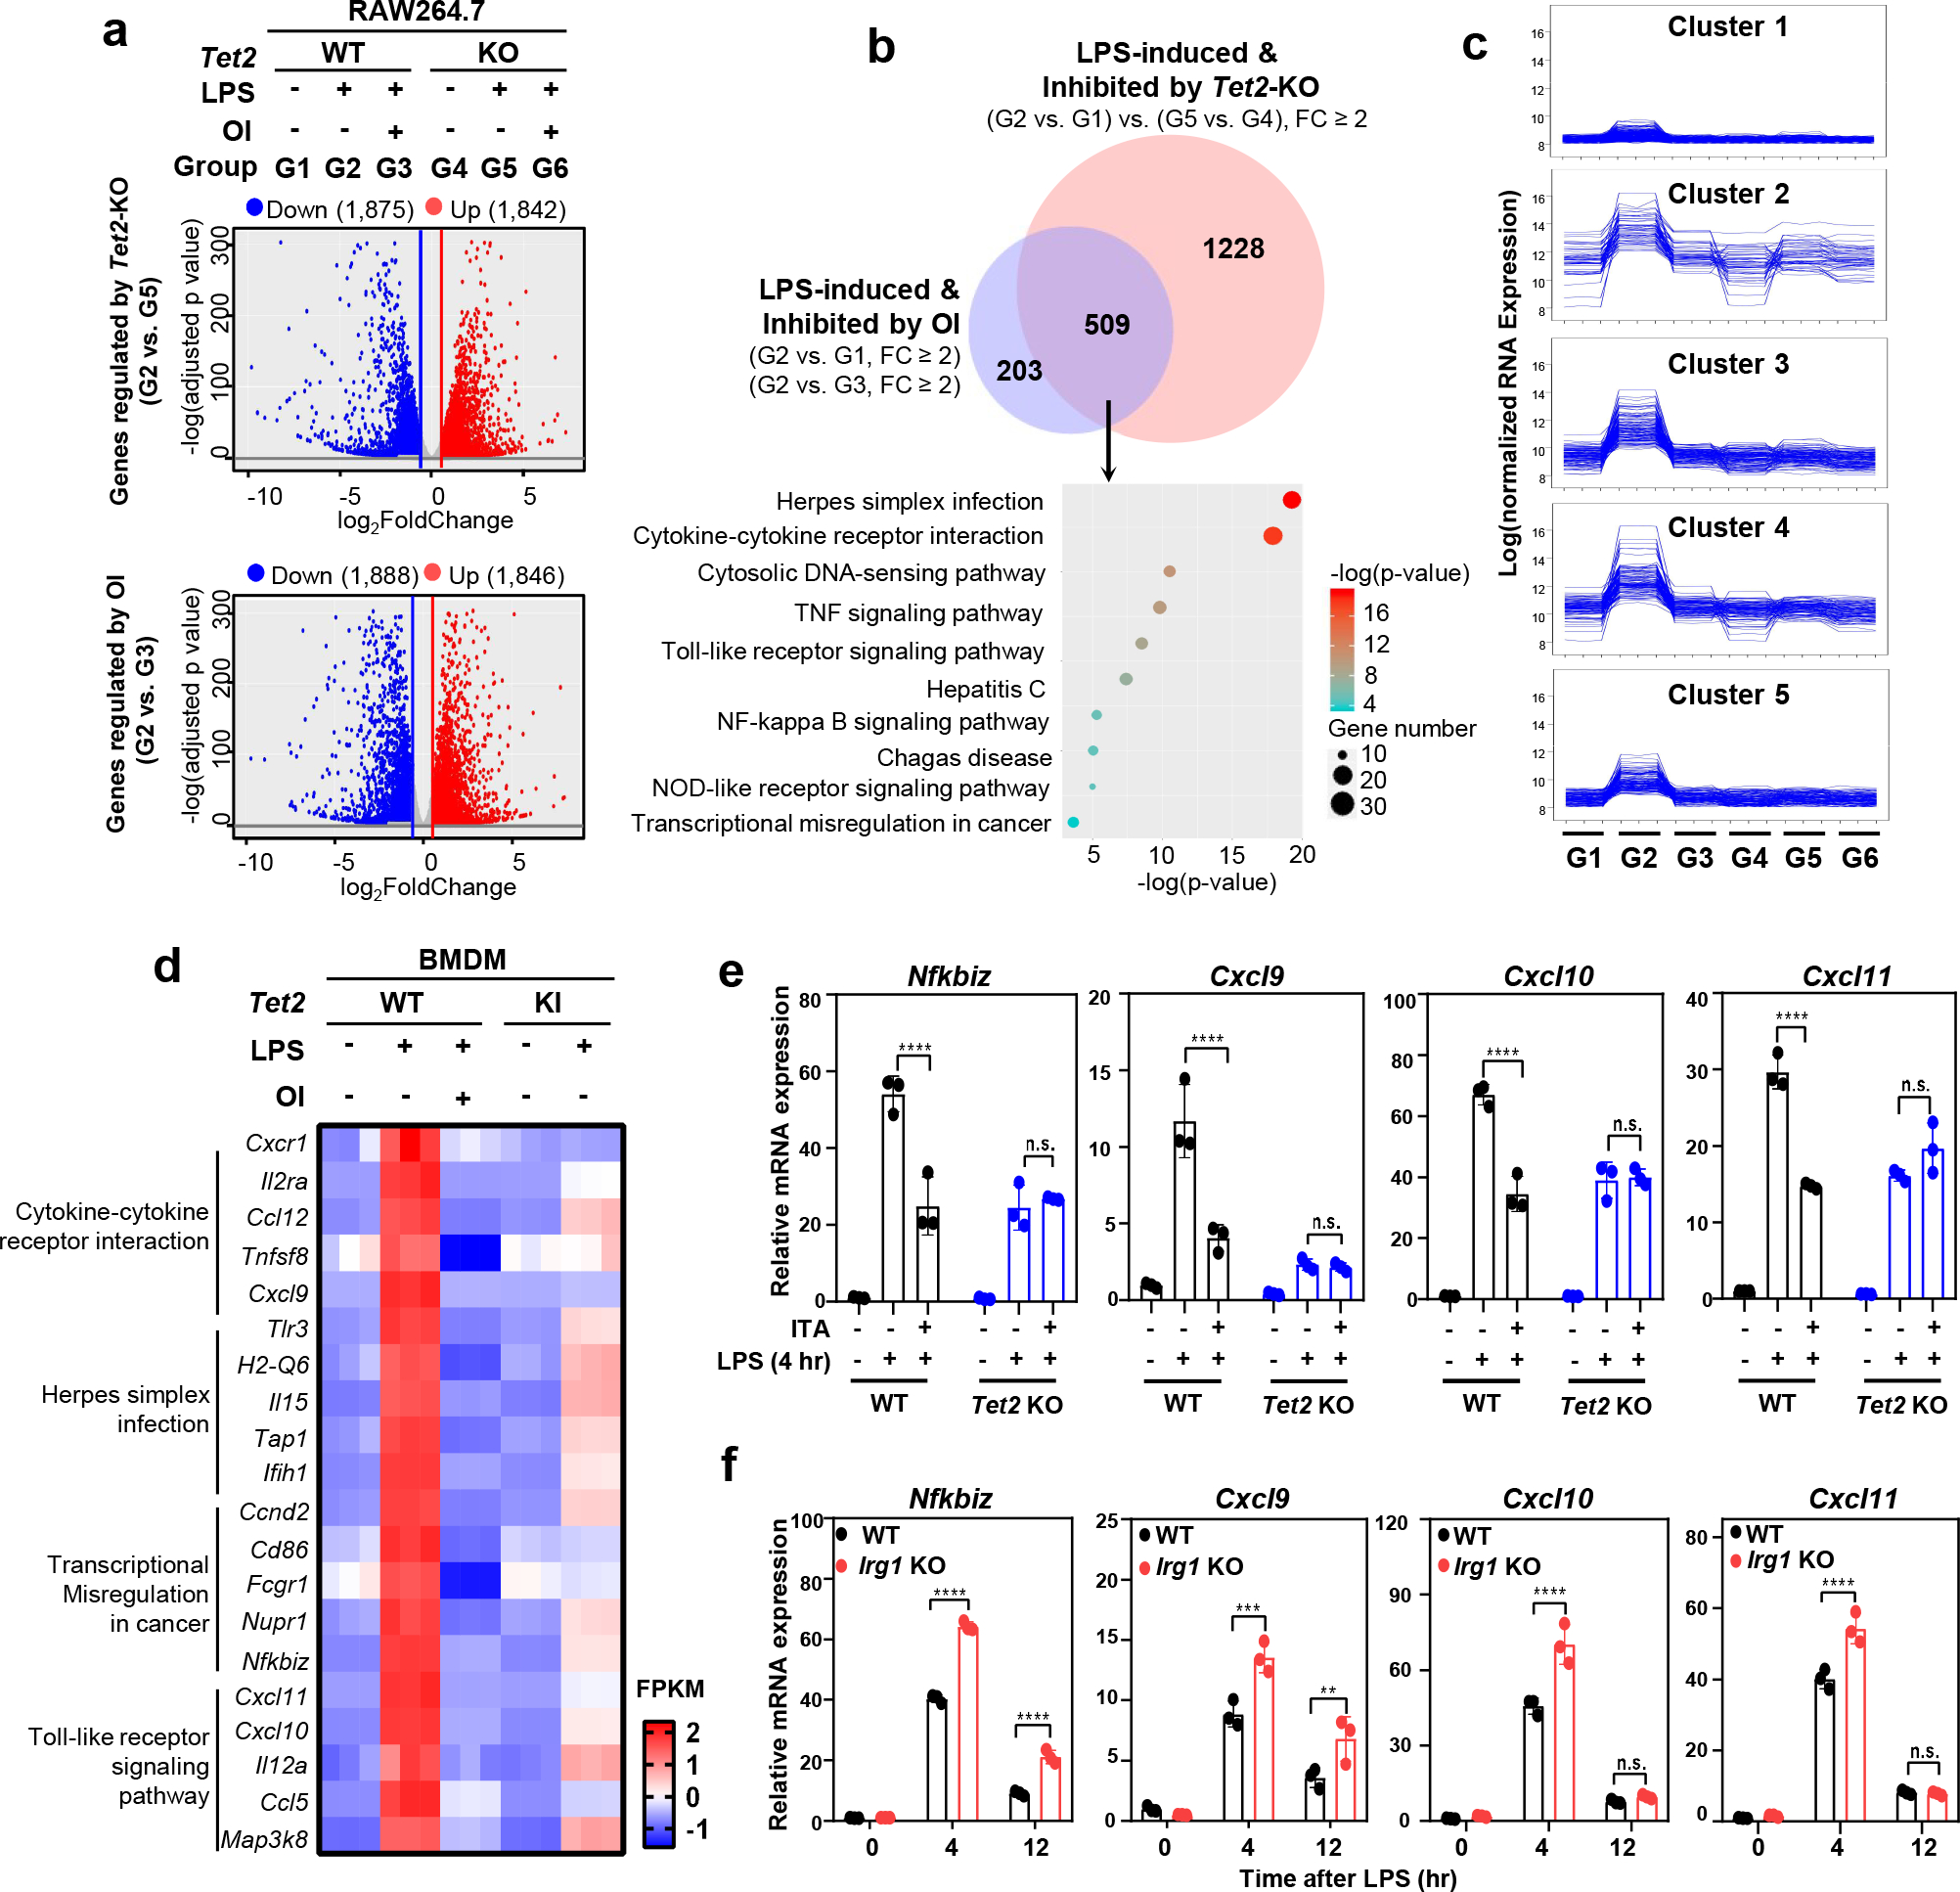
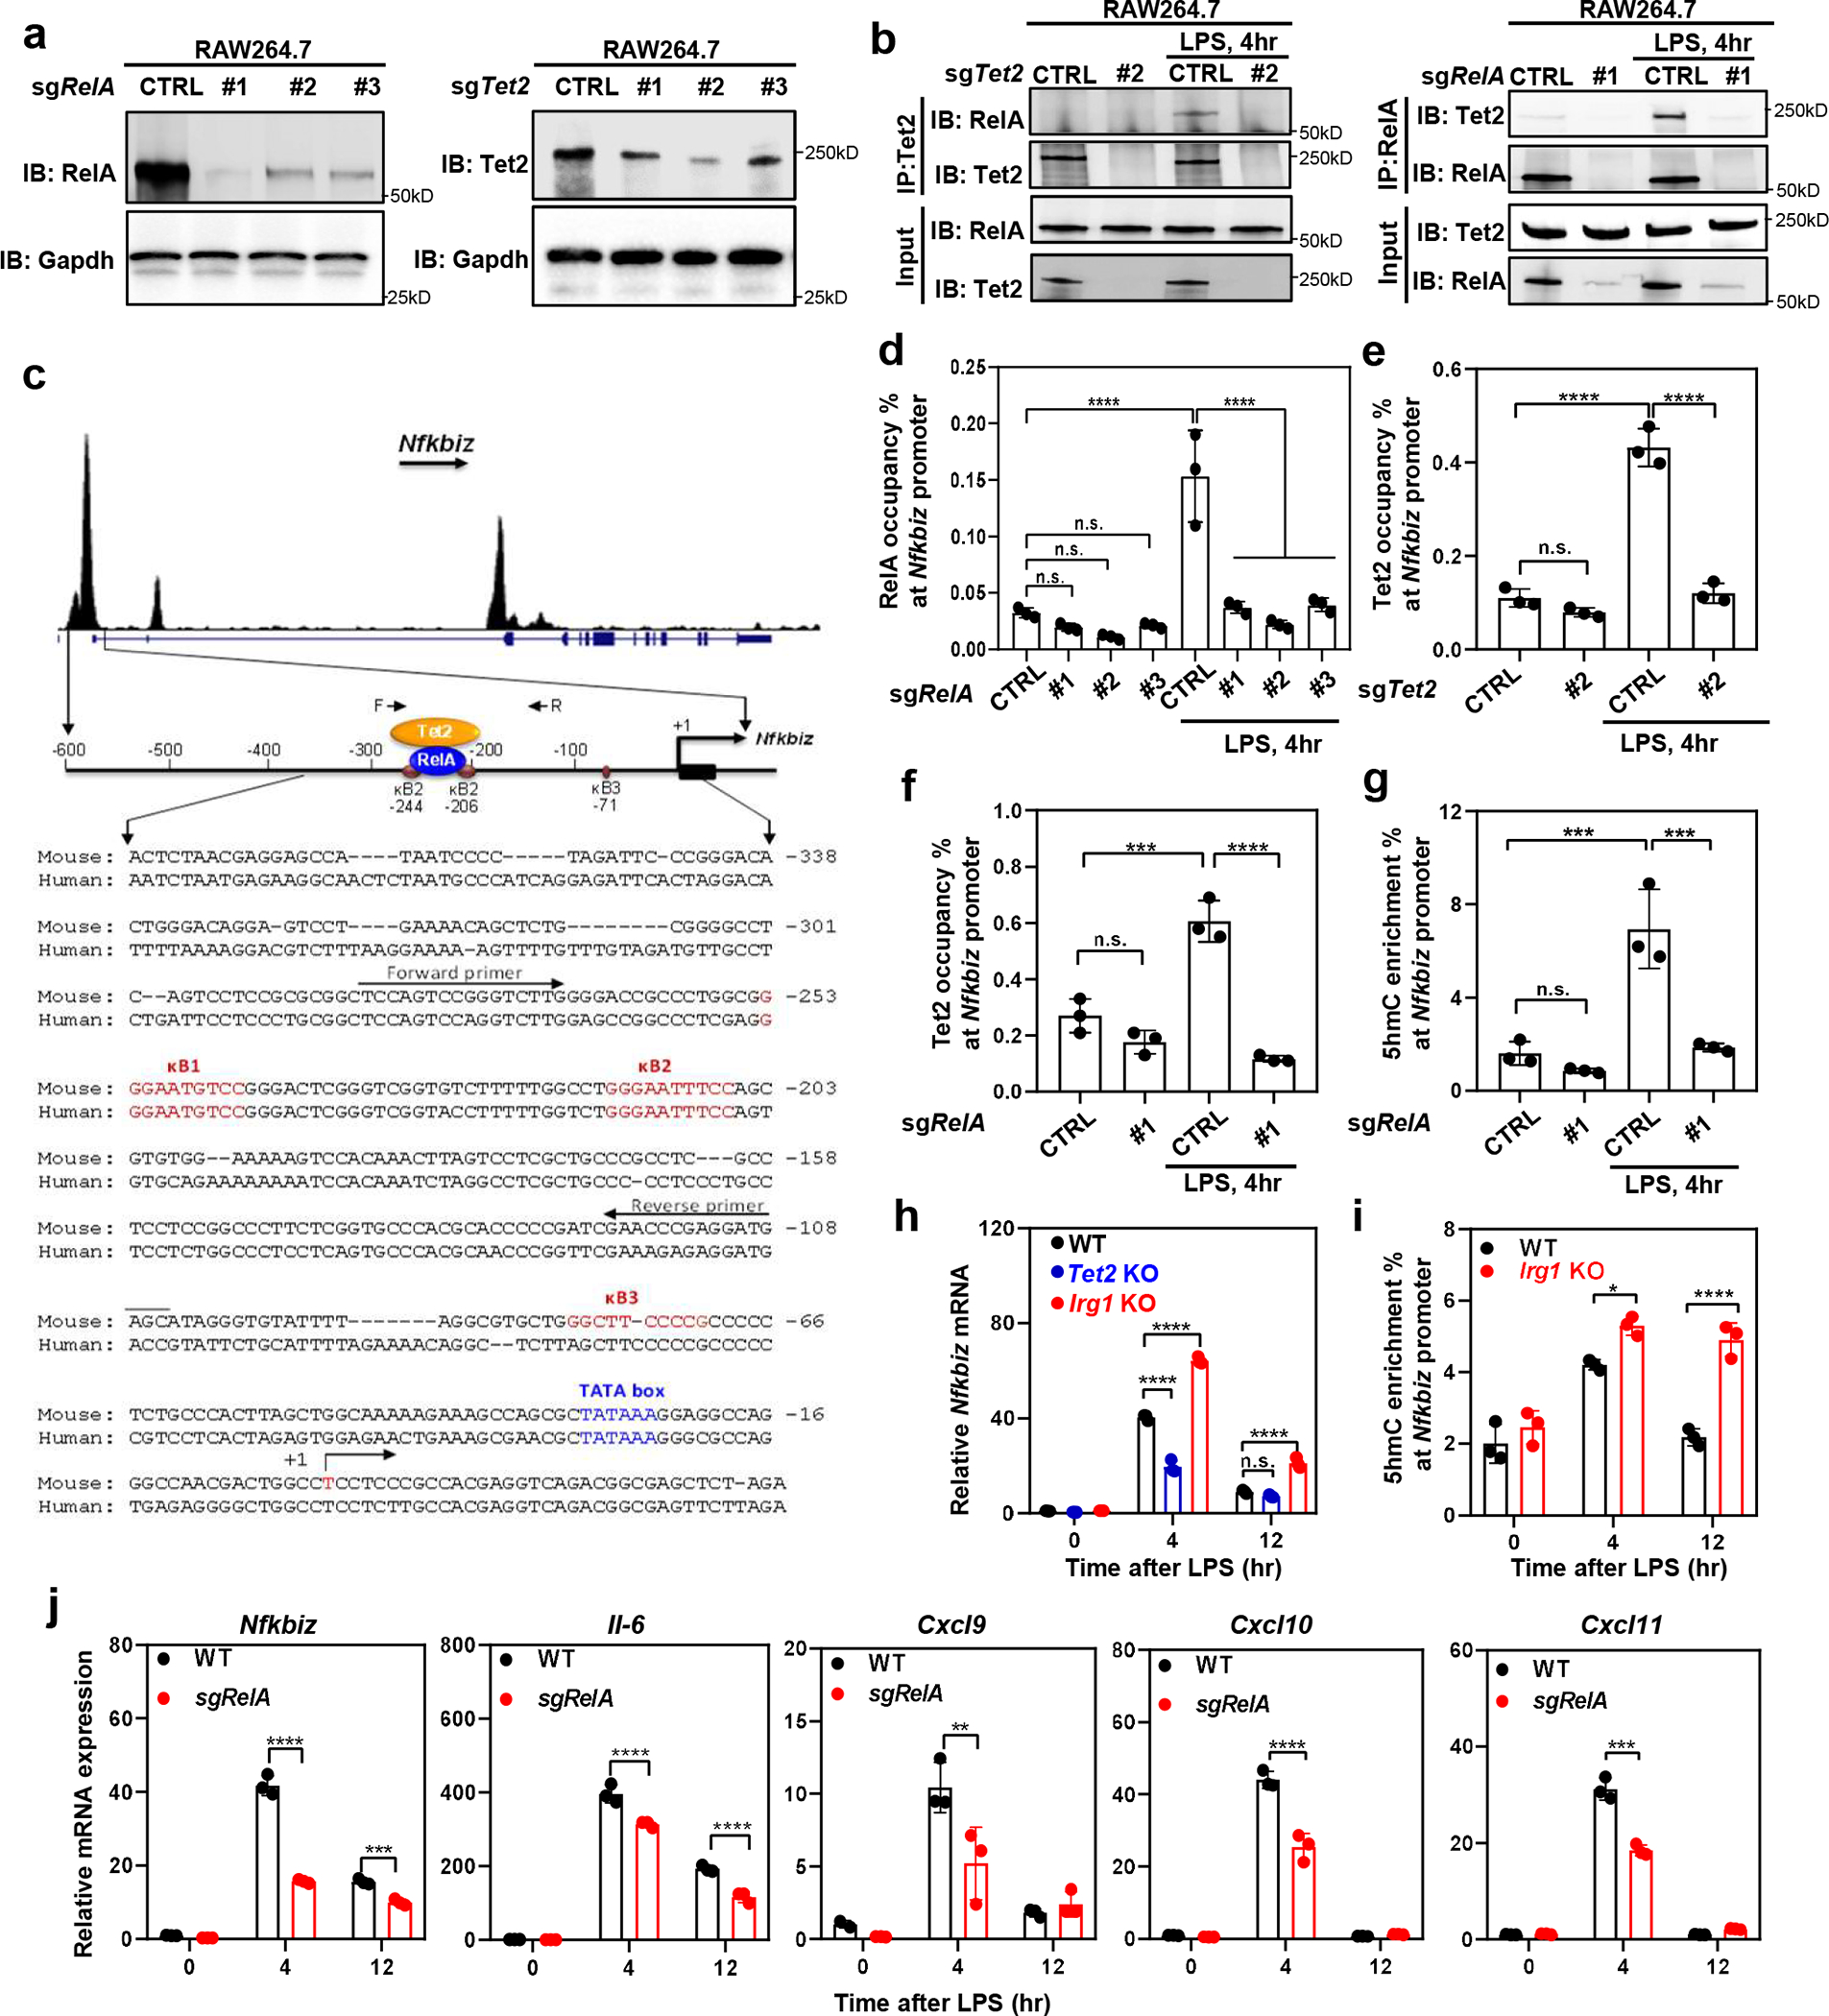
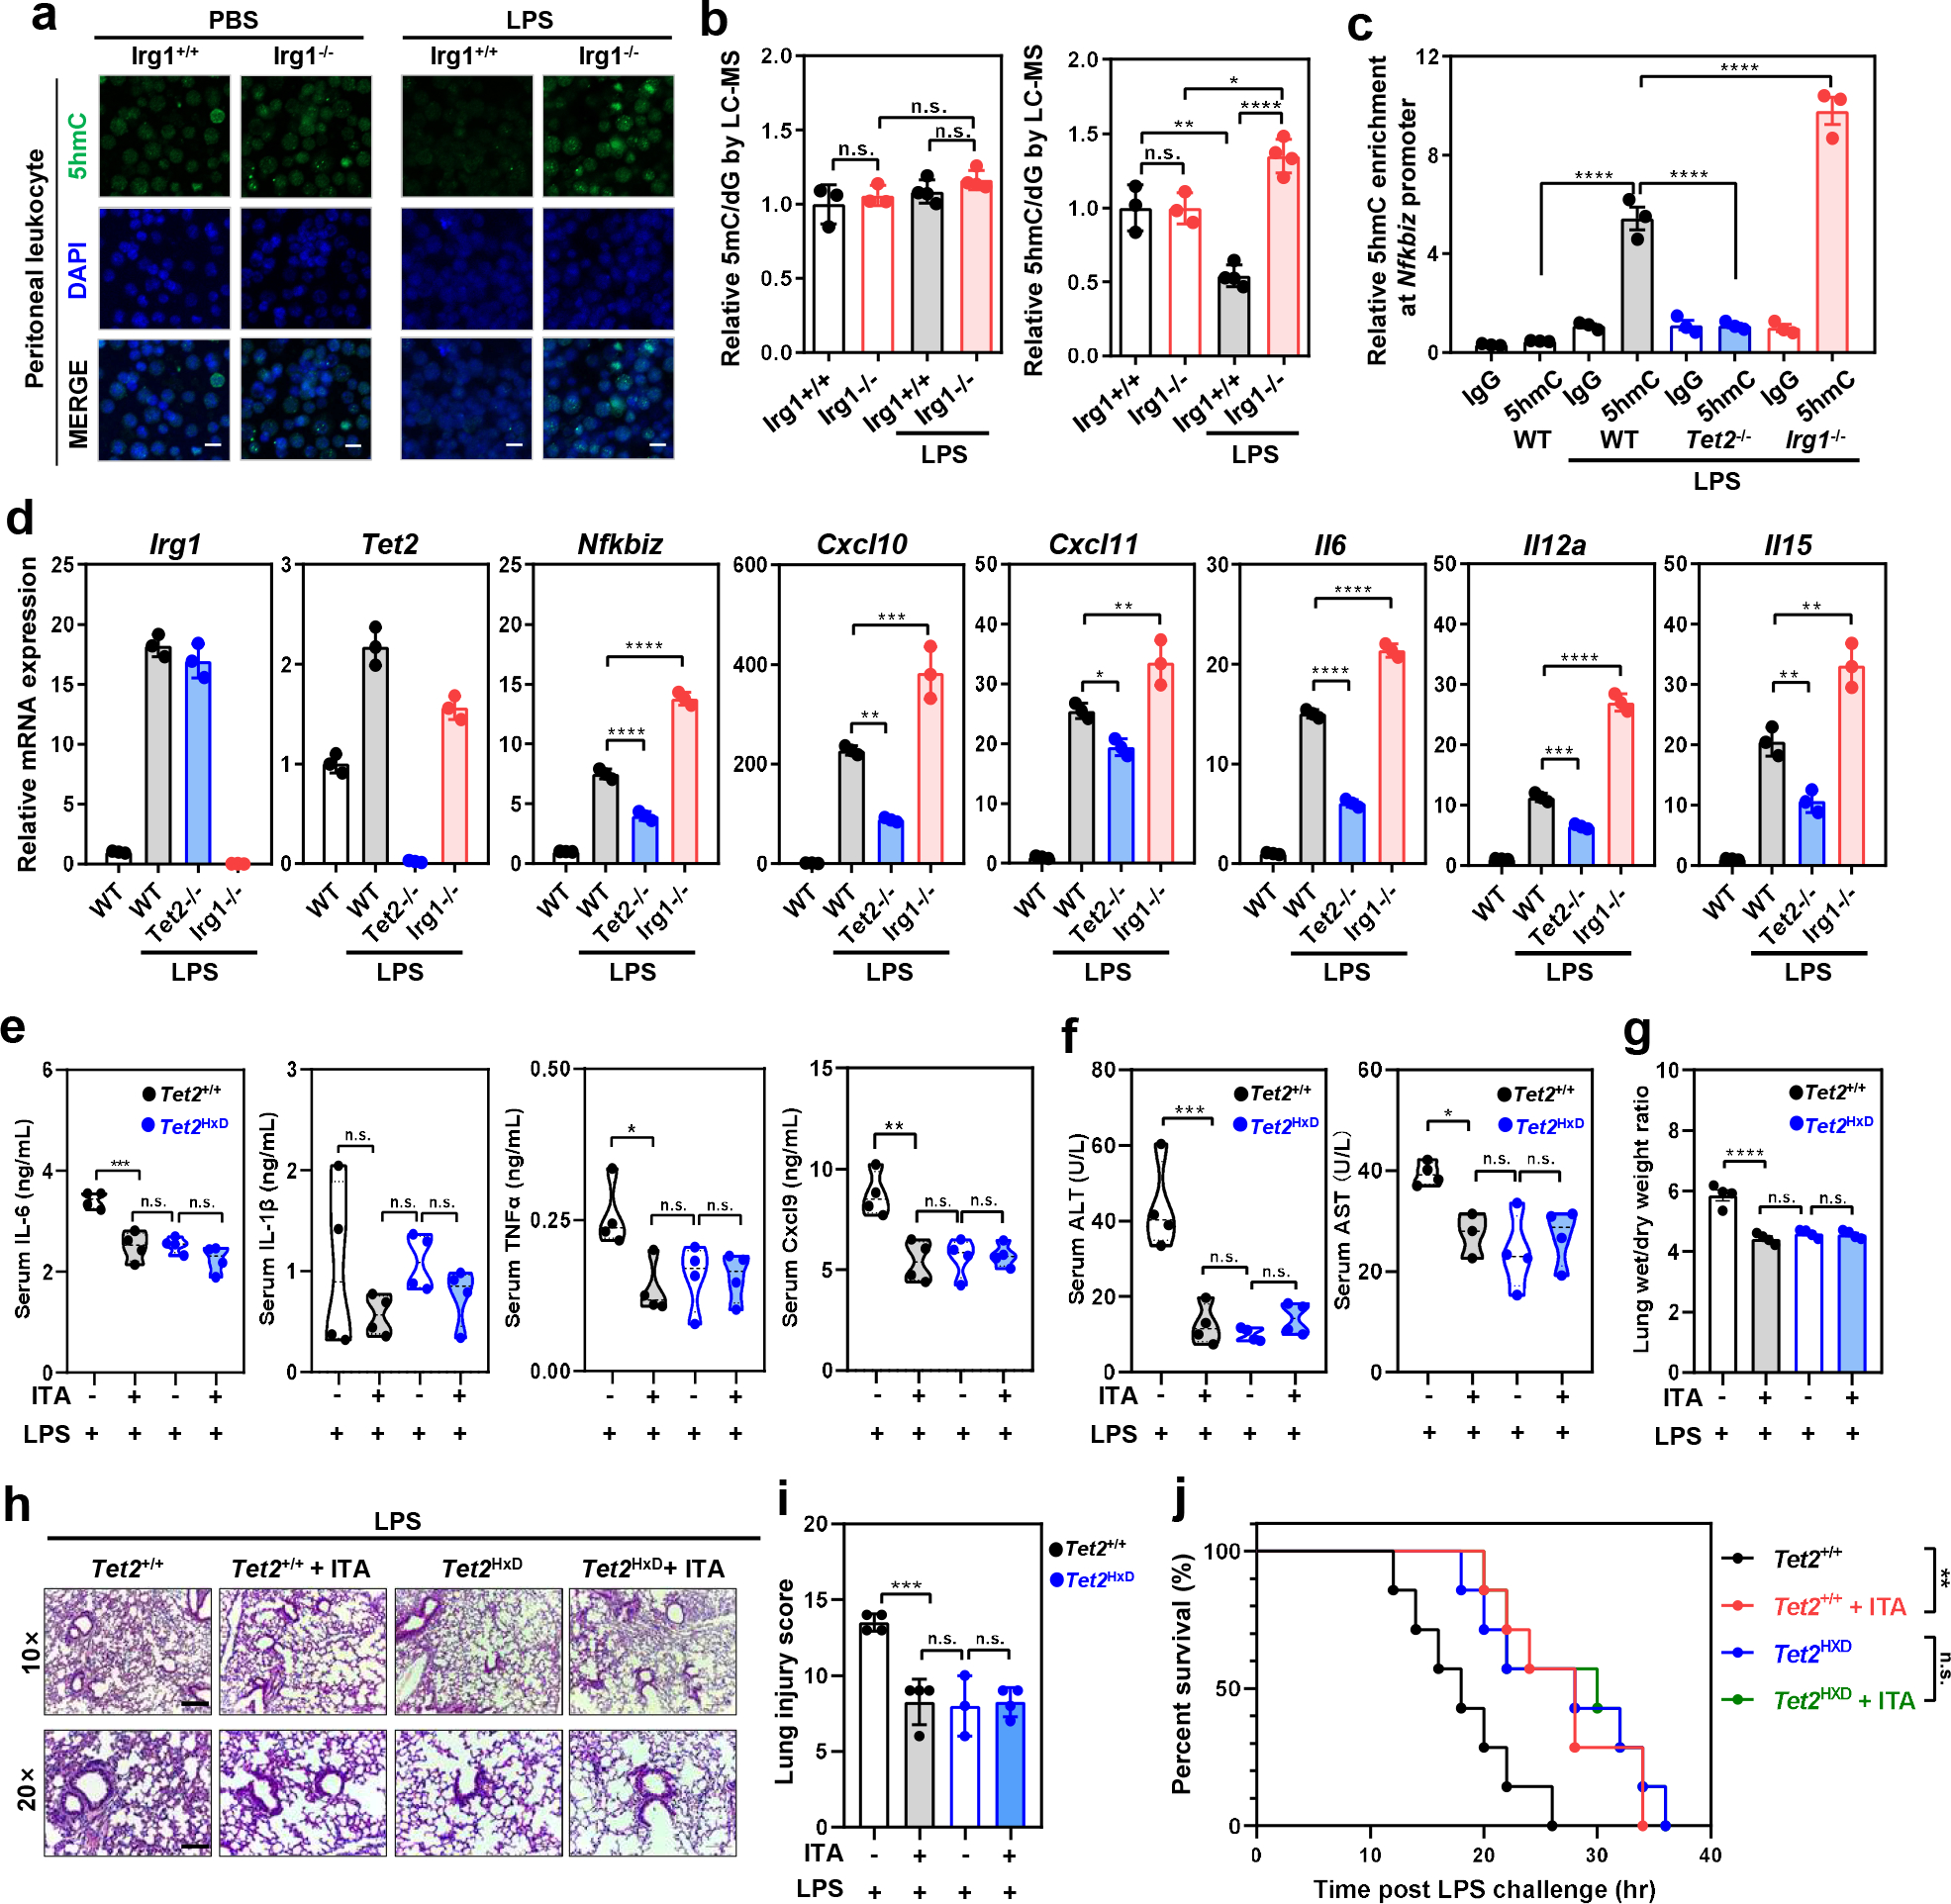
As one of the most induced genes in activated macrophages, immune-responsive gene 1 (IRG1) encodes a mitochondrial metabolic enzyme catalysing the production of itaconic acid (ITA). Although ITA has an anti-inflammatory property, the underlying mechanisms are not fully understood. Here we show that ITA is a potent inhibitor of the TET-family DNA dioxygenases. ITA binds to the same site on TET2 as the co-substrate α-ketoglutarate, inhibiting TET2 catalytic activity. Lipopolysaccharide treatment, which induces Irg1 expression and ITA accumulation, inhibits Tet activity in macrophages. Transcriptome analysis reveals that TET2 is a major target of ITA in suppressing lipopolysaccharide-induced genes, including those regulated by the NF-κB and STAT signalling pathways. In vivo, ITA decreases the levels of 5-hydroxymethylcytosine, reduces lipopolysaccharide-induced acute pulmonary oedema as well as lung and liver injury, and protects mice against lethal endotoxaemia, depending on the catalytic activity of Tet2. Our study thus identifies ITA as an immune modulatory metabolite that selectively inhibits TET enzymes to dampen the inflammatory responses.


Conflict of interest statement

Competing interests

The authors declare no competing interests.

Figures

Extended Data Fig. 1
Extended Data Fig. 1. Itaconate inhibits the catalytic activity of Tet2 in vitro
a, Computational modeling of TET2-metabolites binding. Current TET2 crystal reveals the binding of indicated metabolites with TET2. The high resolution 2.03 Å structure of TET2 in complex with N-oxalylglycine (NOG) in PDB entry 4NM6 was used as the basis for modeling α-KG and the related oncometabolites. While keeping the Fe(II), protein and solvent heavy atoms fixed, polar hydrogens in the binding site and the ligands were optimized using the MMFF94 energy potential with a reaction field solvation model as implemented in MOE.2018. b, IC50 of indicated metabolites toward purified mTET2CD measured by using a commercial kit (EpiGentek). Enzyme activity was analyzed using GraphPad software and IC50 values were calculated using the equation of log (inhibitor) vs. response (three parameters). Data represent three independent experiments with similar results. c, R1896M or S1898F mutation reduces TET2 enzyme activity. As shown, both R1896 and S1898 are α-KG binding sites in the catalytic domain (CD) of human TET2 (upper panel). In vitro TET2 activity was determined by 5hmC dot-blot assays using human TET2CD purified from bacteria, as well as methylated dsDNA oligonucleotides as substrates (lower panel). Data represent two independent experiments with similar results. d, R1896M mutation, but not S1898F mutation, weakens the binding of TET2 with α-KG. STD NMR spectroscopy was used to determine the binding of α-KG with recombinant proteins of TET2CD mutant. Data represent two independent experiments with similar results.
Extended Data Fig. 2
Extended Data Fig. 2. Octyl-ITA (OI) can enter the cells and be hydrolyzed to itaconate
a, OI can enter and accumulate in the cell. RAW264.7 cells were treated with different concentrations of OI for different lengths of time, followed by LC-MS/MS analysis of intracellular ITA. Data shown represent average values with S.D. of three independent experiments. b, Unmodified ITA can enter and accumulate in the cell. RAW264.7 cells were treated with increased concentrations of ITA as indicated, and the intracellular concentration of ITA and succinate was measured by LC-MS/MS. Data shown represent average values with S.D. of four independent experiments. c, Intracellular accumulation of cell-permeable metabolites. HEK293T cells were treated with cell-permeable octyl-ITA and octyl-L-2-HG for 12 hours as indicated, and the intracellular levels of L-2HG and ITA were quantified by LC-MS/MS. Shown are average values of 2 independent experiments. The intracellular concentrations of indicated metabolites are shown.
Extended Data Fig. 3
Extended Data Fig. 3. Itaconate inhibits Tet activity in cells
a, HEK293T cells were transiently overexpressed with HA-tagged mTET2CD or catalytic inactive mutant (referred to as mTET2CM), and then treated with indicated cell-permeable metabolites. Global 5hmC was detected by immunofluorescence. Scale bar, 20 μΜ. b, TET2-overexpressing HEK293T cells in (a) were treated with indicated OI either alone or together with increasing amount of Dimethyl-α-KG. Global 5hmC was detected by immunofluorescence. Scale bar, 20 μM. Data in (a-b) represent two independent experiments with similar results c, HEK293T cells were transiently overexpressed with Flag-tagged human full-length TET3. The expression of TET3 was determined by western blot with indicated antibodies. A representative blot of two independent experiments is shown. d, TET3-overexpressing HEK293T cells in (c) were treated with indicated concentrations of OI or ITA. The intracellular levels of ITA and succinate were measured by LC-MS/MS. Data shown are average values of 2 independent experiments. e, f, TET3-overexpressing HEK293T cells in (c) were treated with indicated concentrations of OI or unmodified ITA, and then global 5hmC was detected by dot-blot (e) and LC-MS/MS (f). Data shown in (f) are average values with S.D. of 3 independent experiments. g, TET2-overexpressing HEK293T cells in (a) were treated with different amounts of cell-permeable ITA or L-2-HG as indicated, and histone methylation markers were determined by western blot with indicated antibodies. A representative blot of two independent experiments is shown. h, Tet2+/+ and Tet2−/− BMDMs were treated with 0.5 mM OI or increased concentrations of unmodified ITA for 8 hours, followed by LC-MS/MS analysis to determine intracellular ITA. Data shown are average values with S.D. of 3 independent experiments. i, Wildtype BMDMs were treated with DMSO or 0.5 mM OI for 8 hours, followed by 5hmC mapping by hMeDIP-seq. The normalized density profile for 5hmC across gene body + 5kb flanking regions is shown. The experiment was performed once. P values are calculated using one-way ANOVA for multiple comparisons (f). ****denotes p < 0.0001 for the indicated comparison.
Extended Data Fig. 4
Extended Data Fig. 4. LPS induces Itaconate and metabolic reprogramming in macrophages
a, b, Irg1 mRNA and protein expression in RAW264.7 cells after LPS treatment, as determined by qRT-PCR and western blot, respectively. Data shown in (a) are average values of 2 (time points: 1–12 hours) or 3 (time points: 0/0.5/24 hours) independent experiments c, d, LPS-induced ITA accumulation in Irg1-WT but not Irg1-KO RAW264.7 cells. Irg1 protein was detected by western blot (c), and the intracellular concentration of ITA was measured by LC-MS/MS (d). Data shown in (d) are average values of 2 independent experiments. A representative blot of two independent experiments is shown in (b) and (c). e, Succinate but not fumarate and 2-HG is accumulated, while α-KG is decreased upon LPS treatment in RAW264.7 cells. The intracellular concentrations of indicated metabolites were measured by LC-MS/MS. Data shown are average values of 2 independent experiments (left) or average values with S.D. of 3 independent experiments (right).
Extended Data Fig. 5
Extended Data Fig. 5. LPS-induced Itaconate inhibits Tet activity in macrophages
a, In RAW264.7 and mouse BMDMs, relative mRNA expression of Tet1, Tet2 and Tet3 was determined by RNA-seq and plotted according to the fragments per kilobase of transcript per million mapped reads (FPKM) values. Fold changes in Tet gene expression for the indicated comparison are shown. Data shown are average values with S.D. of 3 independent experiments. b, c, LPS treatment reduces genome-wide 5hmC in Irg1-WT but not Irg1-KO RAW264.7 cells. 5hmC was determined by IF staining (b) and FACS (c) in cells after LPS treatment for indicated time. Scale bar, 50 μm. Data shown in (c, right) are average values of 2 independent experiments. d, LPS-triggered 5hmC decline is not due to succinate accumulation in macrophages. Irg1-KO RAW264.7 cells were treated with 3-NPA (1 mM), which specifically inhibits SDH and causes intracellular accumulation of succinate (left panel, data shown are average values with 2 independent experiments). Genomic levels of 5mC and 5hmC were determined by LC-MS/MS in these cells after LPS treatment for indicated time (middle and right panels, data shown are average values with S.D. of 3 independent experiments). e, α-KG restores LPS-induced 5hmC decrease in RAW264.7 cells. Macrophages were challenged with LPS for 12 hours and then treated dimethyl-α-KG (1 mM) for 12 hours. Genomic 5hmC was detected by IF staining. Scale bar, 25 μm. f, RAW264.7 cells were treated with LPS for indicated time, and then histone methylation markers were determined by western blot using indicated antibodies. g, h, Mouse BMDMs (g) and thioglycolate elicited peritoneal macrophages (h) were from Irg1+/+ or Irg1−/− mice (n=3 mice per group), and then were either unstimulated or treated with LPS for indicated time. The levels of Tet2 and Irg1 proteins were determined by western blot using indicated antibodies. P values are calculated using one-way ANOVA (g, h) for multiple comparisons. *denotes p < 0.05, **denotes p < 0.01, and ***denotes p < 0.001 for the indicated comparison. n.s. = not significant. Data represent two independent experiments with similar results in (b, e, f)
Extended Data Fig. 6
Extended Data Fig. 6. Tet2 is the major target of Itaconate in macrophages during LPS response
a, Principal component analysis (PCA) on the effect of OI treatment and Tet2 deletion on gene expression in LPS-treated RAW264.7 cells. 3D representation of different color-coded RNA-seq data sets corresponding to different Tet2 genotype, LPS and OI treatments. RNA-seq was performed using three biological replicates. b, 1,846 genes which are down-regulated by OI in Tet2-WT RAW264.7 cells are compared with 807 gene which are down-regulated by OI in Tet2-KO cells (FC ≥ 2). As shown, only 493 (of 1,846) genes were commonly down-regulated by OI in both Tet2-WT and Tet2-KO cells. c, Identification of LPS-induced genes that are inhibited by OI. The overlap of LPS-induced genes (FC ≥ 2) and OI-inhibited genes (FC ≥ 2) was displayed by Venn diagram (P-value < 10–10). 712 genes were identified and then used for KEGG pathway analysis by online DAVID analysis. Top 10 pathways are listed. d, 712 genes which are induced by LPS and down-regulated by OI in Tet2-WT RAW264.7 cells are compared with 807 gene which are down-regulated by OI in Tet2-KO cells (FC ≥ 2). As shown, only 135 (of 712) genes were commonly down-regulated by OI in both Tet2-WT and Tet2-KO cells. e, f, Verification of the Tet2 H1795R KI mice. The KI mutation was confirmed by DNA sequencing (e). Catalytic inactivation of Tet2 was confirmed by 5hmC dot-blot using genomic DNA from hepatocytes (f). The experiments in e–f were performed once. g, Overlap between LPS-induced genes down-regulated by OI and by H1795R catalytical inactivation in Tet2 in BMDMs is displayed by Venn diagram (p-value < 10–10). Top 10 pathways enriched among the overlapping genes were identified by KEGG pathway analysis.
Extended Data Fig. 7
Extended Data Fig. 7. Itaconate inhibits Tet2-mediated LPS induction of Nfkbiz and other inflammatory genes
a, Unmodified ITA inhibits LPS-induced genes in a Tet2-dependent manner. Tet2-WT and Tet2-KO RAW264.7 cells were pre-treated with unmodified ITA (3 mM) and then stimulated with LPS for 4 hours, following detection of the indicated gene mRNA expression by qRT-PCR. b, Addition of OI in a limited time window inhibits LPS-induced genes, mimicking the effect of Tet2 deletion. RAW264.7 cells were stimulated with LPS for 2 hours before endogenous ITA starts to accumulate, and then treated with OI for another 2 hours, following determination of indicated gene mRNA expression by qRT-PCR. Shown are average values with S.D. of three independent experiments. P values are calculated using two-way ANOVA for multiple comparisons. *denotes p < 0.05, **denotes p < 0.01, ***denotes p < 0.001, and ****denotes p < 0.0001 for the indicated comparison. n.s. = not significant.
Extended Data Fig. 8
Extended Data Fig. 8. Itaconate inhibits Tet2-mediated LPS induction of ΙκΒζ
a, b, Gene expression of all detectable NfκB family members in RAW164.7 cells (a) and BMDMs (b) with indicated treatments was determined by RNA-seq and represented by heatmaps. c, Tet2 deletion inhibits LPS-induction of Nfkbiz gene expression in RAW264.7 cells. Tet2-WT and Tet2-KO macrophages were treated with LPS for indicated time. Nfkbiz mRNA was determined by qRT-PCR. Data shown are average values with S.D. of 3 independent experiments. d, Both ITA and Tet2 deletion inhibits LPS-induction of Nfkbiz. Tet2-WT and Tet2-KO RAW264.7 cells were treated with either LPS alone or with 01 and the level of Nfkbiz mRNA was determined by qRT-PCR. Data shown are average values with S.D. of 3 independent experiments. e, α-KG activates Nfkbiz mRNA expression in RAW264.7 cells. Macrophages were treated with increased concentrations (0.5,1, 2 mM) of Dimethyl-α-KG together with LPS as indicated. Nfkbiz mRNA was determined by qRT-PCR. Data shown are average values with S.D. of 3 independent experiments. f, α-KG elevates Nfkbiz mRNA level in Tet2-dependent manner. Tet2-WT and Tet2-K0 RAW264.7 cells were treated with either LPS alone or with cell-permeable α-KG, and the level of Nfkbiz mRNA was determined by qRT-PCR. Data shown are average values with S.D. of 3 independent experiments. g, h, α-KG restores ΙκΒζ protein blocked by ITA in a Tet2-dependnet manner. Tet2-WT (g) but not Tet2-K0 (h) RAW264.7 cells were treated with LPS and cell-permeable ITA and α-KG as indicated. The levels of ΙκΒζ protein were measured by western blot and normalized against Gapdh. A representative blot of two independent experiments is shown in (g, h). P values are calculated using two-tailed Student’s t-test for paired comparisons (c), one-way ANOVA (e, d) and two-way ANOVA (f) for multiple comparisons. **denotes p < 0.01, ***denotes p < 0.001, and ****denotes p < 0.0001 for the indicated comparison, n.s. = not significant.
Extended Data Fig. 9
Extended Data Fig. 9. Irgl-deficient mice are more susceptible to LPS-induced acute lung injury and mortality
a, Flowchart for establishing LPS-induced sepsis mouse model. Briefly, age and sex-matched Irg1−/− or Irg1+/+ mice were i.p. injected with PBS or LPS (20 mg/kg). At 4- or 24-hours post LPS injection, peritoneal leukocytes, serum, and lung were harvested for further analysis. b, LPS induces ITA accumulation in Irg1+/+ peritoneal leukocytes, but not in those from Irg1−/− mice. Peritoneal leukocytes were freshly isolated as described above in (a), and the intracellular concentration of ITA was measured by LC-MS/MS (n=2–3 mice per group). c, LPS-challenged Irg1−/− mice exhibit higher serum Il-6 levels than Irg1+/+ controls, as determined by ELISA (n=3–7 mice per group). d, e, LPS-challenged Irg1−/− mice exhibit more severe lung injury than Irg1+/+ controls. As described above in (a), mouse lungs were harvested and then subjected to histopathological analysis (n=3–6 mice per group). Representative photomicrographs of HE staining are shown (d). Scale bar, 200 μm (upper panels) & 100 μm (lower panels). f, Irg1−/− mice are more susceptible to LPS-induced mortality. Kaplan-Meier survival curves were determined as described in Methods (n=10 mice per group). Shown in b, c and e are average values with S.D. P values are calculated using one-way ANOVA for multiple comparisons (c, e). As for the percent survival, P values were determined using log-rank (Mantel-Cox) test comparing each 2 groups (f); *denotes p < 0.05, **denotes p < 0.01 and ****denotes p < 0.0001 for the indicated comparison.
Extended Data Fig. 10
Extended Data Fig. 10. Itaconate reduces LPS-induced mouse mortality in a manner dependent on Tet2.
a, Mice were i.p. injected with ITA prior to LPS challenge (25 mg/kg, n=3 mice per group; left panel). At 2 hours post LPS, peritoneal leukocytes and lung were freshly isolated and then subjected to determination of genomic 5hmC and 5mC by LC-MS/MS (right panels). b,c,d As described above in (a), mice were i.p. injected with ITA prior to LPS challenge (n=6–10 mice per group). At 2 hours post LPS, lung tissues were harvested and then subjected to the wet/dry weight ratio calculation (b). Meanwhile, lung histopathological injury was assessed by HE staining and the injury score was determined as described in method (c, d). Representative photomicrographs are shown. Scale bar, 200 μm (upper panels) & 100 μm (lower panels). e,f, As described above in (a), mice were i.p. injected with ITA prior to LPS challenge (Tet2+/+, n=13 mice; Tet2+/+, n=14 mice; Tet2−/−, n=7 mice per group). The animal survival was carefully monitored and Kaplan-Meier survival curves were determined as described in Methods. g, Flowchart for developing chimeric mice by bone marrow transplantation (BMT). h, i, The Kl mutations were confirmed by DNA sequencing in bone marrow samples of transplanted animals (h). Catalytic inactivation of Tet2 was also confirmed by 5hmC LC-MS/MS using genomic DNA from bone marrow samples of transplanted animals j, A schematic model for Itaconate inhibits TET2 to dampen inflammatory response. Shown are average values with S.D. (a, i) or SEM (b, d). P- values are calculated using two-tailed Student’s t-test for paired comparisons (i) or one-way ANOVA for multiple comparisons (a, b, d); As for the percent survival, P values were determined using log-rank (Mantel-Cox) test comparing each 2 groups; *denotes p < 0.05, **denotes p < 0.01, ***denotes p < 0.001, and ****denotes p < 0.0001 for the indicated comparison, n.s. = not significant.
Figure 1.
Figure 1.. Irg1 expression reduces Tet2-catalyzed 5hmC production in cells
a, Schematic diagram of experimental procedures to determine the effect of Irg1 expression on global histone and DNA de/methylation. b, Overexpression of Irg1, but not catalytic-inactive mutant, results in elevated intracellular levels of ITA and succinate. Flag-tagged WT or H103A/K207E/K272E mutant Irg1 (referred to as Irg1mut) was transiently overexpressed in HEK293T cells, and the intracellular levels of metabolites were determined by LC-MS/MS. c, Overexpression of Irg1 does not significantly affect global histone demethylation markers. Transfected HEK293T cells in (b) were subjected to histone methylation quantification by MRM-based LC-MS/MS. d, Overexpression of Irg1, but not Irg1mut, inhibits Tet2 activity. Flag-tagged wild-type Irg1 or catalytic defect mutant was co-expressed with HA-mTET2CD in HEK293T cells. The ectopically expressed proteins of Irg1 and Tet2 proteins were verified by western-blot using indicated antibodies. e, f, Overexpression of Irg1, but not Irg1mut, inhibits Tet2-catalyzed 5hmC production. Flag-tagged wild-type Irg1 or catalytic defect mutant was co-expressed with HA-mTET2CD in HEK293T cells and was then subjected to detect 5hmC by immunofluorescence staining using indicated antibodies(e) Data shown represent 3 independent experiments’ in e. Scale bar, 50μM.Genomic DNA from the transfected cells in (d) were also subjected to 5hmC and 5mC quantification by LC-MS/MS (f). Data shown in b, c, and f are average values with S.D. of n = three independent experiments. Asterisks denote statistical significance with one-way (f) or two-way ANOVA (b) for multiple comparisons. *denotes p < 0.05, ***denotes p < 0.001, ****denotes p < 0.0001 for the indicated comparison. n.s. = not significant.
Figure 2.
Figure 2.. Itaconate binds directly to TET2 in a manner similar to α-KG
a, Schematic diagram of the workflow for assaying Tet enzyme activity using immobilized substrate DNA and fluorescence detection of 5hmC. b, IC50 values of indicated metabolites toward mTET2CD were measured by a protocol modified from the method shown in Fig. 2b. Enzyme activity was analyzed using GraphPad software and IC50 values were calculated using the equation of log (inhibitor) vs. response (three parameters). Data shown are average values with S.D. of 3 experiments. c, α-KG overcomes ITA and L-2HG inhibition of Tet2. The relative Tet2 enzyme activity was measured as in Fig. 1c in the presence of fixed concentration of ITA or L-2-HG and variable concentration of α-KG. Data was analyzed using GraphPad software following Michaelis-Menten equation. Data shown are average values of 2 or 3 experiments. d, ITA binds to TET2 and is competed off by α-KG. Saturation transfer difference (STD) NMR independent spectroscopy was used to determine the binding of metabolites with recombinant human TET2CD. e, ITA is unable to bind with TET2 mutants. STD NMR spectroscopy was used to determine the binding of ITA with recombinant proteins of TET2CD mutant, i.e. R1896M or S1898F. Data shown represent 2 independent experiments in d and e. P values are calculated using two-tailed Student’s t-test for paired comparisons (a). **denotes p < 0.01, ***denotes p < 0.001 for the indicated comparison.
Figure 3.
Figure 3.. Irg1 produces Itaconate to inhibit Tet activity in vivo
a, Treatment with OI or unmodified ITA reduces genome-wide 5hmC in Tet2+/+ BMDMs, but not Tet2−/− cells. Mouse BMDMs were treated with 0.5 mM OI or increased concentrations of unmodified ITA as indicated for 8 hours. Global levels of 5mC and 5hmC were quantified by LC-MS/MS. b, LPS treatment reduces genome-wide 5hmC in Irg1-WT but not Irg1-KO RAW264.7 cells. Macrophages were treated with LPS for indicated time, and global levels of 5mC and 5hmC were determined by LC-MS/MS. c, d, LPS treatment reduces genome-wide 5hmC in Irg1+/+ but not Irg1−/− primary macrophages. Mouse BMDMs (c) and peritoneal macrophage (d) were isolated and then treated with LPS for indicated time. Genomic 5hmC was determined by FACS. e, Deletion of Irg1 leads to increased 5hmC at promoters and intragenic regions. Irg1+/+ and Irg1−/− BMDMs were treated with LPS for indicated time, following 5hmC mapping by hMeDIP-seq. The normalized density profile for 5hmC across gene body ± 5kb flanking regions is shown. The experiments were performed once. Shown in a-d are average values with S.D. (a, c) or SEM (b). of three independent experiments. P values are calculated using two-tailed Student’s t-test for paired comparisons (b, c, d) or two-way ANOVA for multiple comparisons (a).*denotes p < 0.05, **denotes p < 0.01, ***denotes p < 0.001, and ****denotes p < 0.0001 for the indicated comparison. n.s. = not significant.
Figure 4.
Figure 4.. Tet2 is a major target of Itaconate to suppress LPS-induced genes in macrophages
a, Volcano representation of RNA-seq analyses of the effect of OI treatment and Tet2 deletion on regulating gene expression in LPS-treated RAW264.7 cells. All genes differentially expressed with p-value ≤ 0.05 and fold change (FC) ≥2 are highlighted in red (up-regulation) and blue (down-regulation). RNA-seq was performed using three biological replicates. The data shown are average values of three biological replicates. b, Overlap between LPS-induced genes down-regulated by OI and by Tet2 deletion in RAW264.7 cells is displayed by Venn diagram (p-value < 10−10). Top 10 pathways enriched among the overlapping genes were identified by KEGG pathway analysis. c, K-mean cluster analysis of 712 which are induced by LPS and down-regulated by OI in RAW264.7 cells, see also Extended Data Fig. 6c. d, Representative LPS-induced genes inhibited by OI and Tet2 catalytic inactivation in BMDMs. Top LPS-induced genes most significantly affected by OI in BMDMs are selected from 4 signaling pathways that are also affected by OI and Tet2-KO in RAW264.7 macrophages. e, Unmodified ITA inhibits LPS-induced genes in a Tet2-dependent manner. Tet2-WT and Tet2-KO RAW264.7 cells were pre-treated with unmodified ITA (3 mM) and then stimulated with LPS, following detection of the indicated gene mRNA expression by qRT-PCR. f, Deletion of Irg1 leads to up-regulation of genes which are induced by LPS but inhibited by either ITA or Tet2 catalytic inactivation. Irg1-WT and Irg1-KO RAW264.7 cells were treated with LPS for indicated time, following determination of indicated gene mRNA expression by qRT-PCR. Shown in e and f are average values with S.D. of three independent experiments. P values are calculated using two-way ANOVA for multiple comparisons. **denotes p < 0.01, ***denotes p < 0.001, and ****denotes p < 0.0001 for the indicated comparison. n.s. = not significant.
Figure 5.
Figure 5.. RelA interacts with and recruits Tet2 to Nfkbiz promoter in LPS-activated macrophages
a, Knockdown of RelA or Tet2 in RAW264.7 cells by sgRNA, confirmed by western blot. b, LPS stimulates RelA-Tet2 binding. RAW264.7 cells were treated with sgRNA against Tet2 (left) or RelA (right) and then challenged without or with LPS for 4 hours, followed by co-immunoprecipitation assay to detect the protein interaction between RelA and Tet2 using indicated antibodies. A representative blot of two independent experiments is shown in (a, b). c, Top panel shows RelA binding to the promoter of Nfkbiz promoter identified by the systematic ChIP-seq analyses of transcription factor binding in resting and activated macrophages. Middle panel: Schematic illustration of the proximal promoter region of mouse Nfkbiz gene, cis-regulatory elements and binding of RelA and Tet2 as determined by ChIP assay in Fig. 5. Bottom panel: Nucleotide sequence of the proximal promoter region of mouse and human Nfkbiz genes. Three putative canonical κB sites, transcription start sites were previously identified. d, RelA binds to Nfkbiz promoter. RelA occupancy at the promoter region of Nfkbiz was determined by ChIP-qPCR in control and RelA knockdown RAW264.7 cells. e, Tet2 binds to Nfkbiz promoter. Tet2 occupancy at the promoter region of Nfkbiz was determined by ChIP-qPCR in control and Tet2 knockdown RAW264.7 cells. f, g, RelA recruits Tet2 to bind and catalyze 5mC hydroxylation of Nfkbiz gene promoter. Tet2 occupancy (f) and 5hmC enrichment (g) were determined by ChIP-qPCR assays in unstimulated and LPS-treated RAW264.7 cells using relevant antibodies. h, Deletion of Tet2 and Irg1 leads to down-regulation and up-regulation of Nfkbiz mRNA expression, respectively, as determined by qRT-PCR assays. i, Irg1-WT and Irg1-KO RAW264.7 cells were treated with LPS as indicated. The Nfkbiz promoter enrichment of 5hmC was determined by hMeDIP-qPCR. j, RAW264.7 with or without RelA knockdown were treated with LPS for indicated time. The mRNA expression was determined by qRT-PCR assays. Shown in d-j are average values with S.D. of three independent experiments. P values are calculated using one way (d-g) or two-way ANOVA (h, j) for multiple comparisons. *denotes p < 0.05, **denotes p < 0.01, ***denotes p < 0.001, and ****denotes p < 0.0001 for the indicated comparison. n.s. = not significant.
Figure 6.
Figure 6.. Itaconate reduces LPS-induced mouse mortality in a manner dependent on Tet2
a,b, Peritoneal leukocytes were freshly isolated from indicated mice at 4 hours post i.p. injection of PBS or LPS (20 mg/kg). Genomic 5hmC was detected by immunofluorescence staining (IF, n=3 mice per group) (a) and LC-MS/MS (n=3–4 mice per group) (b). Representative IF result is shown. Scale bar, 20 μm. c,. As described above in (a-b), the Nfkbiz promoter enrichment of 5hmC was determined by hMeDIP-qPCR in peritoneal leukocytes. d, As described above in (a-b), mouse peritoneal leukocytes were harvested and analyzed for indicated gene expression by qRT-PCR. e, Transplanted mice were i.p. injected with ITA prior to LPS challenge (25 mg/kg; n=4 mice per group). At 4 hours post LPS, serum levels of indicated cytokines /chemokines were determined as described in Methods. f, As described above in (e), serum samples were collected for measurement of ALT and AST activities as described in Methods. g,h,i, As described above in (e), lung tissues of transplanted mice(n=3–4 mice) were harvested and then subjected to the wet/dry weight ratio calculation (g) as well as HE staining (h). The injury score was determined as described in Methods (i). Representative photomicrographs are shown. Scale bar, 200 μm (upper panels)& 100 μm (lower panels). j, Transplanted mice were i.p. injected with ITA prior to LPS challenge (25 mg/kg; n=7 mice per group), and the animal survival was monitored and Kaplan-Meier survival curves were determined as described in Methods. Shown in c, d are average values with S.D. (b, d-f) or SEM. (c,g) of three independent experiments (if not pointed out). P- values are calculated using one-way ANOVA (b-f); As for the percent survival, P values were determined using log-rank (Mantel-Cox) test comparing each 2 groups; *denotes p < 0.05, **denotes p < 0.01, ***denotes p < 0.001, and ****denotes p < 0.0001 for the indicated comparison. n.s. = not significant.

References

    1. Daniels BP et al. The Nucleotide Sensor ZBP1 and Kinase RIPK3 Induce the Enzyme IRG1 to Promote an Antiviral Metabolic State in Neurons. Immunity 50, 64–76 e64 (2019). - PMC - PubMed
    1. Nair S et al. Irg1 expression in myeloid cells prevents immunopathology during M. tuberculosis infection. J Exp Med 215, 1035–1045 (2018). - PMC - PubMed
    1. Lee CG, Jenkins NA, Gilbert DJ, Copeland NG & O’Brien WE Cloning and analysis of gene regulation of a novel LPS-inducible cDNA. Immunogenetics 41, 263–270 (1995). - PubMed
    1. Michelucci A et al. Immune-responsive gene 1 protein links metabolism to immunity by catalyzing itaconic acid production. Proc Natl Acad Sci U S A 110, 7820–7825 (2013). - PMC - PubMed
    1. Ackermann WW & Potter VR Enzyme inhibition in relation to chemotherapy. Proc Soc Exp Biol Med 72, 1–9 (1949). - PubMed

Publication types