. 2022 Mar;28(3):468-471.
doi: 10.1038/s41591-022-01708-3. Epub 2022 Mar 7.

High burden of clonal hematopoiesis in first responders exposed to the World Trade Center disaster

Affiliations

High burden of clonal hematopoiesis in first responders exposed to the World Trade Center disaster

Sakshi Jasra et al. Nat Med. 2022 Mar.

Abstract

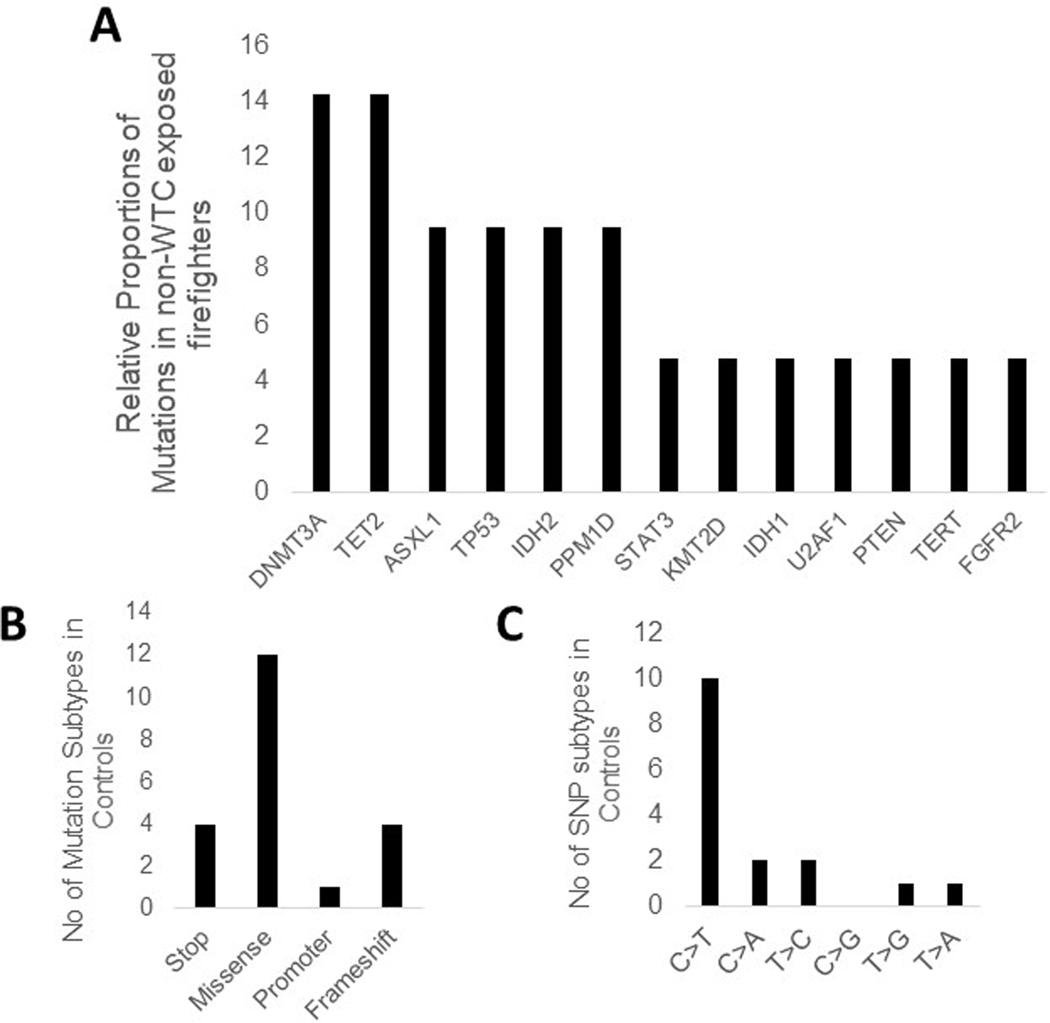
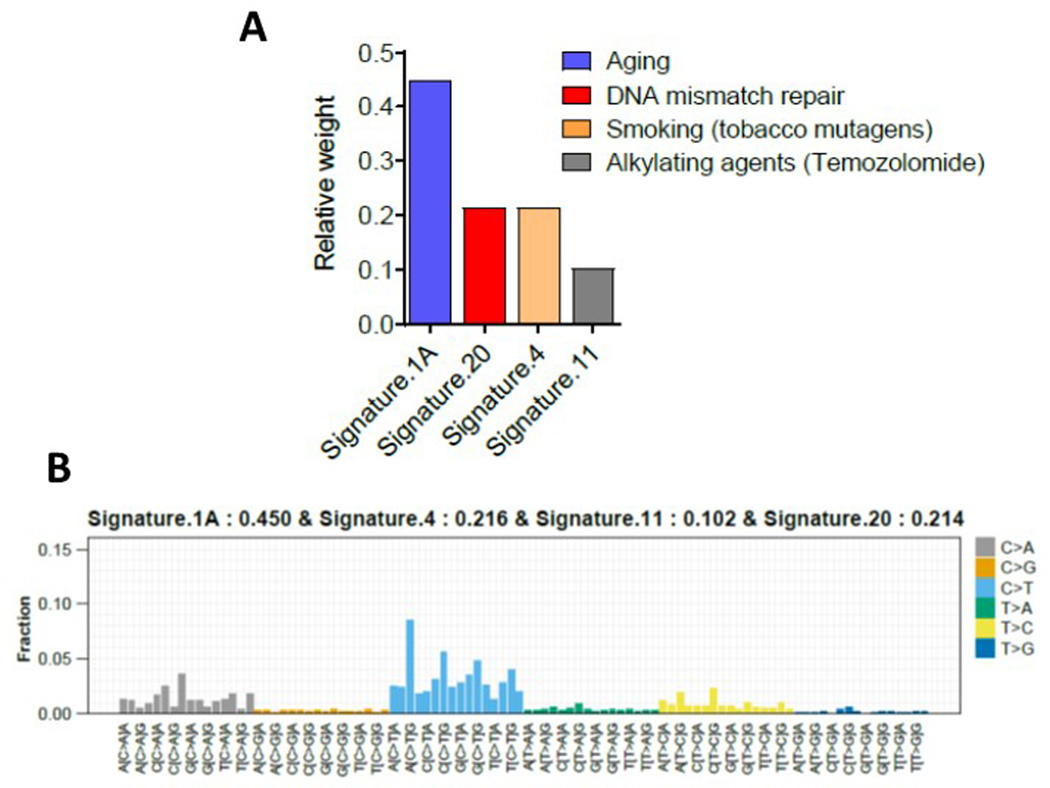
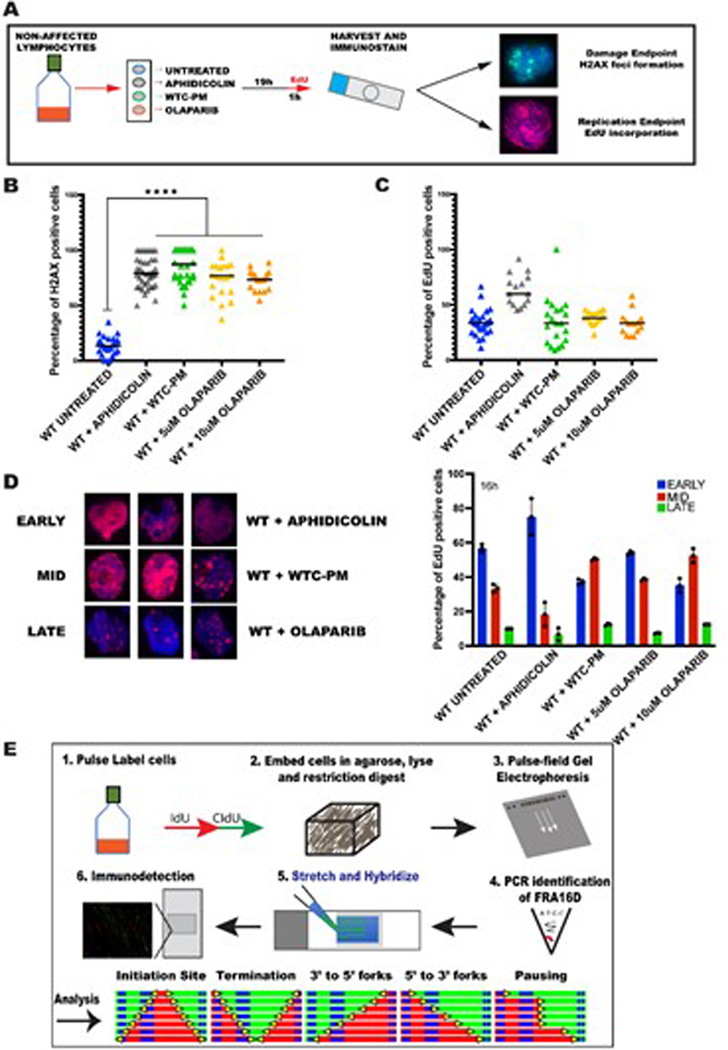
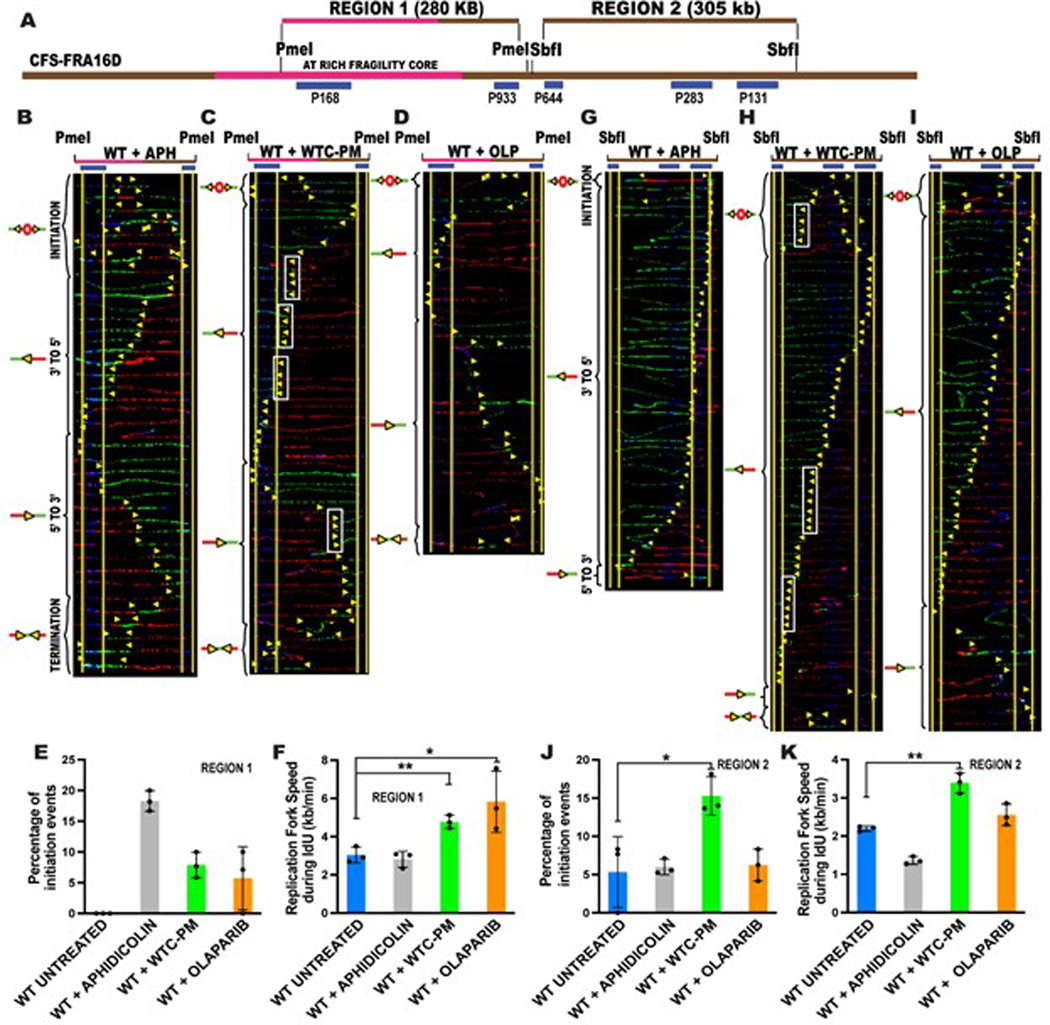
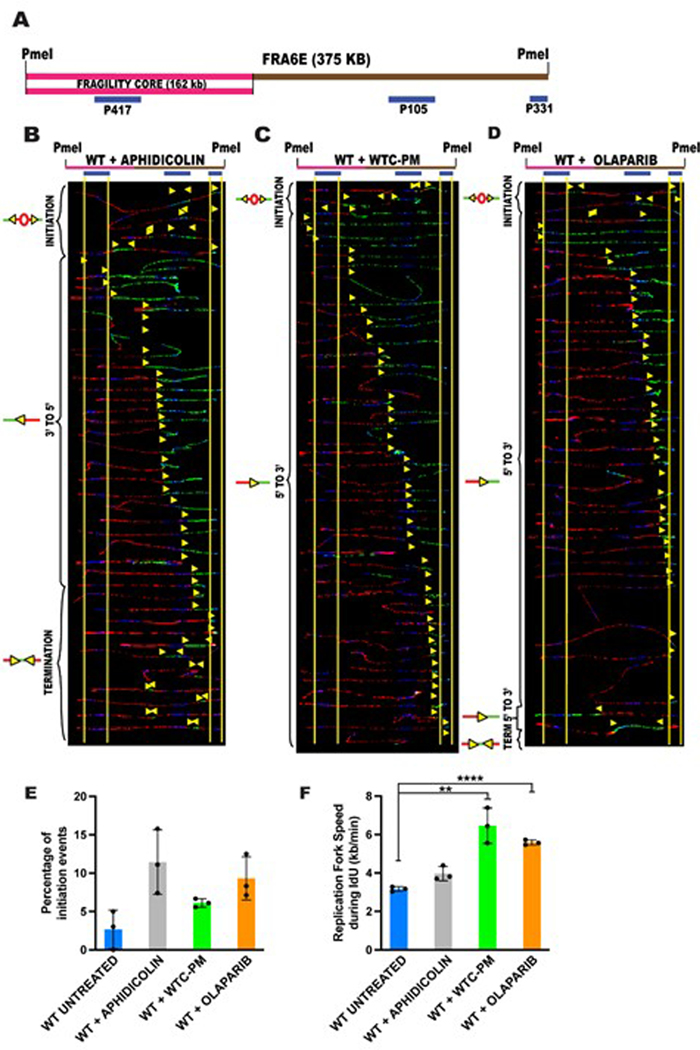
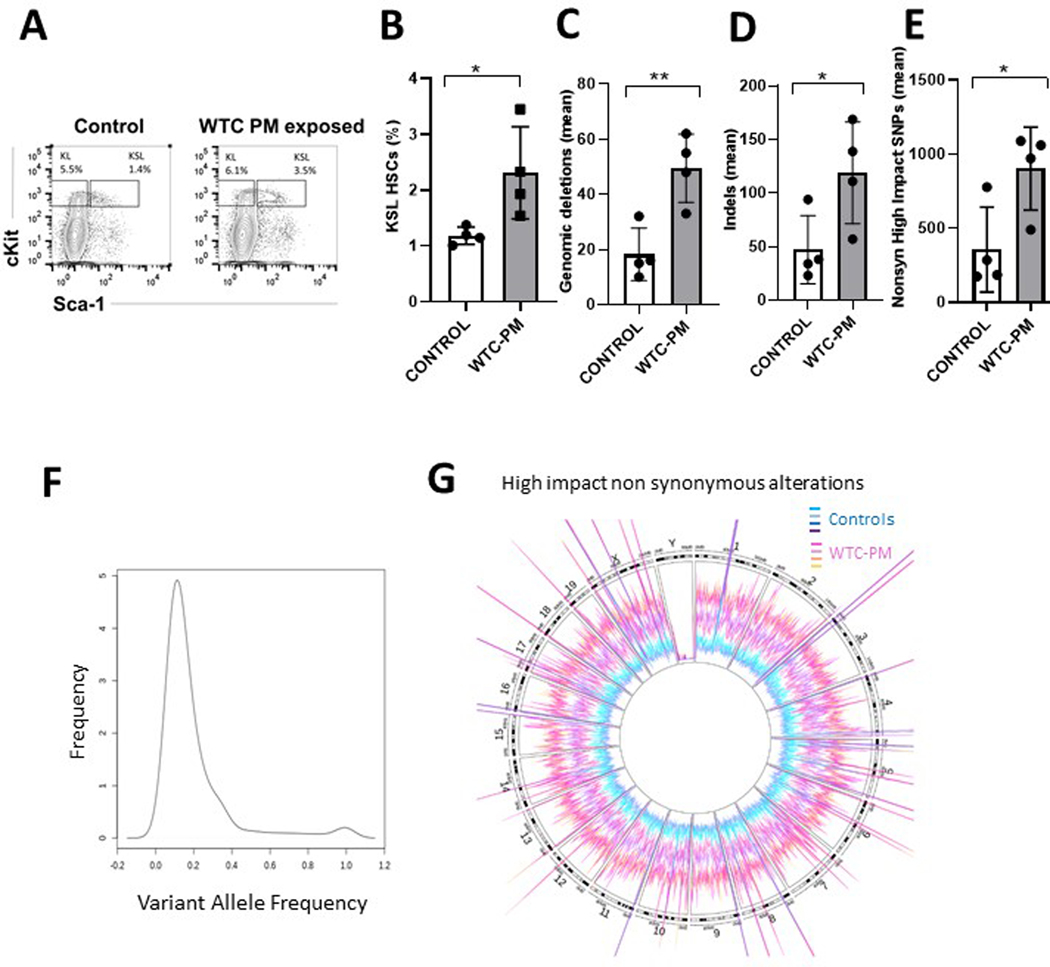
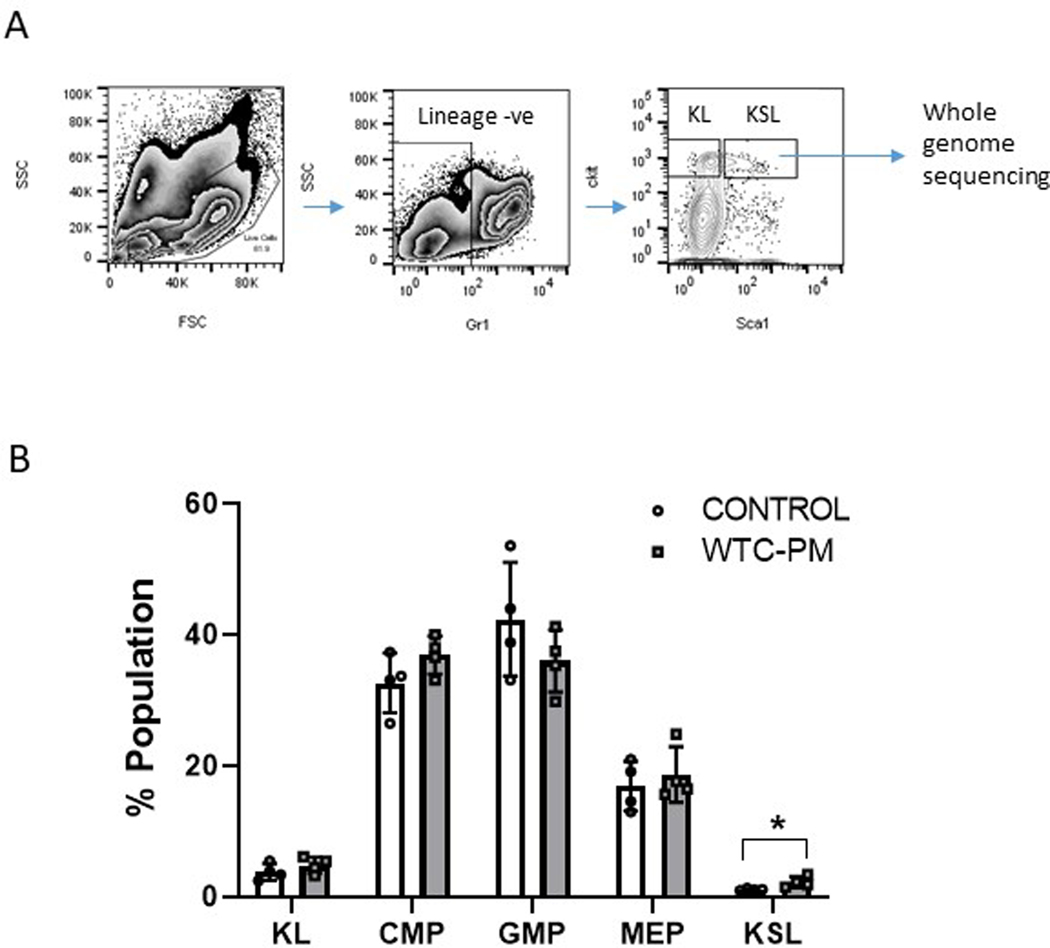
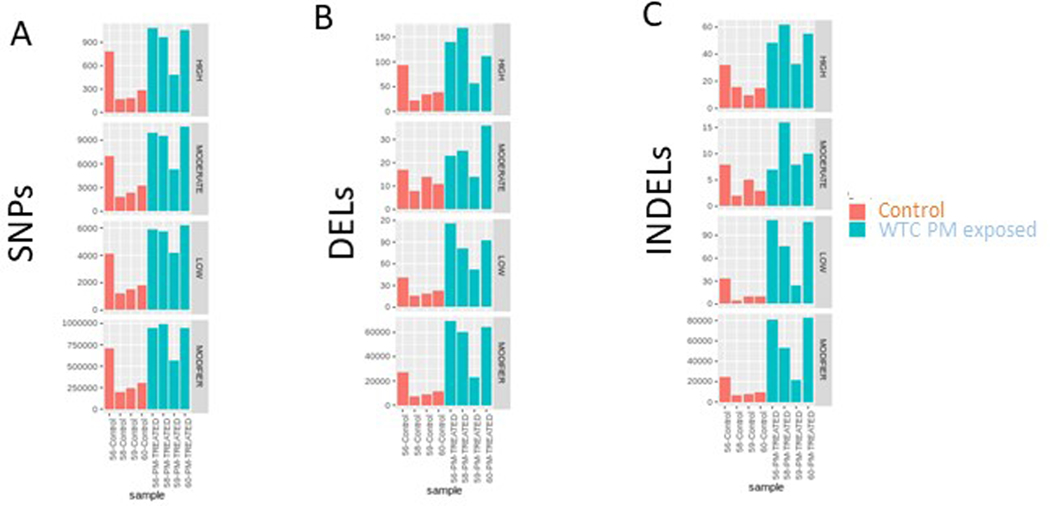
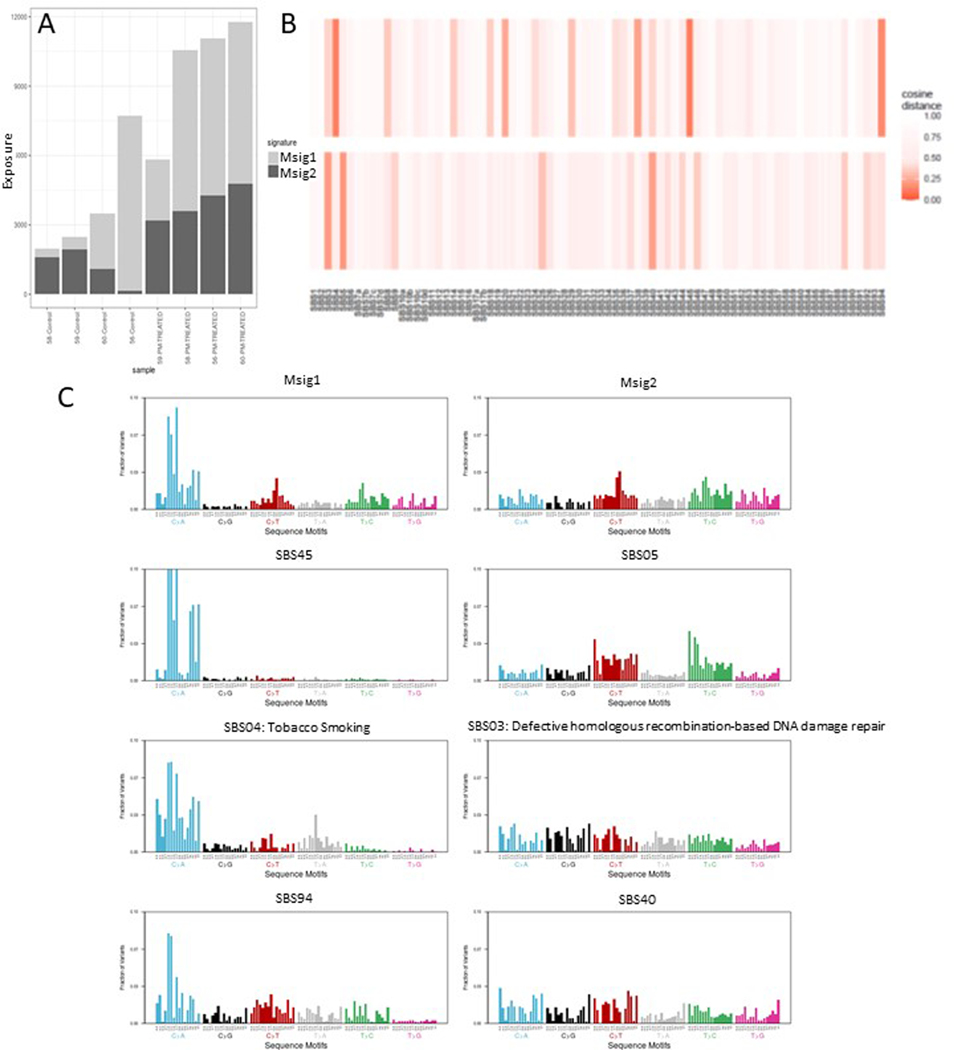
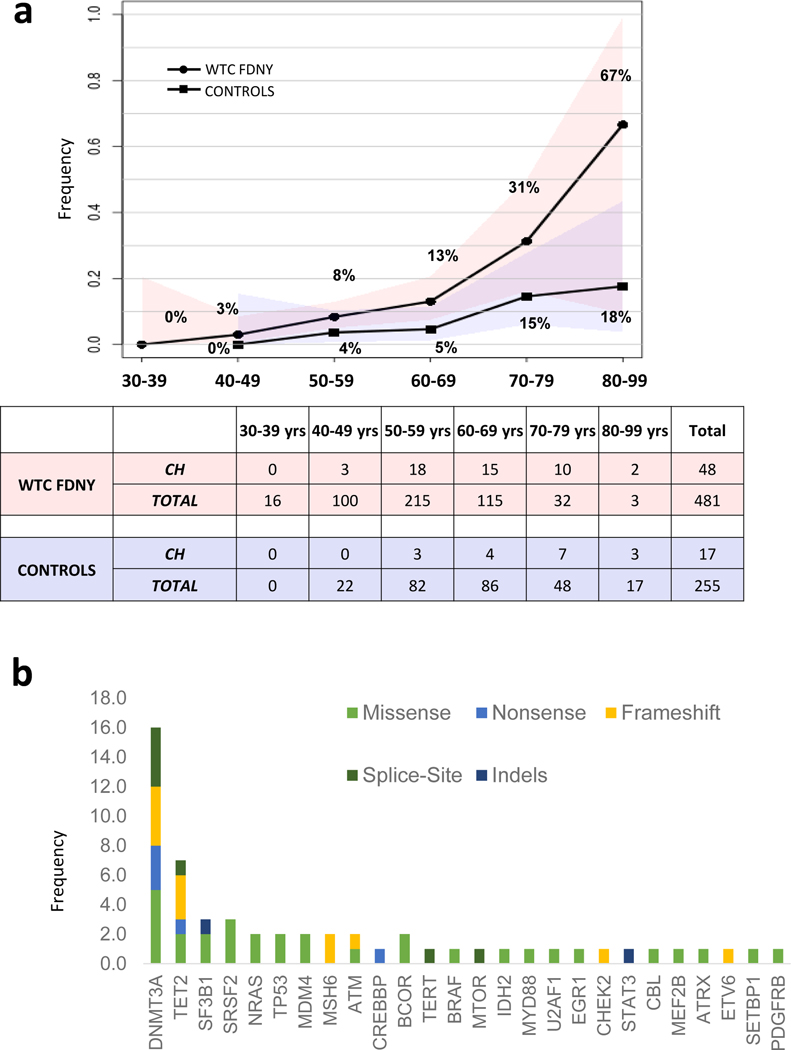
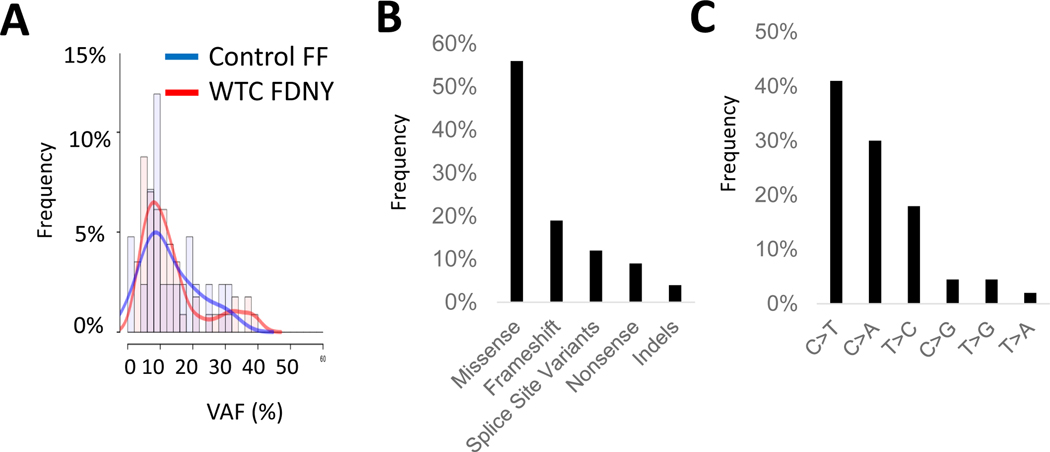
The terrorist attacks on the World Trade Center (WTC) created an unprecedented environmental exposure to aerosolized dust, gases and potential carcinogens. Clonal hematopoiesis (CH) is defined as the acquisition of somatic mutations in blood cells and is associated with smoking and exposure to genotoxic stimuli. Here we show that deep targeted sequencing of blood samples identified a significantly higher proportion of WTC-exposed first responders with CH (10%; 48 out of 481) when compared with non-WTC-exposed firefighters (6.7%; 17 out of 255; odds ratio, 3.14; 95% confidence interval, 1.64-6.03; P = 0.0006) after controlling for age, sex and race/ethnicity. The frequency of somatic mutations in WTC-exposed first responders showed an age-related increase and predominantly affected DNMT3A, TET2 and other CH-associated genes. Exposure of lymphoblastoid cells to WTC particulate matter led to dysregulation of DNA replication at common fragile sites in vitro. Moreover, mice treated with WTC particulate matter developed an increased burden of mutations in hematopoietic stem and progenitor cell compartments. In summary, the high burden of CH in WTC-exposed first responders provides a rationale for enhanced screening and preventative efforts in this population.


Figures

Extended Data Fig. 1
Extended Data Fig. 1. Characteristics of somatic mutations seen in non-WTC exposed first responder controls:
A: Frequency of genes found to be mutated are shown in non-WTC exposed first responder controls B: Numbers of specific types of non synonymous mutations are shown C: Frequency of exact nucleotide change for mutations are shown
Extended Data Fig. 2
Extended Data Fig. 2. Mutational signatures for changes seen in WTC-exposed first responders:
A: Relative weight and underlying mechanisms of different mutation signatures inferred from the mutational spectra are shown B:The 96 trinucleotide mutational spectra of somatic mutations see in WTC exposed first responders. X-axis is showing the 96 combination of nucleotide changes, and their relative weights inferred by deconstructSigs is shown on the Y-axis.
Extended Data Fig. 3
Extended Data Fig. 3. WTC-Particulate matter (WTC-PM) exposure induces DNA damage by promoting faster progression of cells through s-phase
(A) Schematic of treatment regime (B) Percentage of cells with H2AX foci in wildtype (WT) Untreated (blue bar), WT+ Aphidicolin (grey bar), WT+ WTC-PM (green bar) and WT+ 5uM Olaparib (orange bar) and 10uM Olaparib (yellow bar). Approximately 500 cells examined over three independent experiments. Statistical significance was assessed using a two-tailed t-test where ****p<.0001. (C) Percentage of cells with EdU incorporation in wildtype (WT) Untreated (blue bar), WT+ Aphidicolin (grey bar), WT+ WTC-PM (green bar) and WT+ 5uM Olaparib (orange bar) and 10uM Olaparib (yellow bar). Approximately 250 cells examined over three independent experiments. Statistical significance was assessed using a two-tailed t-test. (D) Spatiotemporal pattern of DNA replication. Percentage of cells with EdU incorporation patterns characteristic of early (blue bar), mid (red bar) and late (green bar) s-phase. Error bars represent mean ± s.d. from data collected where n= ~250 cells examined over three independent experiments. Statistical significance was assessed using a two-tailed t-test. (E) Schematic representation of the various stages of single molecule analysis of replicated DNA (SMARD). Cells are pulsed with nucleoside analogs (IdU-green; CIdU-red) and embedded in agarose plugs. The cells are first lysed; proteins are digested by proteinase K and then subjected to restriction digestion. The restriction digested DNA is resolved by pulse field gel electrophoresis. The slice containing the FRA16D locus is identified by PCR analysis. The agarose from the identified slice is melted and the DNA is stretched onto silanized glass slides. Biotinylated FISH probes are used for identification of the fragment and immunostaining is utilized to visualize the IdU tract in red, the CIdU tract in green and the FISH probes in blue. The resulting molecules are arranged to yield recognizable replication patterns (from the left): initiating molecules, terminating molecules, replication forks progressing in the 3’ to 5’ and 5’ to 3’ direction which are easily interpreted by the IdU incorporation histograms.
Extended Data Fig. 4
Extended Data Fig. 4. WTC-PM exposure perturbs DNA replication at common fragile site FRA16D
(A) Locus map of the Region 1(R1)-PmeI and Region 2(R2)-SbfI segments, of CFS-FRA16D. The FISH probes that identify the segment are labeled in blue. (B-D) Top; Locus map of PmeI digested R1 segment. Bottom; Aligned photomicrograph images of labeled DNA molecules from the WILDTYPE (WT) lymphoblastoid cell line treated with 0.2μM Aphidicolin for 20h (B); or treated with 200μg/ml WTC-PM for 20h (C); or treated with 5μM olaparib for 20h (D). (E) Percentage of molecules with replication initiation sites in Region 1 of CFS-FRA16D in wildtype (WT) Untreated (blue bar), WT+ Aphidicolin (grey bar), WT+ WTC-PM (green bar) and WT+ olaparib (orange bar). Error bars represent mean ± s.d. from data collected where n=40 molecules analyzed over three independent experiments. Statistical significance was assessed using a two-tailed t-test. Note: Aphidicolin, WTC-PM and olaparib are present during IdU pulse. (F) Replication fork speed during the IdU pulse of SMARD (first 4 hours of pulsing) in Region 1 of CFS-FRA16D in wildtype (WT) Untreated (blue bar), WT+ Aphidicolin (grey bar), WT+ WTC-PM (green bar) and WT+ olaparib (orange bar). Error bars represent mean ± s.d. from data collected where n= ~200 DNA molecules analyzed from three independent experiments. Statistical significance was assessed using a two-tailed t-test where *p=0.0439, **p=0.0052. Note: Aphidicolin, WTC-PM and olaparib are present during IdU pulse. (G-I) Top; Locus map of SbfI digested R2 segment. Bottom; Aligned photomicrograph images of labeled DNA molecules from the WILDTYPE (GM03798) lymphoblastoid cell line treated with 0.2μM Aphidicolin for 20h (G); or treated with 200μg/ml WTC-PM for 20h (H); or treated with 5μM olaparib for 20h (I). The yellow arrows indicate the sites along the molecules where the IdU transitioned to CldU. White rectangles indicate representative sites of replication fork pausing. The molecules are arranged in the following order: molecules with initiation events, molecules with 3’ to 5’ progressing forks, molecules with 5’ to 3’ progressing forks and molecules with termination events. (J) Percentage of molecules with replication initiation sites in Region 2 of CFS-FRA16D in wildtype (WT) Untreated (blue bar), WT+ Aphidicolin (grey bar), WT+ WTC-PM (green bar) and WT+ olaparib (orange bar). Error bars represent mean ± s.d. from data collected where n=40 molecules analyzed over three independent experiments. Statistical significance was assessed using a two-tailed t-test where *p=0.0311. Note: Aphidicolin, WTC-PM and Olaparib are present during IdU pulse. (K) Replication fork speed during the IdU pulse of SMARD (first 4 hours of pulsing) in Region 2 of CFS-FRA16D in wildtype (WT) Untreated (blue bar), WT+ Aphidicolin (grey bar), WT+ WTC-PM (green bar) and WT+ Olaparib (orange bar). Error bars represent mean ± s.d. from data collected where n= ~200 DNA molecules analyzed from three independent experiments. Statistical significance was assessed using a two-tailed t-test where **p=0.0016 Note: Aphidicolin, WTC-PM and olaparib are present during IdU pulse.
Extended Data Fig. 5
Extended Data Fig. 5. WTC-PM exposure perturbs DNA replication at common fragile site FRA6E
(A): Locus map of a 375 kb region in the CFS-FRA6E obtained by PmeI digestion. The region includes the fragility core of CFS-FRA6E (pink line – 162 kb). The FISH probes that identify the segment are labeled in blue. (B-D): Top; Locus map of the PmeI digested FRA6E segment. Bottom; Aligned photomicrograph images of labeled DNA molecules from the WILDTYPE (GM03798) lymphoblastoid cell line treated with 0.2μM Aphidicolin for 20h (D); or treated with 200μg/ml WTC-PM for 20h (E); or treated with 5μM Olaparib for 20h (F). (E): Percentage of molecules with replication initiation sites in CFS-FRA6E in wildtype (WT) Untreated (blue bar), WT+ Aphidicolin (grey bar), WT+ WTC-PM (green bar) and WT+ olaparib (orange bar). Error bars represent mean ± s.d. from data collected where n=40 molecules analyzed over three independent experiments. Note: Aphidicolin, WTC-PM and Olaparib are present during IdU pulse. (F): Replication fork speed during the IdU pulse of SMARD (first 4 hours of pulsing) CFS-FRA6E in wildtype (WT) Untreated (blue bar), WT+ Aphidicolin (grey bar), WT+ WTC-PM (green bar) and WT+ Olaparib (orange bar). Error bars represent mean ± s.d. from data collected where n= ~200 DNA molecules analyzed from three independent experiments. Statistical significance was assessed using a two-tailed t-test where **p=0.0035, ****p<0.0001. Note: Aphidicolin, WTC-PM and olaparib are present during IdU pulse.
Extended Data Fig. 6
Extended Data Fig. 6. Genomic alterations induced by exposure to WTC PM in vivo:
A: Mice were treated with WTC PM and used for bone marrow stem and progenitor FACS analysis. Representative control and WTC PM treated mice samples are shown. B: Hematopoietic Kit +, Sca1+, Lineage –ve stem cells are shown for WTC PM treated and control mice (N=4 individual mice per group, Means +/− SD, Two tailed TTest, P=0.036) C: Numbers of high impact deletions are shown for WTC PM and control treated mice within stem and progenitors compartments (N=4 individual mice per group, Means +/− SD, Two tailed TTest, P=0.007) D: Numbers of high impact indels are shown for WTC PM and control treated mice within stem and progenitors compartments (N=4 individual mice per group, Means +/− SD, Two tailed TTest, P=0.046) E: Numbers of high impact nonsynonymous SNPs are shown for WTC PM and control treated mice within stem and progenitor compartments. N=4 individual mice per group, Means +/− SD, Two tailed TTest, P=0.03) F: Variant allele frequency (VAF) of high impact nonsynonymous genomic changes in WTC PM treated stem and progenitors. G: Circos plot showing magnitude of nonsynonymous genomic changes in 4 WTC PM and 4 control mice.
Extended Data Fig. 7
Extended Data Fig. 7. Mice treated with WTC PM were analyzed for stem and progenitor alterations:
A: Mice were treated with WTC PM were sacrificed at 30 days after oropharyngeal exposure and used for bone marrow stem and progenitor FACS analysis. Representative sorting strategy for KSL stem cells is shown. B: Relative proportions of stem and progenitor populations are shown. Means +/− SD of 4 mice in each group.
Extended Data Fig. 8
Extended Data Fig. 8. Hematopoietic stem and progenitor cells from mice treated with WTC PM show genomic instability:
A: Numbers of high, moderate, low and modifier impact SNPs are shown for WTC PM treated and control mice within stem and progenitor compartments. Individual mice are shown. B: Numbers of high, moderate, low and modifier impact deletions are shown for WTC PM treated and control mice within stem and progenitor compartments. Individual mice are shown. C: Numbers of high, moderate, low and modifier impact indels are shown for WTC PM treated and control mice within stem and progenitor compartments. Individual mice are shown.
Extended Data Fig. 9
Extended Data Fig. 9. Murine mutational signatures similar to human mutational signatures associated with smoking and defective DNA repair:
A: De novo murine mutational signatures (Msig1 and Msig2) were created from high and moderate impact snps and show greater signature activities in the WTC-PM exposed mice. B: The murine signatures were compared to known human mutational signatures. Greater similarity was shown with higher intensity of color on the heatmap. Human signatures with most similarity to Msig1 were SBS45, SBS4, SBS94. Human signatures with most similarity to Msig2 were SBS5, SBS3, SBS40. C: Human signatures with most similarity to murine signatures were SBS 03, 04, 05, 40, 45 and 90.
Figure 1:
Figure 1:. Prevalence and characteristics of somatic mutations seen in WTC-exposed first responders:
A: The number of somatic mutations in 481 WTC-exposed first responders is shown as a function of age. 75% and 95% confidence intervals are shown in red shading. B: Percentage of first responders with mutations for specific genes is shown.
Figure 2:
Figure 2:. Characteristics of somatic mutations seen in WTC-exposed first responders:
A: The variant allele frequency (VAF; mutant reads/total reads) for each mutation is shown for first responders and controls... B: The frequency at which each of the indicated types of somatic mutations occurred in the WTC-exposed first responders is shown. C: Frequency at which each of the indicated mutation types occurred in WTC exposed first responders is shown

References

    1. Lioy PJ, et al. Characterization of the dust/smoke aerosol that settled east of the World Trade Center (WTC) in lower Manhattan after the collapse of the WTC 11 September 2001. Environ Health Perspect 110, 703–714 (2002). - PMC - PubMed
    1. Li J, et al. Cancer Incidence in World Trade Center Rescue and Recovery Workers: 14 Years of Follow-Up. J Natl Cancer Inst (2021). - PMC - PubMed
    1. Zeig-Owens R, et al. Early assessment of cancer outcomes in New York City firefighters after the 9/11 attacks: an observational cohort study. Lancet 378, 898–905 (2011). - PMC - PubMed
    1. Landgren O, et al. Multiple Myeloma and Its Precursor Disease Among Firefighters Exposed to the World Trade Center Disaster. JAMA Oncol 4, 821–827 (2018). - PMC - PubMed
    1. Jaiswal S, et al. Age-related clonal hematopoiesis associated with adverse outcomes. N Engl J Med 371, 2488–2498 (2014). - PMC - PubMed

Publication types