. 2022 Apr;6(4):418-426.
doi: 10.1038/s41559-022-01679-1. Epub 2022 Mar 7.

Hibernation slows epigenetic ageing in yellow-bellied marmots

Affiliations

Hibernation slows epigenetic ageing in yellow-bellied marmots

Gabriela M Pinho et al. Nat Ecol Evol. 2022 Apr.

Abstract

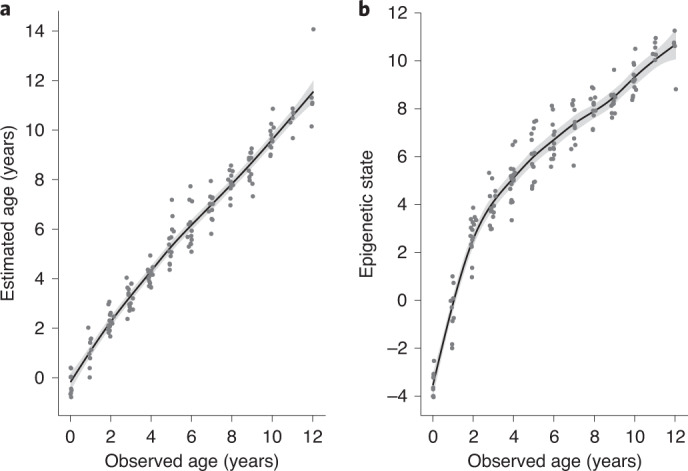
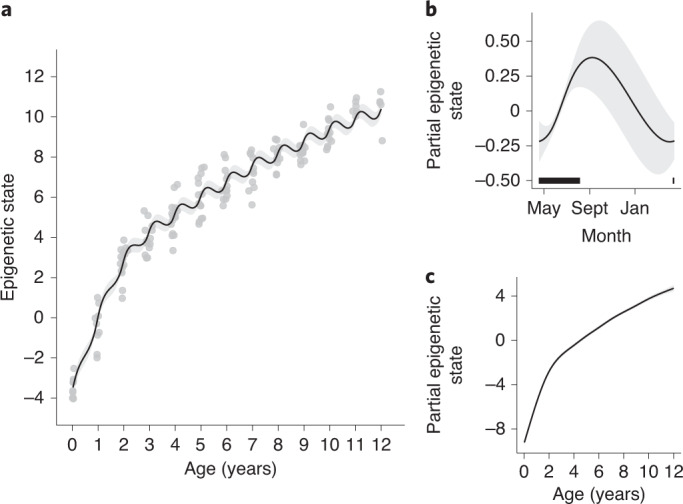
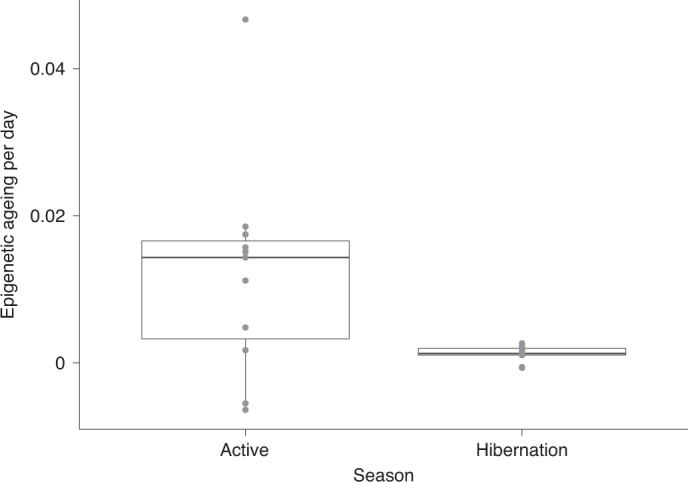
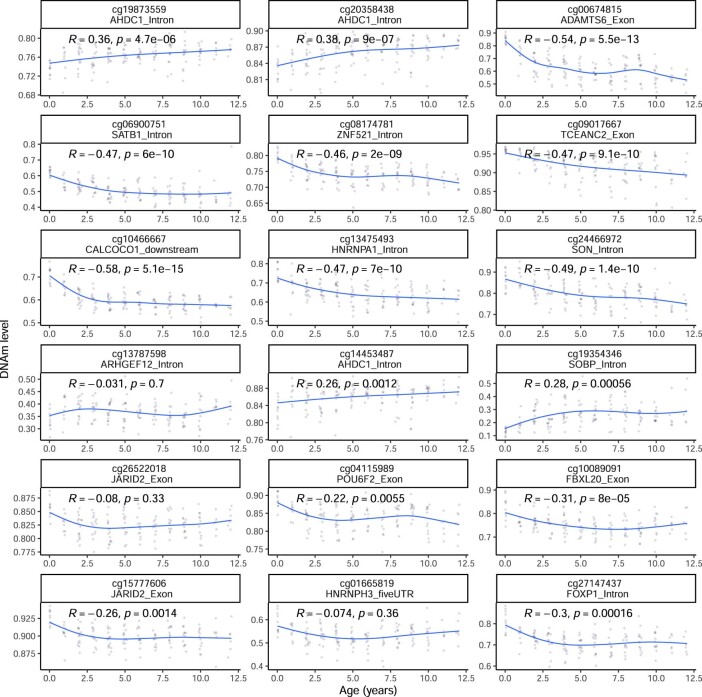
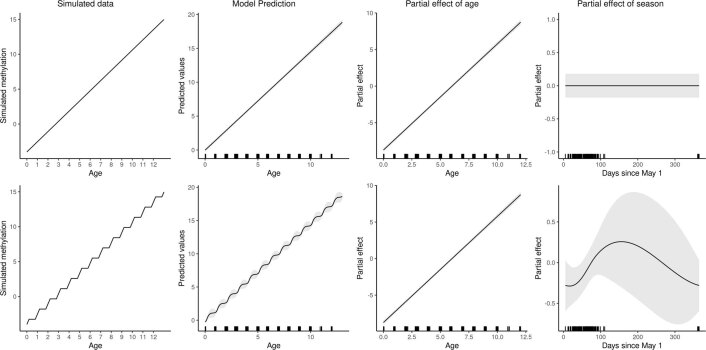
Species that hibernate generally live longer than would be expected based solely on their body size. Hibernation is characterized by long periods of metabolic suppression (torpor) interspersed by short periods of increased metabolism (arousal). The torpor-arousal cycles occur multiple times during hibernation, and it has been suggested that processes controlling the transition between torpor and arousal states cause ageing suppression. Metabolic rate is also a known correlate of longevity; we thus proposed the 'hibernation-ageing hypothesis' whereby ageing is suspended during hibernation. We tested this hypothesis in a well-studied population of yellow-bellied marmots (Marmota flaviventer), which spend 7-8 months per year hibernating. We used two approaches to estimate epigenetic age: the epigenetic clock and the epigenetic pacemaker. Variation in epigenetic age of 149 samples collected throughout the life of 73 females was modelled using generalized additive mixed models (GAMM), where season (cyclic cubic spline) and chronological age (cubic spline) were fixed effects. As expected, the GAMM using epigenetic ages calculated from the epigenetic pacemaker was better able to detect nonlinear patterns in epigenetic ageing over time. We observed a logarithmic curve of epigenetic age with time, where the epigenetic age increased at a higher rate until females reached sexual maturity (two years old). With respect to circannual patterns, the epigenetic age increased during the active season and essentially stalled during the hibernation period. Taken together, our results are consistent with the hibernation-ageing hypothesis and may explain the enhanced longevity in hibernators.


Conflict of interest statement

S.H. is a founder of the non-profit Epigenetic Clock Development Foundation, which plans to license several patents from his employer UC Regents. These patents list S.H. as inventor. The other authors declare no competing interests.

Figures

Fig. 1
Fig. 1. Epigenetic ageing models for a wild population of yellow-bellied marmots.
The epigenetic clock (a) and the epigenetic pacemaker (b). Points represent samples from individuals of known age at the sampling moment (observed age) and the y axis represents the epigenetic age calculated by each model. Trend lines were developed by fitting cubic splines. Buffers illustrate the 95% confidence intervals.
Fig. 2
Fig. 2. Visualization of the GAMM with epigenetic states generated from the EPM model using CpG sites highly correlated to chronological age (absolute r > 0.7).
a, Changes in the epigenetic state (or epigenetic age) as individuals age. Points are actual data, while lines are the predictions from the model. b, Predictions generated with the partial effect of date of year (cyclic cubic smoother spline) on epigenetic state. The black horizontal bar represents when samples were collected and most of the marmot active season. c, Predictions generated with the partial effect of chronological age (cubic smoother spline) on epigenetic state. Buffers illustrate the 95% confidence intervals.
Fig. 3
Fig. 3. Epigenetic ageing rate during the active and hibernation seasons of 11 yellow-bellied marmots with samples collected in consecutive years.
Epigenetic ageing rates were calculated using the epigenetic ages from the EPM model. The points represent the rate of epigenetic ageing calculated for each individual. The individuals with negative rates of epigenetic ageing and the individual with the highest rate during the active season are all old females (details in Supplementary Information). The box includes the rate values in between the first and third quartiles (the 25th and 75th percentiles), the horizontal black line represents the median and the whiskers extend from the box to the largest or lowest value no further than 1.5 times the distance between the first and third quartiles.
Fig. 4
Fig. 4. Associations of CpG sites with chronological age and seasons (day of the year) in blood of yellow-bellied marmots.
a, The y axis reports log transformed P values for the EWAS of chronological age. b,c, The y axis reports log transformed P values for two fixed effects of the GAMs of individual cytosines (dependent variable) for chronological age (b; cubic spline function; age GAM) and day of year (c; cyclic cubic spline function; season GAM). The CpG sites’ coordinates were estimated based on the alignment of mammalian array probes to yellow-bellied marmot genome assembly. For some of the most significant CpGs, the symbols of proximal genes are provided. The direction of associations with chronological age is highlighted for the significant sites, with orange for hypermethylated and blue for hypomethylated sites; the red dashed lines represent the significance threshold (P < 10−5). Note that the season effect is cyclical, and we show the direction of association with chronological age for the active season. d, Venn diagram showing the overlap of significant (P < 105) CpG sites between EWAS and the GAMs. The effects of age and season in the GAMs are represented separately.
Extended Data Fig. 1
Extended Data Fig. 1. Examples of CpG sites where methylation levels are non-linearly related with chronological age.
Each plot includes the site identification in the Mammalian array and its location relative to the closest transcriptional start site. The CpG sites coordinates were estimated based on the alignment of Mammalian array probes to yellow-bellied marmot (Marmota flaviventer) genome assembly. Trend lines represent the GAM smooth function. R and p-values are based on the Pearson correlation of the CpGs’ methylation level and age in marmots.
Extended Data Fig. 2
Extended Data Fig. 2. Location of CpG sites relative to the closest transcriptional start site.
The CpG sites coordinates were estimated based on the alignment of Mammalian array probes to yellow-bellied marmot (Marmota flaviventer) genome assembly. A,B) CpGs associated with chronological age. C) CpGs associated with seasons (day of the year). D) Location of the Mammalian array probes mapped to the yellow-bellied marmot genome. The direction of associations with chronological age is highlighted (p < 10-5) with orange for hypermethylated and blue for hypomethylated sites. Note that the season effect is cyclical, and we show the direction of association with chronological age for the active season.
Extended Data Fig. 3
Extended Data Fig. 3. Enrichment analysis of the top ageing-related CpGs in yellow bellied marmots (Marmota flaviventer).
The analysis was done using the Genomic Regions Enrichment of Annotations Tool (GREAT). The gene level enrichment was done using human GRCh37 background. The background probes were limited to 19,695 probes that were mapped to the same gene in the marmot genome. The top 3 enriched datasets from each category (Canonical pathways, gene ontology, mouse phenotype, and upstream regulators) were selected and further filtered for significance at p < 10−3. Only terms with more than 5 foreground genes and at least 23 background genes were included.
Extended Data Fig. 4
Extended Data Fig. 4. Visualization of the simulated patterns of epigenetic ageing.
We simulated two traits: a linear trait (first row) that increases linearly with age independently of the season; and a seasonal trait (second row) that increases during the active season but not during the hibernation. For each trait we show the raw simulated data, the prediction from the GAMM fitted to the simulated data, and the predictions of the partial effects of chronological age and season from the model.

Comment in

  • The biology of beauty sleep.
    Anderson JA, Tung J. Anderson JA, et al. Nat Ecol Evol. 2022 Apr;6(4):351-352. doi: 10.1038/s41559-022-01683-5. Nat Ecol Evol. 2022. PMID: 35256810 No abstract available.

Similar articles

Cited by

References

    1. Flatt T. A new definition of aging? Front. Genet. 2012;3:148. - PMC - PubMed
    1. Berdasco M, Esteller M. Hot topics in epigenetic mechanisms of aging: 2011. Aging Cell. 2012;11:181–186. - PMC - PubMed
    1. Jylhävä J, Pedersen NL, Hägg S. Biological age predictors. EBioMedicine. 2017;21:29–36. - PMC - PubMed
    1. Wagner KH, Cameron-Smith D, Wessner B, Franzke B. Biomarkers of aging: from function to molecular biology. Nutrients. 2016;8:338. - PMC - PubMed
    1. Field AE, et al. DNA methylation clocks in aging: categories, causes, and consequences. Mol. Cell. 2018;71:882–895. - PMC - PubMed

Publication types