. 2022 Mar;3(3):337-354.
doi: 10.1038/s43018-022-00334-9. Epub 2022 Mar 7.

An anti-PD-1-GITR-L bispecific agonist induces GITR clustering-mediated T cell activation for cancer immunotherapy

Affiliations

An anti-PD-1-GITR-L bispecific agonist induces GITR clustering-mediated T cell activation for cancer immunotherapy

Sarah Chan et al. Nat Cancer. 2022 Mar.

Abstract

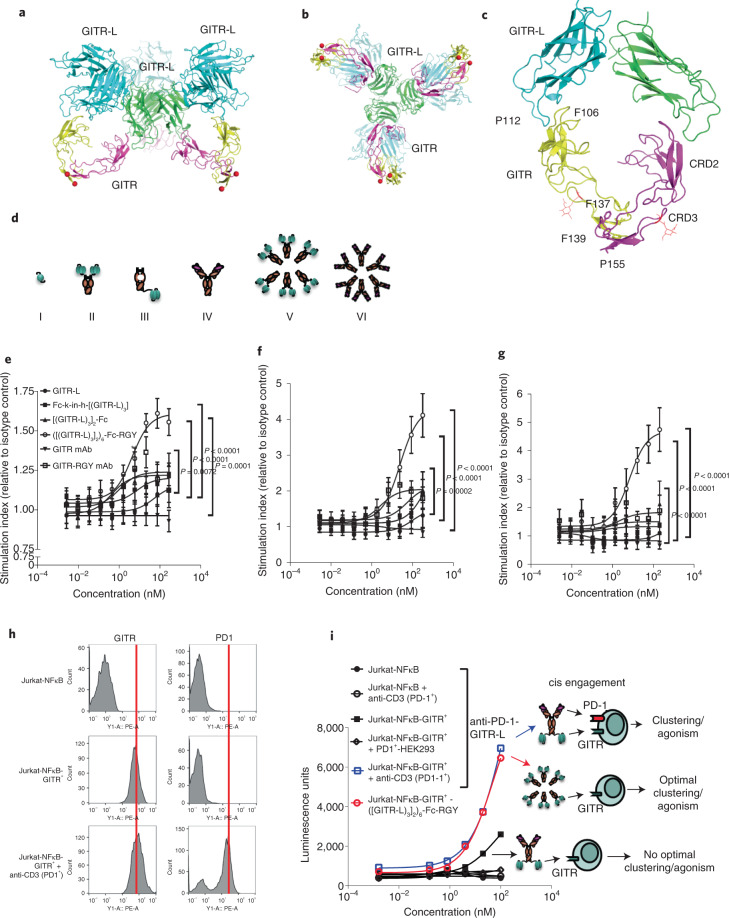
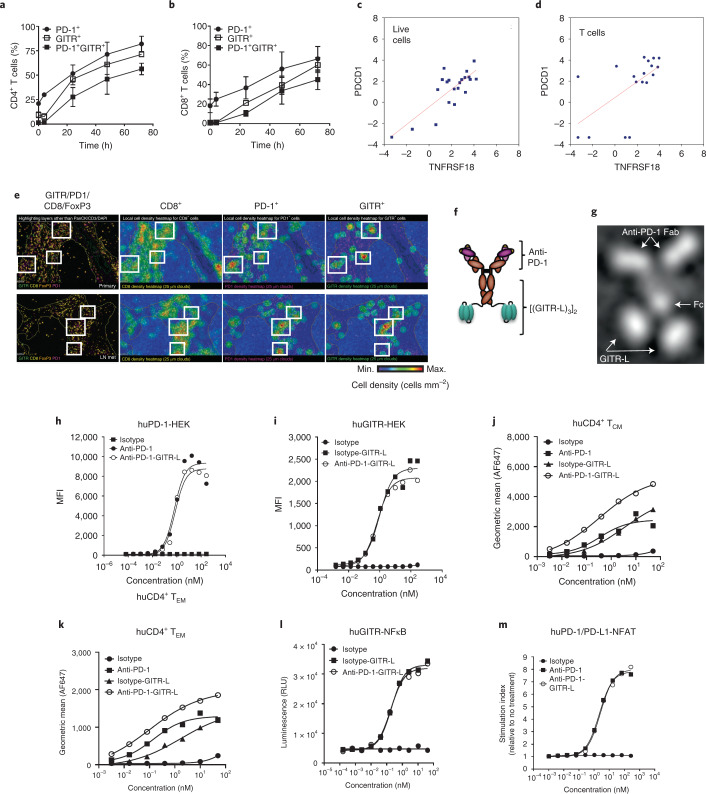
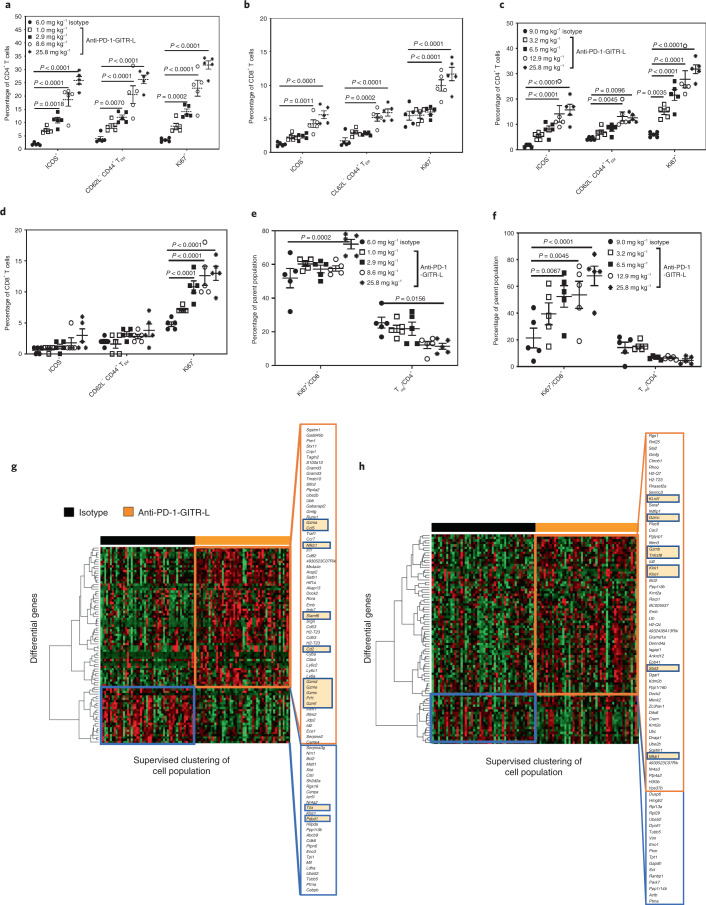
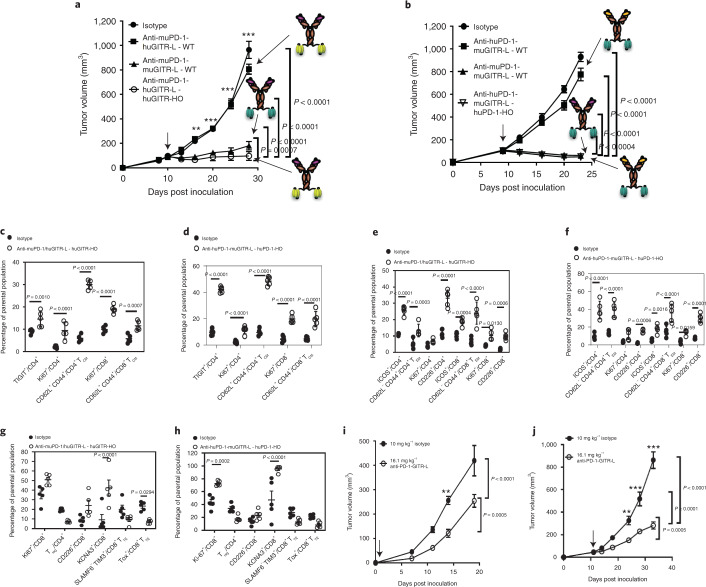
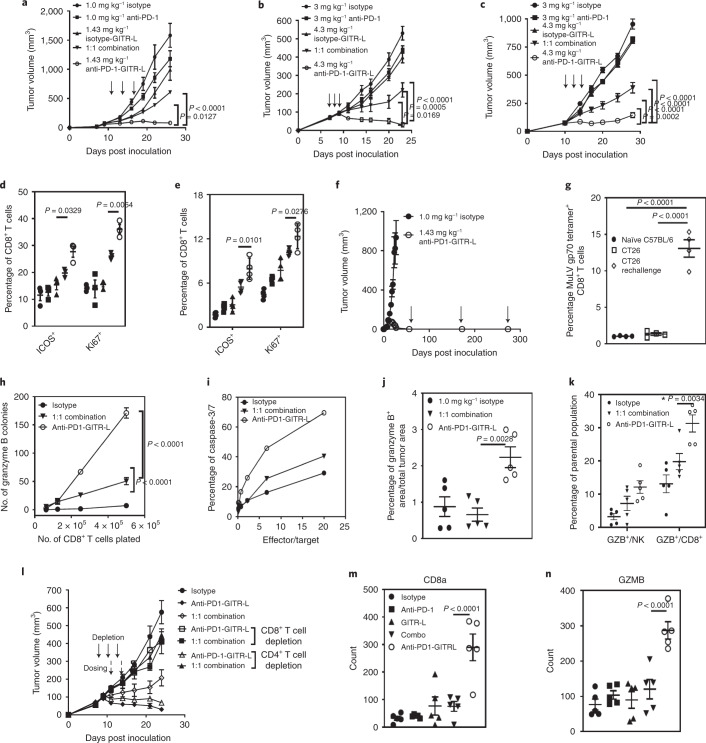
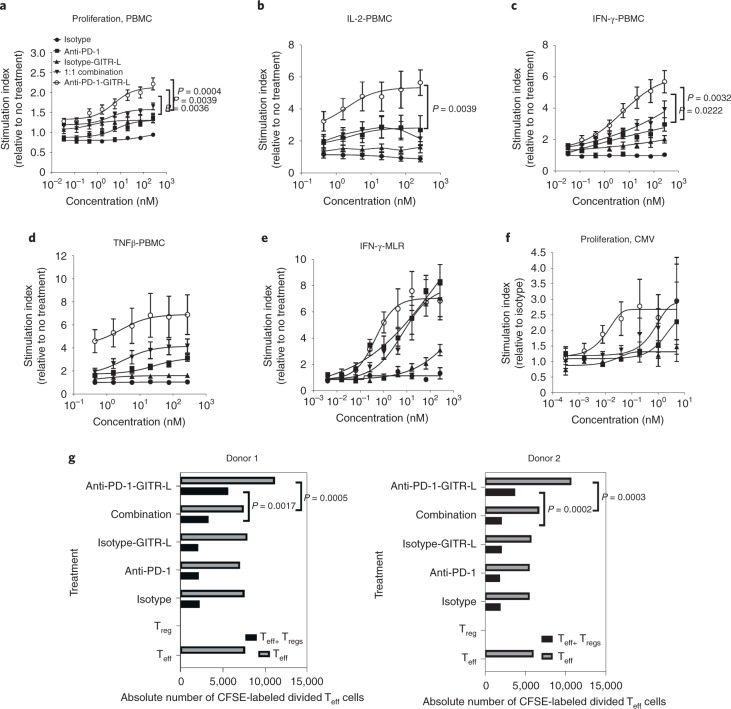
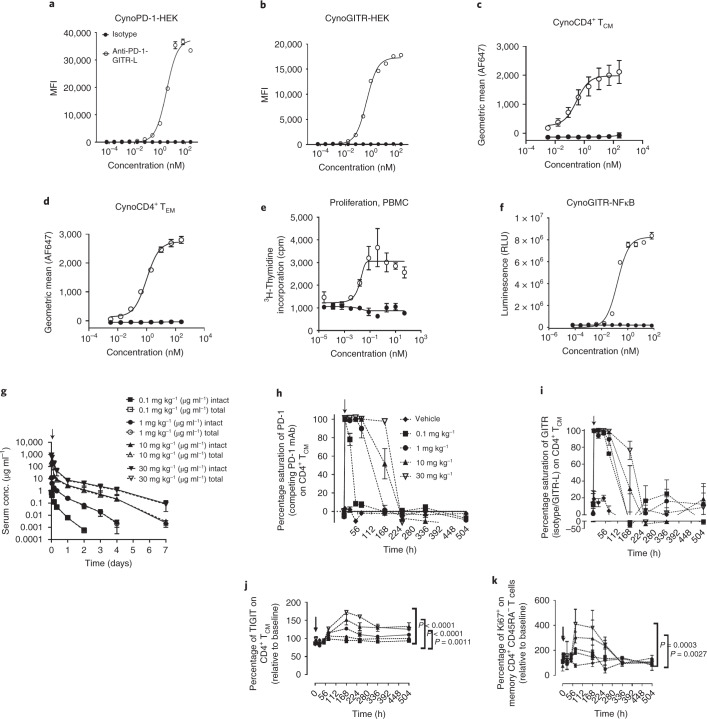
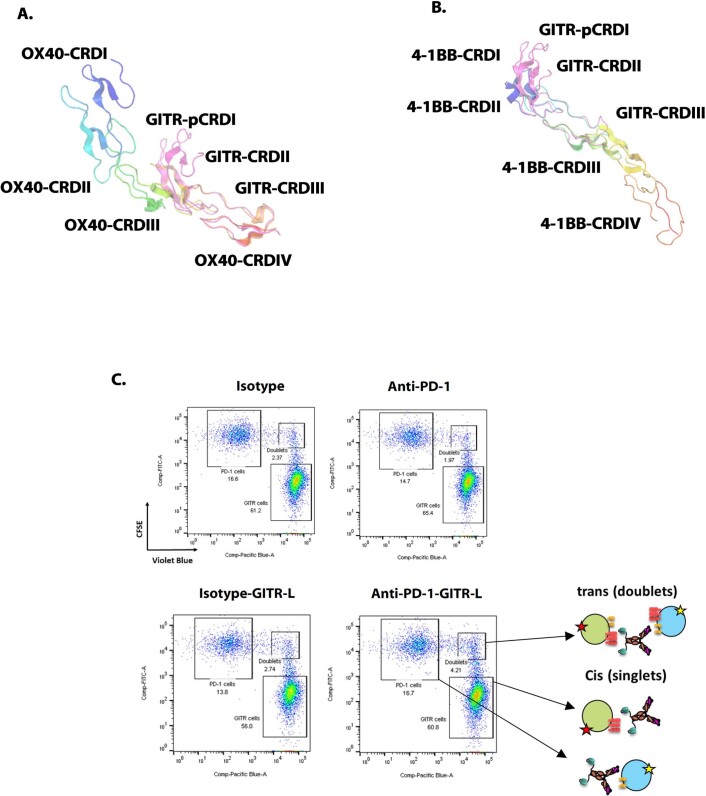
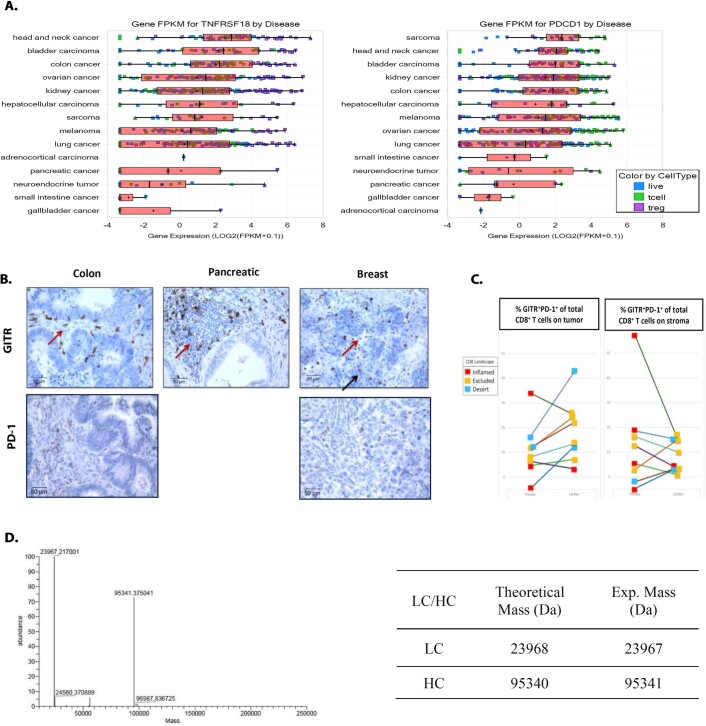
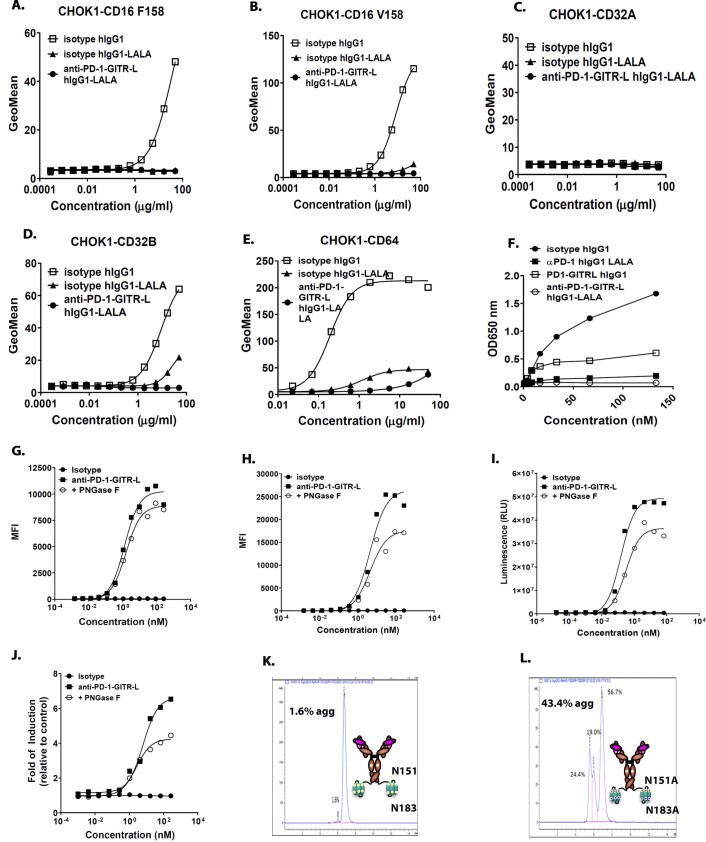
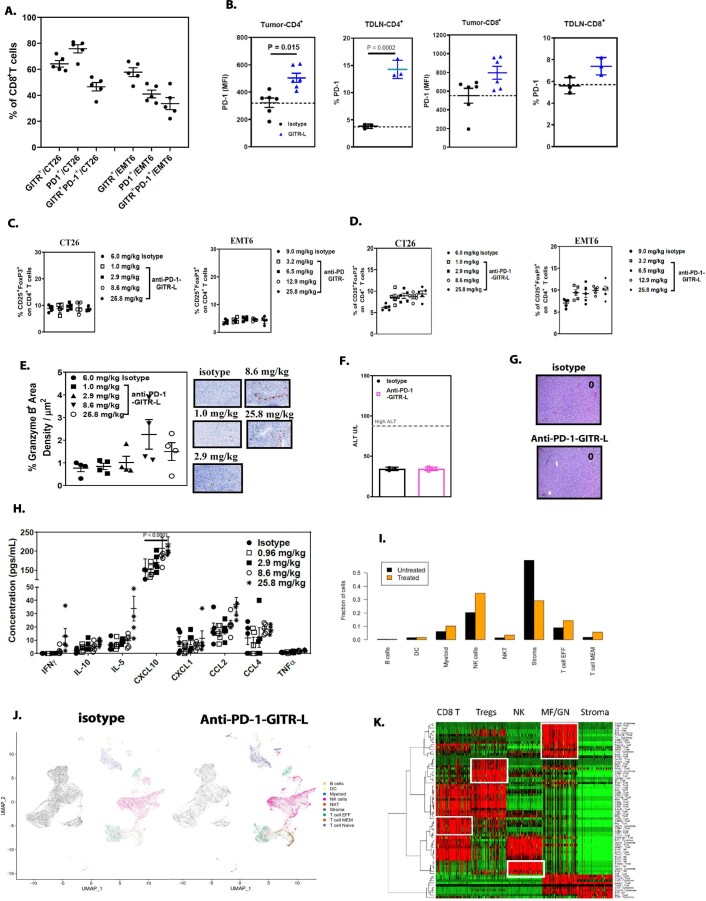
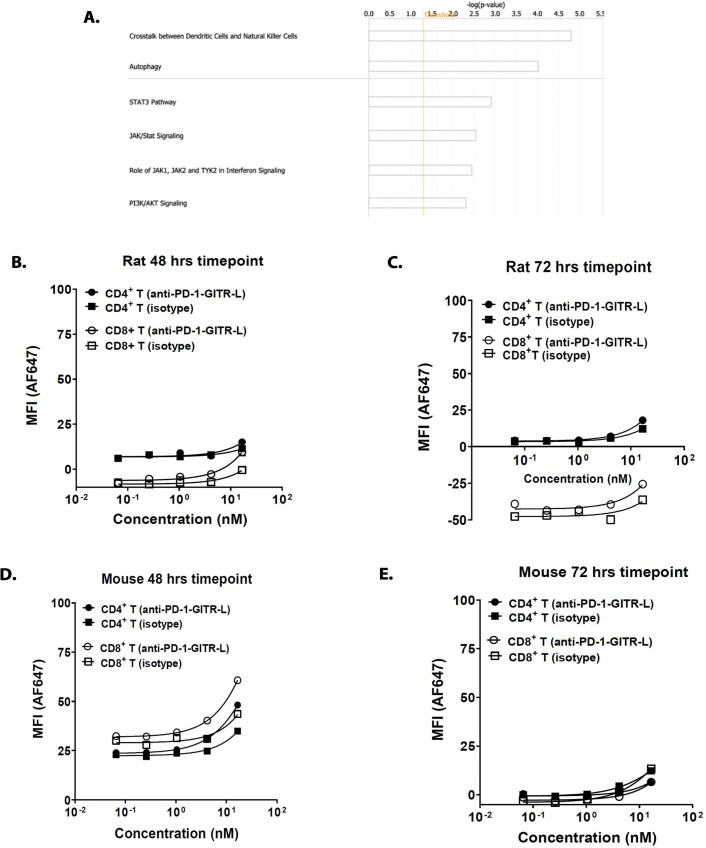
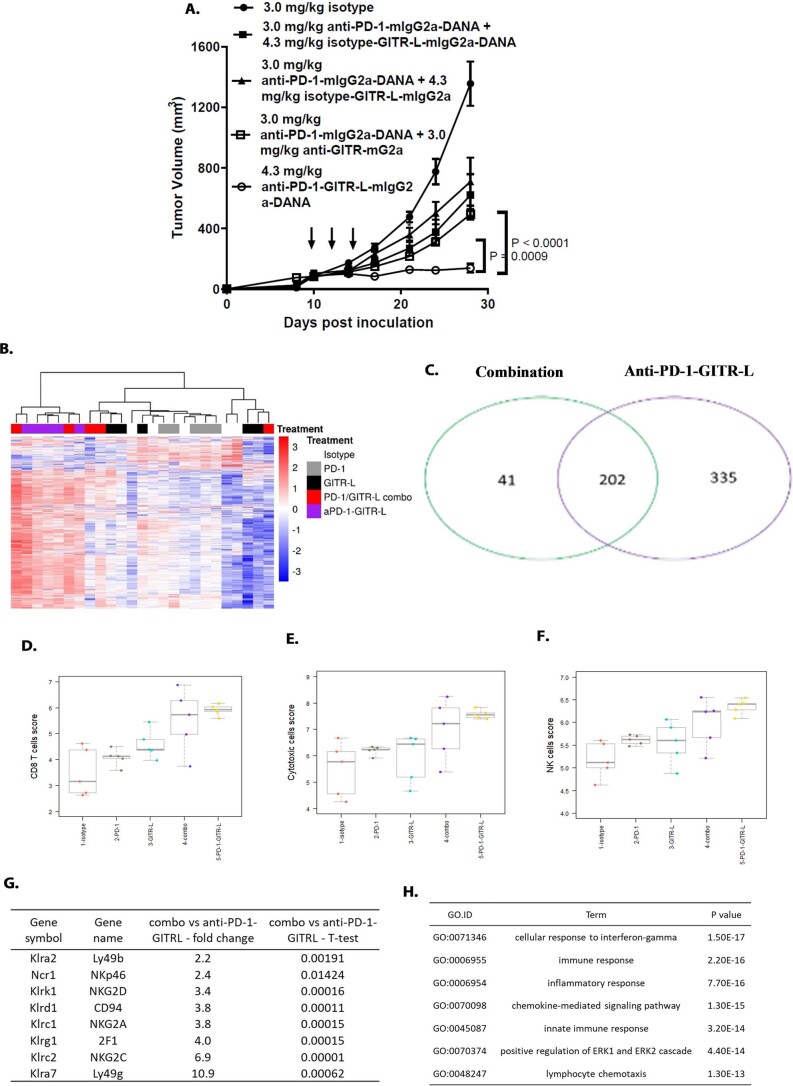
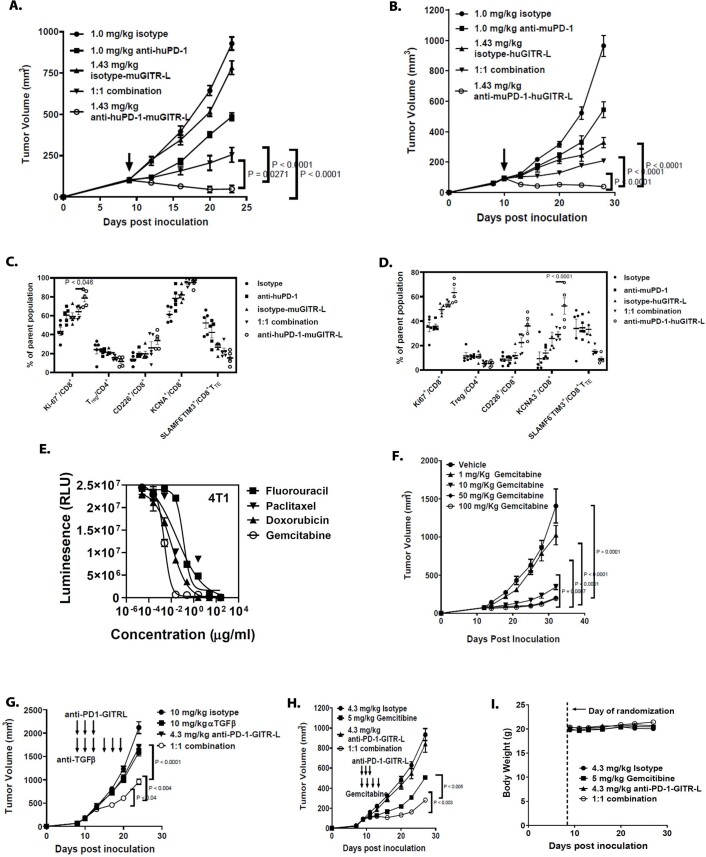
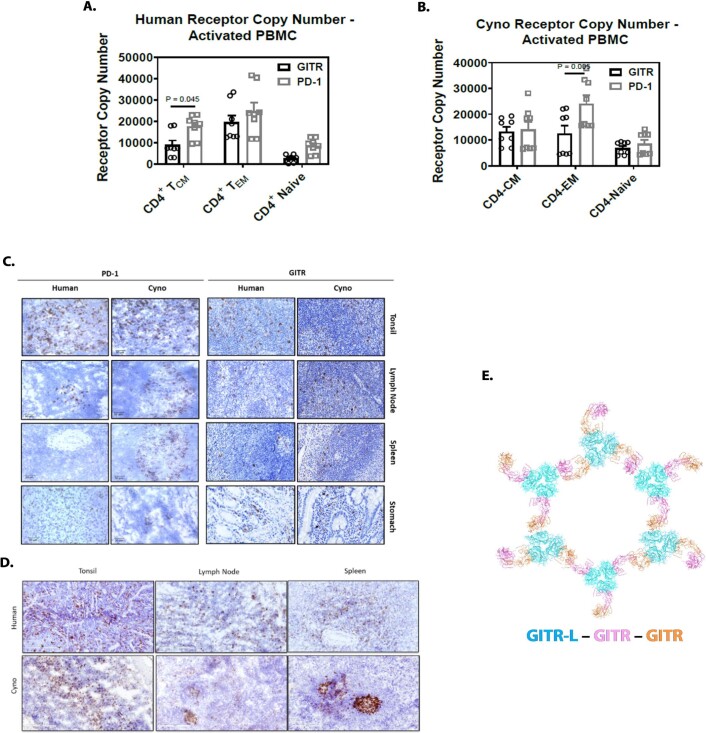
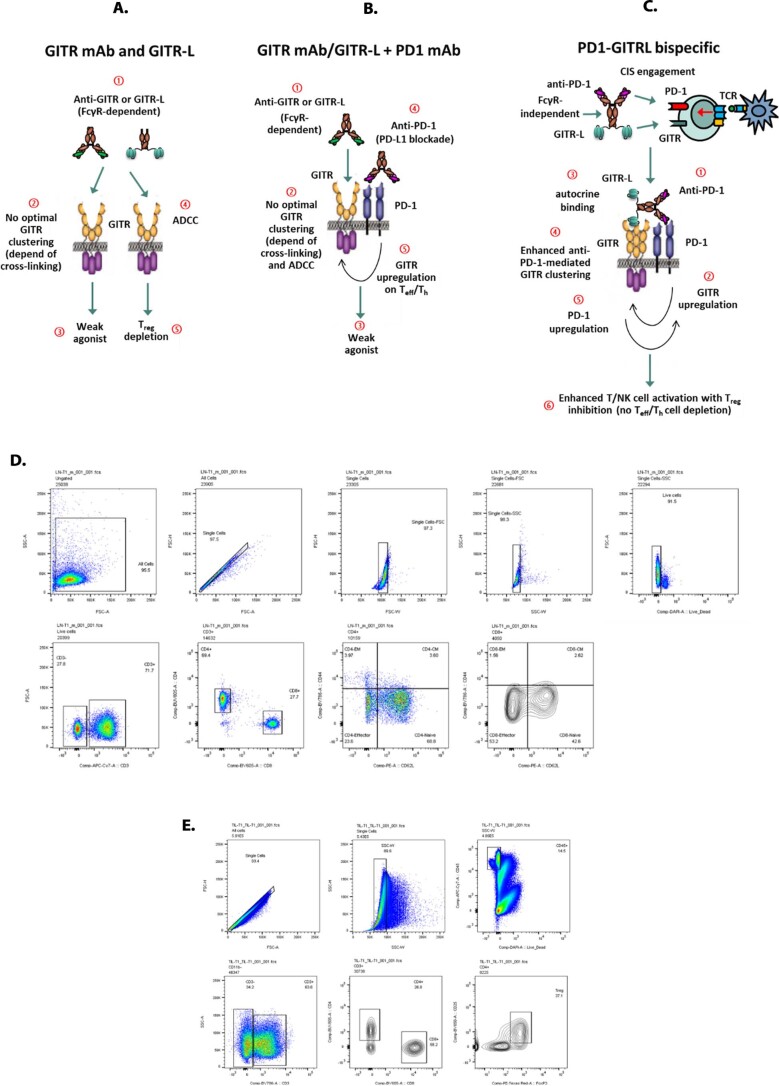
Costimulatory receptors such as glucocorticoid-induced tumor necrosis factor receptor-related protein (GITR) play key roles in regulating the effector functions of T cells. In human clinical trials, however, GITR agonist antibodies have shown limited therapeutic effect, which may be due to suboptimal receptor clustering-mediated signaling. To overcome this potential limitation, a rational protein engineering approach is needed to optimize GITR agonist-based immunotherapies. Here we show a bispecific molecule consisting of an anti-PD-1 antibody fused with a multimeric GITR ligand (GITR-L) that induces PD-1-dependent and FcγR-independent GITR clustering, resulting in enhanced activation, proliferation and memory differentiation of primed antigen-specific GITR+PD-1+ T cells. The anti-PD-1-GITR-L bispecific is a PD-1-directed GITR-L construct that demonstrated dose-dependent, immunologically driven tumor growth inhibition in syngeneic, genetically engineered and xenograft humanized mouse tumor models, with a dose-dependent correlation between target saturation and Ki67 and TIGIT upregulation on memory T cells. Anti-PD-1-GITR-L thus represents a bispecific approach to directing GITR agonism for cancer immunotherapy.


Conflict of interest statement

S.C., N.B., S.H., B.R., M.G., E.L., N.T., D.Z., M.S., W.L., P.Z., Z.D., K.H., S.R., A.T., C.F., M.X., S.T., R.I., M.L., E.D., L.Z., L.B., K.L., J.P.R., C.L., M.T., M.F., Y.A. and H.M.A. are employees of AbbVie. M.S., P.G., T.M., A.W., H.K., H.Z., M.C., B.C., D.H. and F.H. were employees of AbbVie at the time of the study. The design, study conduct and financial support for this research were provided by AbbVie. AbbVie participated in the interpretation of data and review and approval of the publication. J.P.R. declares no competing interests.

Figures

Fig. 1
Fig. 1. GITR clustering is crucial for induction of human T cell activation.
a,b, Side (a) and top view (b) of the GITR–GITR-L complex structure solved at 2.75 Å. Structure centered around a trimeric GITR-L (green), with three GITR monomeric molecules (magenta) each noncovalently dimerized to a GITR (yellow) interacting with neighboring GITR-L trimers (light blue). N-linked glycosylation sites of GITR are shown as red spheres. c, The CRD3 domain of GITR mediates noncovalent dimerization through phenylalanine (F137 and F139) and proline (P155) residues. N-linked glycosylations are represented by red lines. d, Schematic representation of engineered constructs (percentage aggregation). I, Monomeric GITR-L (2%); II, bivalent [(GITR-L)3]2-Fc (1%); III, monovalent Fc-k-in-h-(GITR-L)3 (0%); IV, anti-GITR mAb (2%); V, dodecavalent Fc-GITR-L (3%); and VI, dodecavalent anti-GITR (2%). All constructs contain LALA, while hexamer constructs contain RGY in addition to LALA. eg, Human PBMC costimulation assay (n = 5 donors) following indicated treatments in the presence of anti-CD3. Cells and supernatants were harvested/collected to assess cell viability (t = 96 h) (e), IL-2 (t = 48 h) (f) and IFN-γ (t = 96 h) (g). Data presented as mean ± s.e.m. Statistical significance was calculated by two-way analysis of variance (ANOVA) with Tukey’s correction for multiple comparisons (statistic refers to hexameric Fc-GITR-L versus monomeric GITR-L) (n = 2 technical cell culture replicates within a single experiment). h, GITR and PD-1 expression on transfected and activated Jurkat-NFκB-huGITR+ reporter cells (representative data of n = 2 independent experiments with similar results). i, NFκB signaling in an anti-CD3-activated Jurkat-NFκB-huGITR+ reporter assay following threefold titration with the anti-huPD-1-huGITR-L bispecific. A dodecavalent Fc-huGITR-L construct (with RGY and LALA mutations) was utilized as a positive control using Jurkat-NFκB-huGITR+ cells (indicated by red circles) (n = 2 technical cell culture replicates within a single experiment). Source data
Fig. 2
Fig. 2. Expression of PD-1 and GITR in human T cells and in vitro characterization of anti-huPD-1-huGITR-L bispecific fusion protein.
ad, Percentage of PD-1 and GITR double-positive T cells following anti-CD3/CD28 activation of human CD4+ (a) and CD8+ T cells (b) (n = 3 donors, data presented as mean ± s.e.m.), and correlation of GITR and PD-1 mRNA-seq expression in live cells (c) (n = 21 tumors) and T cells (d) (n = 18 tumors) sorted from HNSCC tumor samples. Statistical significance was calculated with nonlinear regression. Live and T cells, P = 0.00001 and P = 0.067, respectively. e, Representative CD8, PD-1, GITR and FoxP3 multiplex immunofluorescence imaging (excluding PanCK, CD3 and DAPI) and spatial distribution cell density heatmaps (cells mm–2) (CD8, PD-1 and GITR) of FFPE sections of primary HNSCC (excluded compartment) and matching lymph node metastases (LN mets) (20×). Selected areas of GITR+PD-1+CD8+ T cells are indicated in white boxes. Experiment is representative of n = 3 tumor samples. f,g, Schematic diagram of anti-PD-1–GITR-L bispecific (f) and an example of a 2D class average based on negative-stain TEM of the whole molecule (g). h,i, Binding of anti-huPD-1-huGITR-L to huPD-1- (h) and GITR-transfected (i) HEK293S cells (n = 2 technical cell culture replicates within a single experiment). j,k, Binding of anti-huPD-1-huGITR-L to human CD4+CD45RACCR7+ central memory T cells (TCM) (j) and CD4+CD45RACCR7 effector memory T cells (TEM) (k) (n = 2 donors). l,m, GITR-NFκB (l) and PD-1/PD-L1 NFAT signaling (m) on HEK293-NFκB-huGITR+ and Jurkat-NFAT-huPD-1+ (with CHO-K-PD-L1+ cells) reporter cells following threefold titration of the anti-huPD-1-huGITR-L bispecific (n = 2 technical cell culture replicates within a single experiment). MFI, median fluorescence intensity. RLU, relative luminescence units. Source data
Fig. 3
Fig. 3. The anti-muPD-1-muGITR-L bispecific induces dose-dependent growth inhibition and peripheral target engagement, T cell activation and proliferation in CT26 and EMT6 tumor-bearing mice.
a,b, Growth inhibition of CT26 and EMT6 cells in syngeneic mice by anti-muPD-muGITR-L. Titration of the bispecific at indicated doses was administered IV following one dose in CT26 (a) and EMT6 (b), respectively. Each point on the curve represents mean tumor volume for each group (n = 10 mice). c,d, Serum concentration versus time profile following IV administration of the bispecific at the indicated doses in CT26 (c) and EMT6 (d) (n = 4 mice). ej, Flow cytometry analysis of blood lymphocytes after treatment with anti-muPD-1-muGITR-L. Blood samples were collected from CT26 and EMT6 tumor-bearing mice at the indicated times following either treatment with isotype control or titration of anti-muPD-muGITR-L administered IV following one dose, at the indicated doses. CD4+ T cells were assessed for percentage of GITR (CT26 (e) and EMT6 (g)) and PD-1 (CT26 (f) and EMT6 (h)) expression. Percentage target saturation was standardized to 0% at t = 0. TIGIT+, CD62CD44+ TCM and Ki67+ are shown as a percentage of CD4+ while Ki67+ is shown as a percentage of CD8+ T cells in the blood (CT26 (i) and EMT6 (j)). Results for five animals per group from a single experiment were averaged, and standard deviations are shown, Statistical significance was calculated using two-way ANOVA with Tukey’s correction for multiple comparisons (statistics refer to anti-PD-1–GITR-L bispecific (25.8, 8.6 or 12.9, 2.9 or 6.5 mg kg–1) versus isotype control). LLOQ, lower level of quantitation. Source data
Fig. 4
Fig. 4. The anti-muPD-muGITR-L bispecific induces increased activation and proliferation of TDLNs and intratumoral T and NK cells in CT26 and EMT6 tumor-bearing mice.
af, Flow cytometry analysis of TDLNs and TiLs after treatment with anti-muPD-muGITR-L. Draining lymph nodes and tumors were collected from CT26 and EMT6 tumor-bearing mice 120 h following treatment with isotype control or a titration of anti-muPD-muGITR-L administered IV following one dose at the indicated doses. ICOS+, CD62LCD44+ TEM and Ki67+ are shown as a percentage of CD4+ (a) and CD8+ T cells (b) in CT26 TDLNs. ICOS+, CD62LCD44+ TEM and Ki67+ are shown as a percentage of CD4+ (c) and CD8+ T cells (d) in EMT6 TDLNs. Ki67+ is shown as a percentage of CD8+ T cells and CD25+FoxP3+ as a percentage of CD4+ T cells in the tumor (CT26 (e) and EMT6 (f)). af, Results for five animals per group were averaged, and standard deviations are shown. Statistical significance was calculated by two-way ANOVA with Tukey’s correction for multiple comparisons (statistics refer to the anti-PD-1–GITR-L bispecific (25.8, 8.6 or 12.9, 2.9 or 6.5 mg kg–1) versus isotype control). g,h, Single-cell mRNA-seq analysis of CD45+-enriched TiLs following treatment with the anti-muPD-1-muGITR-L bispecific (25.8 mg kg–1) versus the isotype in the CT26 model. Tumors were collected 5 days following treatment. Supervised clustering of CD8+ T (g) and NK (h) cells following treatment with the anti-muPD-1-muGITR-L bispecific versus isotype control (orange rectangle, upregulated genes; blue rectangle, downregulated genes). Specific genes are indicated by yellow highlighting (n = 2 mice). Source data
Fig. 5
Fig. 5. The anti-huPD-1-huGITR-L bispecific induces MC-38 tumor growth inhibition in genetically engineered and humanized mouse models.
a,b, Growth inhibition of MC-38 cells by anti-muPD-1-huGITR-L (a) and anti-huPD-1-muGITR-L chimeric bispecific (b) in human GITR and PD-1 transgenic models in comparison to anti-muPD-muGITR-L surrogate bispecific in WT mice. Bispecific domains are indicated by the following colors: purple, variable domain of anti-muPD-1; green, muGITR-L; yellow, huGITR-L; and orange, variable domain of anti-huPD-1. Mice were treated with one dose of isotype at 1.0 mg kg–1, surrogate bispecific at 1.3 mg kg–1 and chimeric bispecific at 1.46 mg kg–1 (n = 8 mice). c,d, TIGIT+, CD62LCD44+ TCM and Ki67+ are shown as a percentage of CD4+ in blood while CD62LCD44+ TCM and Ki67+ are shown as a percentage of CD8+ T cells following treatment with anti-muPD-1-huGITR-L in huGITR homozygous (HO) mice (c) and anti-huPD-1-muGITR-L in huPD-1 HO mice (d). e,f, ICOS+, CD62LCD44+ TEM, Ki67+ and CD226+ are shown as a percentage of CD4+ and CD8+ T cells in TDLN following treatment with anti-muPD-1-huGITR-L in huGITR HO mice (e) and anti-huPD-1-muGITR-L in huPD-1 HO mice (f). g,h, Ki67+, CD226+, KCNA3+, SLAMF6TIM3+ and TOX+ are shown as a percentage of CD8+ T cells in the tumor, and CD25+FoxP3+ as a percentage of CD4+ T cells following treatment with anti-muPD-1-huGITR-L in huGITR HO mice (g) and anti-huPD-1-muGITR-L in huPD-1 HO mice (h). Tissues were collected 120 h after treatment. Results from five animals per group were averaged, and standard deviations are shown. i,j, Growth inhibition of xenograft PC-3 (i) and HCT-116 (j) cells in NSG allogeneic PBMC-reconstituted mice following treatment with one dose of anti-huPD-1-huGITR-L at the indicated doses. Each point on the curve represents mean ± s.e.m. of tumor volume for each group (n = 8 per group in transgenic HO huPD-1 and huGITR and PC-3 mouse models, and n = 10 per group in HCT-116 mouse model). Statistical significance was calculated by two-way ANOVA with Tukey’s correction for multiple comparisons (statistics refer to chimeric anti-PD-1–GITR-L bispecific versus isotype control). **P = 0.0005, ***P = 0.0001. Source data
Fig. 6
Fig. 6. The anti-muPD-1-muGITR-L bispecific has different bioactivity in vivo in comparison to anti-muPD-1 plus muGITR-L combination and monotherapies in anti-PD-1 resistant tumor syngeneic models.
ac, Growth inhibition of CT26 (a), EMT6 (b) and JC cells (c) in syngenic mice following indicated treatments and doses (IP frequency indicated by arrows). Each point on the curve represents the mean tumor volume for each group (n = 7 mice for CT26 and n = 10 for EMT6 and JC). d,e, Flow cytometry analysis of draining lymph nodes collected from CT26 and JC models (24 h post second dose). ICOS+ and Ki67+ are shown as a percentage of CD8+ T cells (CT26 (d) (n = 3 mice) and JC (e) (n = 4 mice)). f,g, CT26 tumor growth rechallenge study (f) (n = 7 mice) and accumulation of MuLV gp70-antigen-specific T cells (g) in a fully regressed CT26 model following treatment with anti-muPD-muGITR-L bispecific (n = 4 mice). hk, Number of CT26-specific GZMB+ CD8+ T cells (TDLNs (h) (n = 3 mice)), percentage of CT26 cell killing measured by caspase-3/7 staining (i), percentage of CT-26 specific GZMB+ CD8+ T cells (TILS (j) (n = 5 mice)) and GZMB+ shown as percentage of CD3CD49b+ NK and CD8+ T cells in the tumor (k) (n = 5 mice). l, Growth inhibition of EMT6 cells in syngeneic mice by anti-muPD-muGITR-L bispecific and 1:1 combination following in vivo depletion of CD8+ and CD4+ T cells (n = 10 mice). m,n, Tumor NanoString analysis of CD8a (m) and GZMB genes (n) (CT26 model, n = 5 mice). Each point on the curve represents the mean tumor volume for each group. ah, jn, Data presented as mean ± s.e.m. Statistical significance was calculated by two-way ANOVA with Tukey’s correction for multiple comparisons (statistics refer to anti-PD-1–GITR-L bispecific versus combination). Source data
Fig. 7
Fig. 7. The anti-huPD-1-huGITR-L bispecific enhances in vitro PBMC costimulation and reverses Treg suppressive activity in comparison to the combination of anti-PD-1 plus GITR-L.
ad, Human PBMC costimulation assay following the indicated treatments (in the presence of anti-CD3). Cells and supernatants were harvested/collected for assessment of proliferation (a) (t = 48 h, half-maximal effective concentration (EC50) = 3.3 nM, n = 12 donors) and IL-2 (b) (t = 48 h, EC50 = 1.5 nM, n = 8 donors), IFN-γ (c) and TNF-β (d) (t = 96 h, EC50 = 3.9 nM and EC50 = 2.6 nM, and n = 12 and 8, respectively). Data presented as mean ± s.e.m. (n = 2 technical cell culture replicates within a single experiment). e,f, IFN-γ secretion (e) (t = 120 h) in autologous CD4+ T cell MLR (n = 7 donors, EC50 = 0.45 nM) and cell proliferation (f) (t = 72 h, EC50 = 0.8 nM) in CMV antigen recall assay (n = 3). Data presented as mean ± s.e.m. (n = 2 technical cell culture replicates within a single experiment). g, Treg suppression assay (n = 2 donors) measuring absolute number of CFSE-labeled divided Teff cells in response to anti-CD3 and indicated treatments in the presence and absence of Treg cells (t = 72 h, Teff/Treg = 1). Statistical significance was calculated by two-way ANOVA with Tukey’s correction for multiple comparisons (statistics refer to anti-PD-1–GITR-L bispecific versus combination; representative data of n = 2 independent experiments with similar results). Source data
Fig. 8
Fig. 8. In vitro and in vivo crossreactivity of anti-huPD-1-huGITR-L to cynomolgus monkeys.
a,b, Binding of anti-huPD-1-huGITR-L to cynomolgus PD-1 (a) and GITR (b) transfected HEK293S cells (n = 3 technical cell culture replicates within a single experiment). c,d, Binding of anti-huPD-1-huGITR-L to cynomolgus CD28+CD95+ central memory (c) and CD28CD95+ effector memory CD4+ T cells (d) (n = 3 donors). e, Cynomolgus monkey PBMC proliferation assay (n = 3 donors) following the indicated treatments with threefold titration (in the presence of anti-CD3; t = 48 h). f, NFκB signaling in HEK293-NFκB-cynoGITR+ reporter assay following threefold titration with the indicated treatments (n = 3 technical cell culture replicates within a single experiment). gk, Serum concentration versus time profile (g), saturation of PD-1 (h) and GITR (I) and upregulation of TIGIT (j) and Ki67 (k) in CD4+ memory T cells following IV bolus administration of anti-huPD-1-huGITR-L bispecific at indicated doses in cynomolgus monkeys (n = 3 NHP). Data presented as mean ± s.e.m. Statistical significance was calculated by two-way ANOVA with Tukey’s correction for multiple comparisons (statistics refer to anti-PD-1–GITR-L bispecific (30 mg kg–1) versus vehicle). Source data
Extended Data Fig. 1
Extended Data Fig. 1. GITR structural alignment comparison with other TNFR members and flow cytometry cell bridging assay with the anti-PD-1-GITR-L bispecific.
(A and B) GITR (magenta) overlaid with OX40 (PDB: 2HEV, rainbow, RMS 1.3) (A) and 4-1BB (PDB: 6BWV, rainbow, RMS 1.1) (B). Note that CRDI of GITR (pCRD1GITR) is only partially resolved due to compositional heterogeneity. (C) A 1:1 combination of CFSE-labeled PD-1-HEK293 and Violet-blue-labeled GITR-HEK293 cells were treated with 2.5 µgs/ml of isotype control, anti-PD-1 mAb, isotype-GITR-L construct and anti-PD-1-GITR-L bispecific for 30 mins.
Extended Data Fig. 2
Extended Data Fig. 2. Human PD-1 and GITR expression on TILs by mRNA-seq and IHC and LC-MS of anti-huPD-1-huGITR-Lbispecific.
(A) Gene mRNA expression of GITR and PD-1 across different tumor types (UCSF-IPI, n = 50 tumors). For box-and-whiskers plots, boxes represent 25th and 75th percentiles, center lines indicate median values and whiskers represent minimum and maximum values. (B) Representative human PD-1 and GITR expression by IHC on colon, pancreatic and breast cancer tissues. Frozen tissue microarray samples were used for PD-1 and GITR staining. Scale bars indicate 50 µm (original magnification 40x, representative staining of n = 5 tissues). (C) Percentage of GITR+PD-1+ cells of total CD8+ T cells within inflamed, excluded and desert compartments of HNSCC including the tumor, stroma, and tumor-proximal lymph node aggregates (n = 8 samples) (D) LC-MS of reduced and de-glycosylated anti-huPD-1-huGITR-L bispecific (hIgG1-LALA) with theoretical and experimental masses of light (LC) and heavy chain (HC).
Extended Data Fig. 3
Extended Data Fig. 3. Binding of anti-PD-1-GITR-L-hIgG1-LALA bispecific to human FcγR-CHO stable transfectants/complement (C1q) and binding/in vitro bioactivity of anti-PD-1-GITR-L bispecific following de-glycosylation with PNGase F.
(A to F) Binding of anti-PD-1-GITR-L-hIgG1-LALA bispecific, and controls to human FcγR-CHO stable transfectants (A to E) (representative data of n = 2 independent experiments), and human C1q (F) (n = 2 technical cell culture replicates within a single experiment). (G to J) Binding of de-glycosylated variants of anti-huPD-1-huGITR-L to human PD-1 (G) and GITR (H) transfected HEK293S cells (n = 2 technical cell culture replicates within a single experiment), and in vitro bioactivity (GITR-NFκB and PD-1/PD-L1 NFAT signaling on HEK293-NFκB-huGITR+ and Jurkat-NFAT-huPD-1+ reporter cells) (n = 2 technical cell culture replicates within a single experiment) (I and J). (K and L) Size exclusion chromatograms of N151-N183 and N151A-N183A anti-PD-1-GITR-L mutants. Source data
Extended Data Fig. 4
Extended Data Fig. 4. Expression of GITR and PD-1 on mouse T cells before/after anti-muPD-1-muGITR-L dosing, toxicity following dosing of anti-muPD-1-muGITR-L in CT26 model, and single-cell mRNAseq analysis of CD45 TILs.
(A) Flow cytometry analysis of GITR and PD-1 expression on tumor infiltrated CD8+ T cells collected from CT26 and EMT6 models (n = 5 mice). (B) Flow cytometry analysis of PD-1 expression on tumor (n = 5 per group) and TDLN (n = 3 per group) infiltrated CD4+ and CD8+ T cells following treatment of CT26 model with isotype-GITR-L construct (1.43 mg/kg, 3X, ip, tissues collected 24 hrs after 3rd dose). Statistical significance was calculated with two-way ANOVA with Tukey’s correction for multiple comparisons (statistics refer to isotype-GITR-L vs isotype control). Flow cytometry analysis of blood (C) and TDLN (D) Treg cells following treatment with anti-muPD-1-muGITR-L in CT26 and EMT6 tumor bearing mice 120 hours post dose (n = 5 per group). CD25+FoxP3+ are shown as a percent of CD4+ T cells. Data are presented as mean values +/- SEM. (E) anti-muPD-muGITR-L dose-dependent increase of GZB+ (HALO imaging analysis) intra-tumoral immune cells by IHC in CT26 model (7 days after one dose). Representative GZB tumor IHC staining from selected mice is also shown. Scale bars indicate 200 µm (original magnification 20x) (n = 4 per group). Data are presented as mean values +/- SEM. (F) Serum ALT level in treated mice at efficacious dose (i.p. 3Qw for 1 week at 4.3 mg/kg) in CT26 model (n = 3 per group). Data are presented as mean values +/- SEM (G) Representative H&E IHC (representative staining of n = 3 tissues) of liver samples (FFPE). Serum and liver samples were collected 1 day after third dose. Scale bars indicate 50 µm (original magnification 20x). (H) Plasma level of cytokines and chemokines collected 72 hours after one dose of anti-PD-1-GITR-L bispecific (n = 5 per group). Data are presented as mean values +/- SEM. Statistical significance was calculated with two-way ANOVA with Tukey’s correction for multiple comparisons (statistics refer to anti-PD-1-GITR-L at 25.8 mg/kg vs isotype control). (I to K) Single-cell mRNA-seq analysis of CD45+ enriched tumor infiltrating lymphocytes following treatment with anti-muPD-1-muGITR-L bispecific (25.8 mg/kg) vs isotype in the CT26 model. Tumors were collected 5 days following treatment. (I) UMAP plots align immune cell subset clusters comparing effect of isotype vs anti-muPD-1-muGITR-L bispecific. (J) Bar plot shows the percentages of immune cell subset clusters. (K) Unique gene expression profile of CD8+ T, NK, Treg, myeloid and stroma cell populations (white square). Source data
Extended Data Fig. 5
Extended Data Fig. 5. Downstream pathway analysis following dosing of anti-muPD-1-muGITR-L bispecific in CT26 tumor syngeneic model, and rat/mouse cross reactivity of anti-huPD-1-huGITR-L bispecific.
(A) Gene ontology biological processes (GO-BP) enrichment analysis of intratumoral CD8+ T and NK cells between isotype and anti-PD-1-GITR-L-treated mice shows enriched pathways (hypergeometric test, adjusted P-values obtained by Benjamini-Hochberg procedure). (B to E) Binding of Alexa fluor (AF) 647-labeled anti-huPD-1-huGITR-L to anti-CD3 activated rat (B and C) and mouse splenocytes (D and E) (t = 48 and 72 hrs). Two independent experiments were performed. Source data
Extended Data Fig. 6
Extended Data Fig. 6. Expression/in vitro/in vivo characterization of GITR and PD-1 in heterozygous and homozygous GEM, and anti-muPD-1-muGITR-L enhanced survival of CT26, EMT6 and JC tumor bearing mice in comparison to monotherapies and combination.
(A and B) Mouse and human target expression on anti-CD3 activated CD4+CD44+CD62L+ T cells isolated from spleens of indicated mice (A. n = 2 & B. n = 2). (C and D) IL-2 secretion following treatment with mouse surrogate and chimeric bispecifics (C: mGITR-L-mPD-1 and hGITR-L-mPD-1, and D: mGITR-L-mPD-1 and mGITR-L-hPD-1) using anti-CD3 activated splenocytes isolated from indicated mice. Color of bispecific domains indicated: purple = variable domain of anti-muPD-1, green = muGITR-L, yellow = huGITR-L and orange = variable domain of anti-huPD-1. A single experiment was conducted with 2 replicates and mean values were plotted. (E) Representative human and Mouse PD-1 and GITR expression by IHC (representative staining of n = 4 tissues) on spleens isolated from indicated mice. Scale bars indicate 100 µm (original magnification 20x). (F and G) Tumor baseline study of MC-38 cell line in huGITR (F) and huPD-1 (G) homozygous vs wild-type C57BL/6 mice following inoculation of 1 and 3 × 10⁶ cells/mouse. Each point on the curve represents the mean tumor volume for each group (n = 5 mice per group for huGITR & n = 7 mice per group for hu PD-1). Data are presented as mean values +/- SEM. (H to J) Mice survival following dosing of anti-muPD-1-muGITR-L bispecific. Results depict cumulative survival curves with indicated treatments: (H) CT26, (I) EMT6 and (J) JC models (n = 10 mice per group, ~ 100 mm3 tumor at time of dosing). Statistical significance was calculated with log-rank test with post-hoc analysis for multiple comparisons (statistics refer to anti-PD-1-GITR-L vs combo). Source data
Extended Data Fig. 7
Extended Data Fig. 7. The anti-muPD-1-muGITR-L-mIgG2a-DANA bispecific has different bioactivity in vivo in comparison to the combination of anti-PD-1 (mIgGa-DANA) and isotype-GITR-L (mIgG2a-DANA or mIgG2a) or anti-GITR (mIgG2a) in JC tumor syngeneic models, and anti-muPD-1-muGITR-L induced a higher propensity for immune activity within tumors than the combination and monotherapies.
(A) Growth inhibition of JC tumor model following indicated treatments and doses (i.p. frequency indicated by arrows). Each point on the curve represents the mean tumor volume for each group (n = 7 mice). Data are presented as mean values +/- SEM. Statistical significance was calculated with two-way ANOVA with Tukey’s correction for multiple comparisons (statistics refer to nti-PD-1-GITR-L vs anti-PD-1 plus anti-GITR-mIgG2a). (B) Tumor Nanostring gene clustering analysis. Heatmap was generated by R package pheatmap (version 1.0.12), and (C) number of intra-tumoral altered genes (> 2-fold) following treatment with the combination vs anti-muPD-1-muGITR-L bispecific in the CT26 model. (D to F) Tumor CD8+ T (D), cytotoxicity (E) and NK cell (F) Nanostring gene signature quantification analysis following treatment of CT26 with indicated treatments (n = 5 mice). For box-and-whiskers plots, boxes represent 25th and 75th percentiles, center lines indicate median values and whiskers represent minimum and maximum values. (G) Tumor Nanostring analysis of NK cell activating and inhibitory receptor genes. (H) Downstream pathway analysis following dosing of anti-muPD-1-muGITR-L bispecific in CT26 tumor syngeneic model. Gene ontology biological processes (GO-BP) enrichment analysis of TILs between anti-PD-1-GITR-L and combo-treated mice shows enriched pathways (hypergeometric test, adjusted P-values obtained by Benjamini-Hochberg procedure). Tumors were collected 24 hrs following second dose. Source data
Extended Data Fig. 8
Extended Data Fig. 8. The anti-huPD-1-muGITR-L and anti-muPD-1-huGITR-L bispecifics have different bioactivity in vivo in comparison to anti-PD-1 plus isotype-GITR-L combination and monotherapies in B16F10 tumor syngeneic models in huPD-1 and huGITR HO Tg mice, and bioactivity, anti-tumor efficacy and toxicity of gemcitabine and TGFβ blockade in combination with anti-PD-1-GITR-L in 4T1 mouse syngeneic tumor model.
(A and B) Growth inhibition of B16F10 in huPD-1 HO Tg mice (A) and in huGITR HO Tg mice (B) following indicated treatments and doses (i.p. frequency indicated by arrows). Each point on the curve represents the mean tumor volume for each group (n = 8 mice). (C and D) Flow cytometry analysis of tumor infiltrated T cells collected from both models (120 hours post dose, n = 5 mice). Ki67+, CD226+, KCNA3+ and SLAMF6-TIM3+ are shown as a percent of CD8+ T cells ((C) huPD-1 HO Tg, and (D) huGITR HO Tg). Data are presented as mean values +/- SEM. Statistical significance was calculated with two-way ANOVA with Tukey’s correction for multiple comparisons (statistics refer to anti-PD-1-GITR-L vs combo). (E) In vitro cell killing of 4T1 mouse syngeneic cell line to selected chemotherapeutic agents (fluorouracil, paclitaxel, doxorubicin and gemcitabine) using CellTiter-Glo cell viability assay (n = 3 technical cell culture replicates within a single experiment). (F) Dose range titration of gemcitabine in 4T1 model at indicated doses (i.p. Q3DX4). (G and H) Growth inhibition of 4T1 cells in syngeneic mice by combination of anti-muPD-muGITR-L with anti-TGFβ (G) or gemcitabine (H) following indicated treatments and doses (i.p., frequency indicated by arrows). Data are presented as mean values +/- SEM. (I) Change of mice body weight following indicated treatments. Gemcitabine was dose i.p. Q3DX4 and anti-muPD-1-muGITR-L bispecific was dose i.p. 3qW for 1 week. Each point on the curve represents the mean tumor volume for each group (n = 10 mice). Statistical significance was calculated with two-way ANOVA with Tukey’s correction for multiple comparisons [statistic refer to gemcitabine (100 mg/kg) vs vehicle, anti-PD-1-GITR-L+ TGFβ vs anti-PD-1-GITR-L; and anti-PD-1-GITR-L vs gemcitabine]. Source data
Extended Data Fig. 9
Extended Data Fig. 9. PD-1 and GITR receptor copy number, expression and anti-PD-1-GITR-L cross-reactivity on normal human and cynomolgus monkey tissues by IHC, and Hexagonal conformation model of GITR-L-GITR complex.
(A and B) GITR and PD-1 receptor copy number on PHA activated (t = 48 hrs) human (A) and cynomolgus monkey (B) PBMCs (n = 8 donors per group). Data are presented as mean values +/- SEM. Statistical significance was calculated with two-way ANOVA with Tukey’s correction for multiple comparisons (statistic refer to GITR vs PD-1 expression). (C) Representative human and Cyno PD-1 and GITR expression by IHC (representative staining of n = 2 tissues) on tonsil, lymph node, spleen, and stomach tissues. FFPE tissue samples were used for PD-1 and GITR (Human TMA: ZPL2 and ZPL3, and Cyno: I09447 and I08762) staining. Scale bars indicate 50 µm (PD-1) and 60 µm (GITR) (original magnification 40x). (D) Representative anti-huPD-1-huGITR-L bispecific binding on normal human and cynomolgus monkey tissues using human to human pre-complex conjugated IHC staining method. Scale bars indicate 200 µm (original magnification 20x, representative staining of n = 2 tissues). (E) GITR-L trimeric units are shown in light blue, and GITR monomeric units from different GITR trimers are shown in pink and orange. Source data
Extended Data Fig. 10
Extended Data Fig. 10. Proposed mechanism of action of FcγR-binding independent anti-PD-1-GITR-L bispecific, and Flow cytometry gating strategy for lymphocytes isolated from TLNs and TILs from CT26 and EMT6 treated mice.
(A) Proposed MoA of FcγR-dependent anti-GITR mAb or GITR-L construct: weak clustering/agonism. (B) Proposed MoA of the combination of FcγR-dependent anti-GITR mAb or GITR-L construct plus αPD-1 mAb: weak clustering/agonism even upregulation of GITR after αPD-1 engagement. (C) Anti-PD-1-GITR-L bispecific works by inducing a FcγR-binding independent anti-PD-1-mediated GITR clustering/agonism (interaction in trans has not been represented in diagram). (D to E) Flow cytometry gating strategy for lymphocytes isolated from TLNs (D) and TILs (E).

Comment in

Similar articles

Cited by

References

    1. Keir ME, Butte MJ, Freeman GJ, Sharpe AH. PD-1 and its ligands in tolerance and immunity. Annu. Rev. Immunol. 2008;26:677–704. - PMC - PubMed
    1. Sharpe AH, Pauken KE. The diverse functions of the PD1 inhibitory pathway. Nat. Rev. Immunol. 2017;18:153–167. - PubMed
    1. Wei SC, Duffy DR, Allison JP. Fundamental mechanism of immune checkpoint blockade therapy. Cancer Discov. 2018;8:1069–1086. - PubMed
    1. Kim JM, Chen DS. Immune escape to PD-L1/PD-1 blockade: seven steps to success (or failure) Ann. Oncol. 2016;27:1492–1504. - PubMed
    1. Clouthier DL, Watts TH. Cell-specific and context-dependent effects of GITR in cancer, autoimmunity, and infection. Cytokine Growth Factor Rev. 2014;25:91–106. - PubMed

Publication types

Substances