. 2022 Feb;12(2):692-707.
doi: 10.1016/j.apsb.2021.07.016. Epub 2021 Jul 21.

Abrogation of HnRNP L enhances anti-PD-1 therapy efficacy via diminishing PD-L1 and promoting CD8+ T cell-mediated ferroptosis in castration-resistant prostate cancer

Affiliations

Abrogation of HnRNP L enhances anti-PD-1 therapy efficacy via diminishing PD-L1 and promoting CD8+ T cell-mediated ferroptosis in castration-resistant prostate cancer

Xumin Zhou et al. Acta Pharm Sin B. 2022 Feb.

Abstract

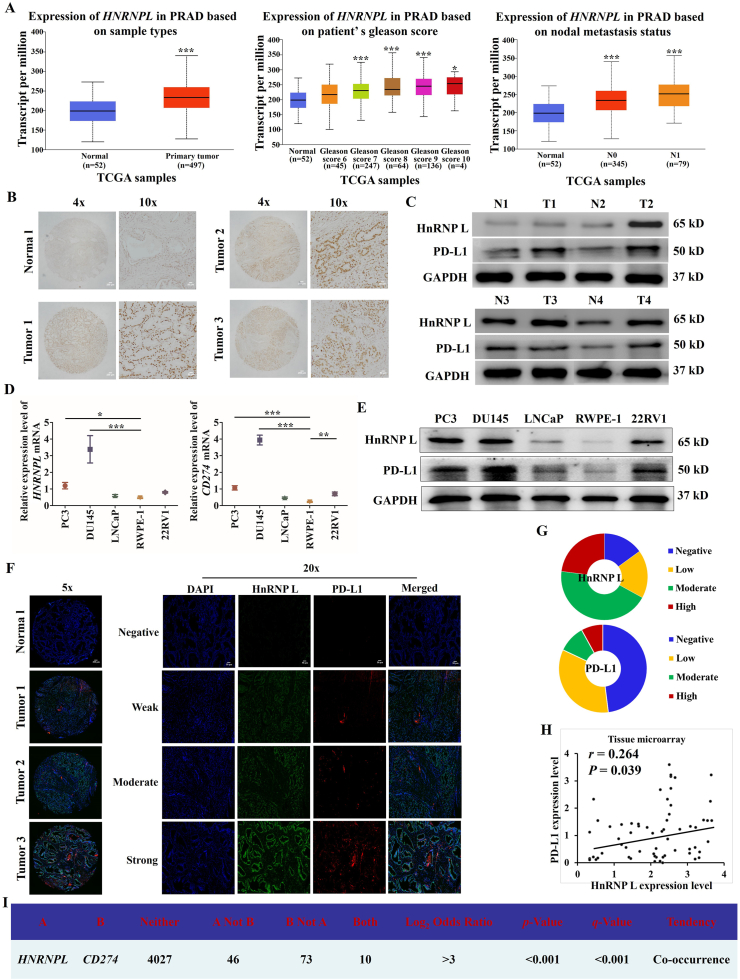
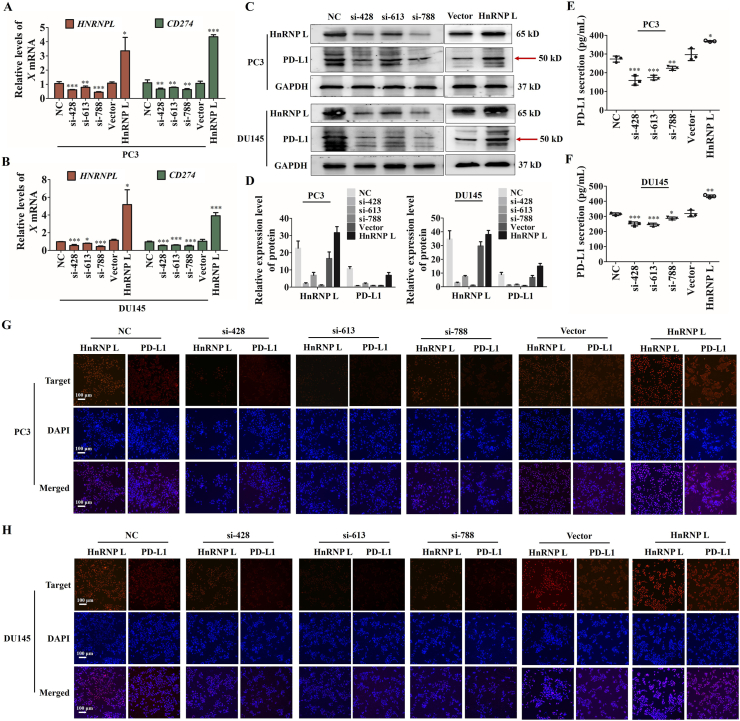
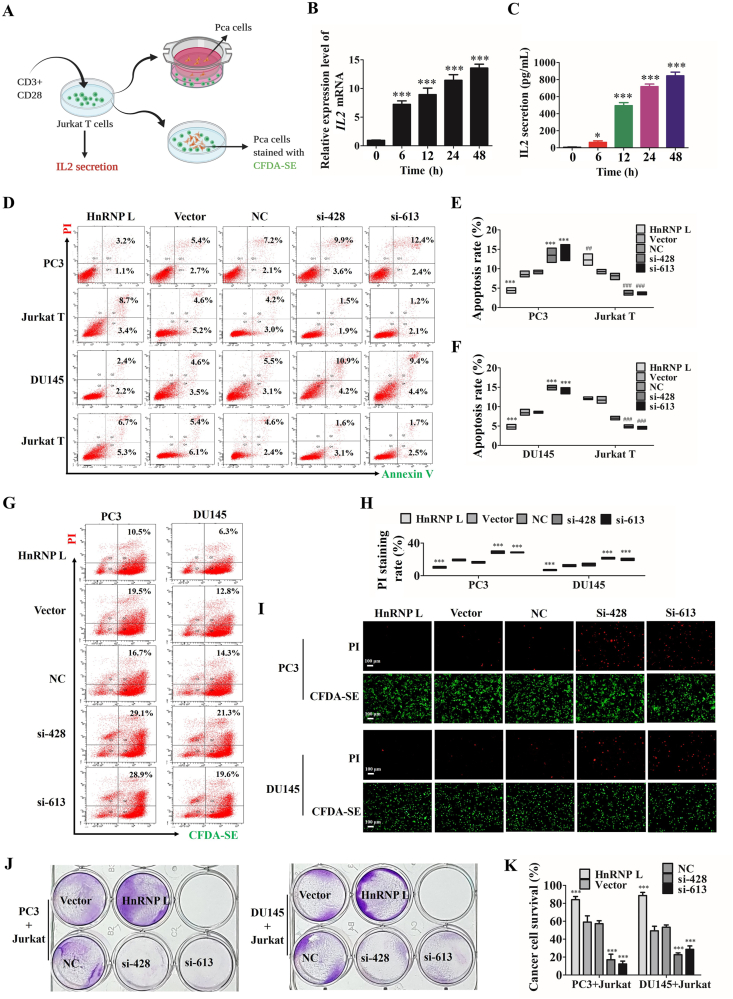
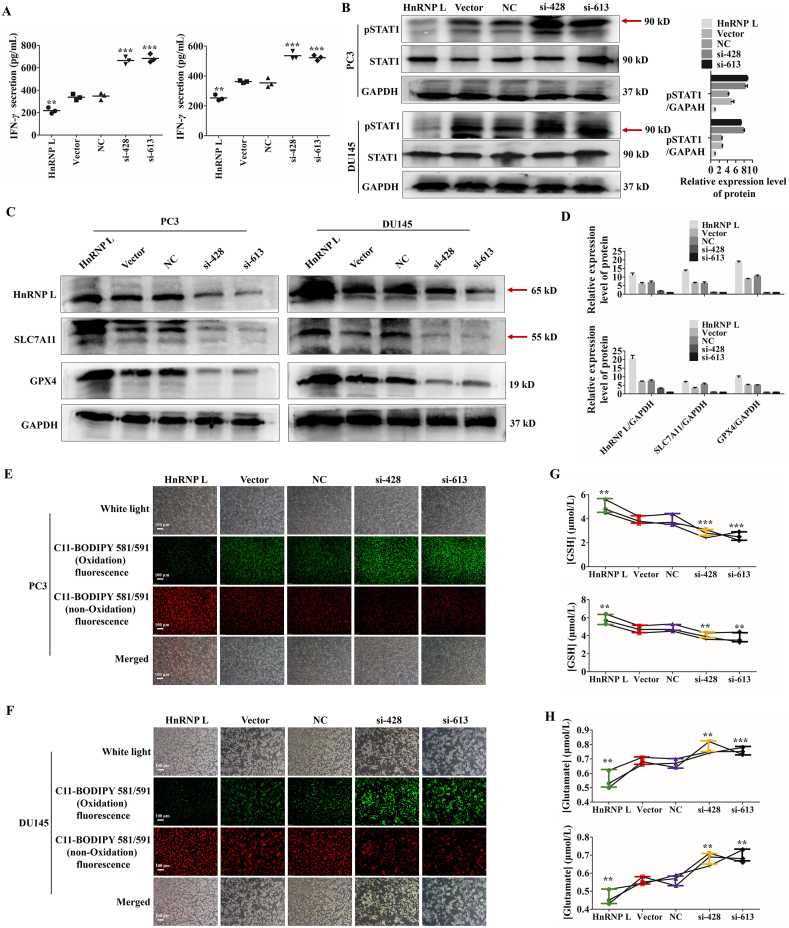
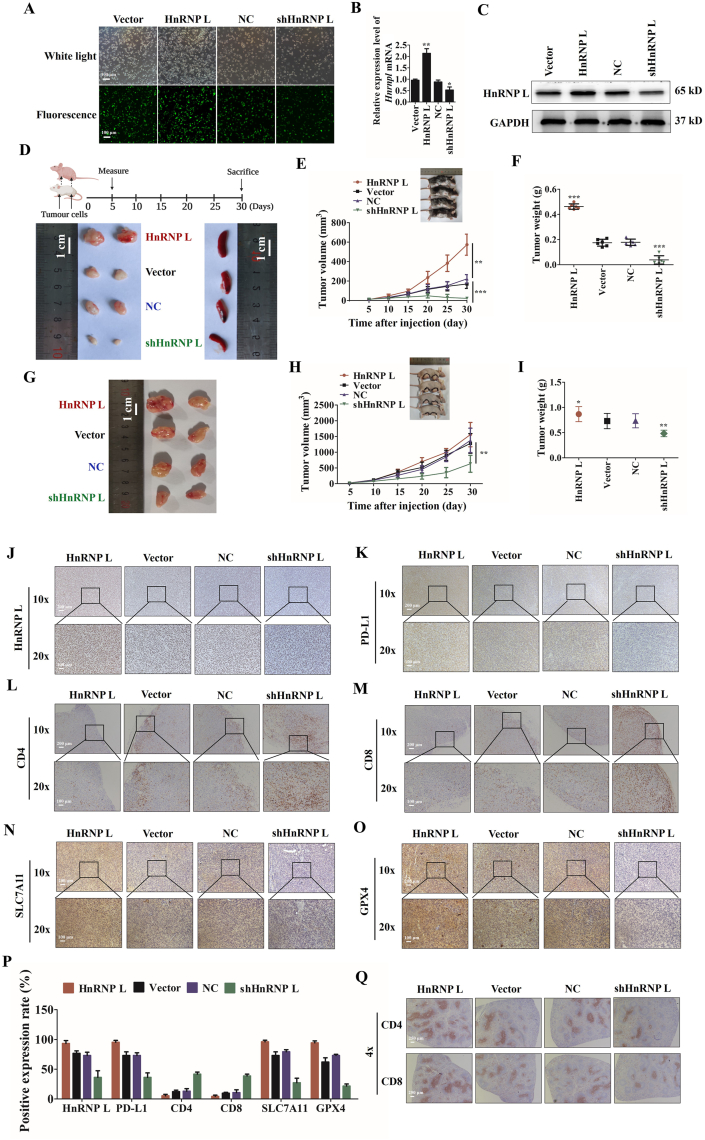
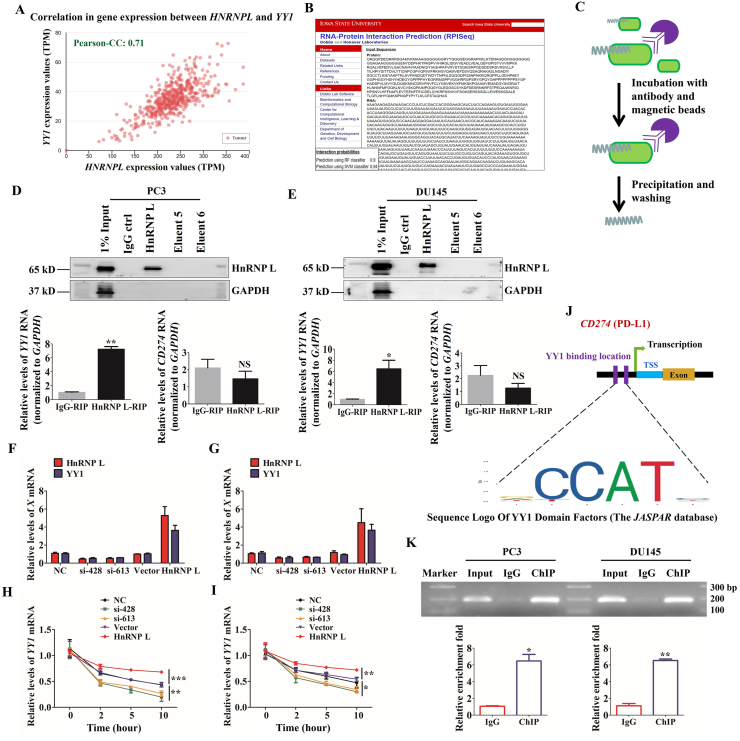
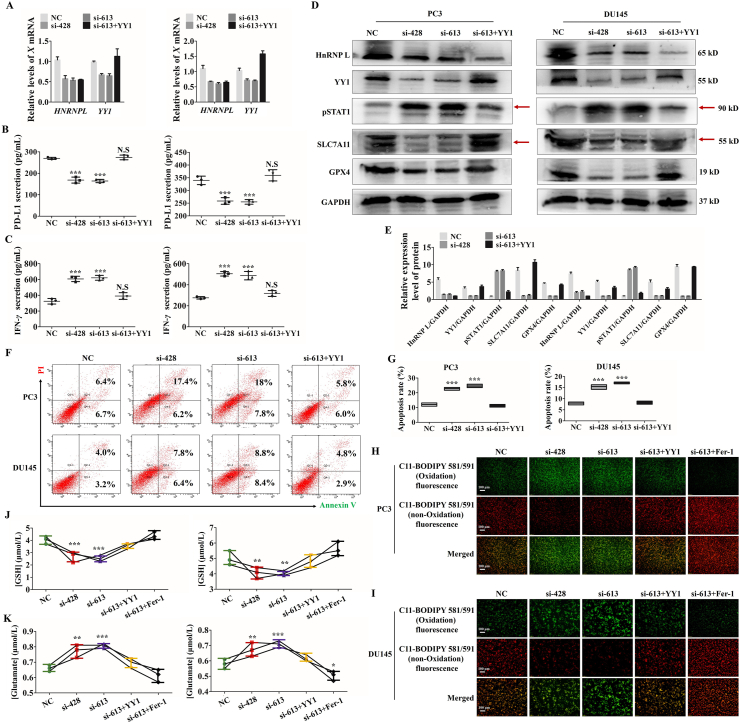
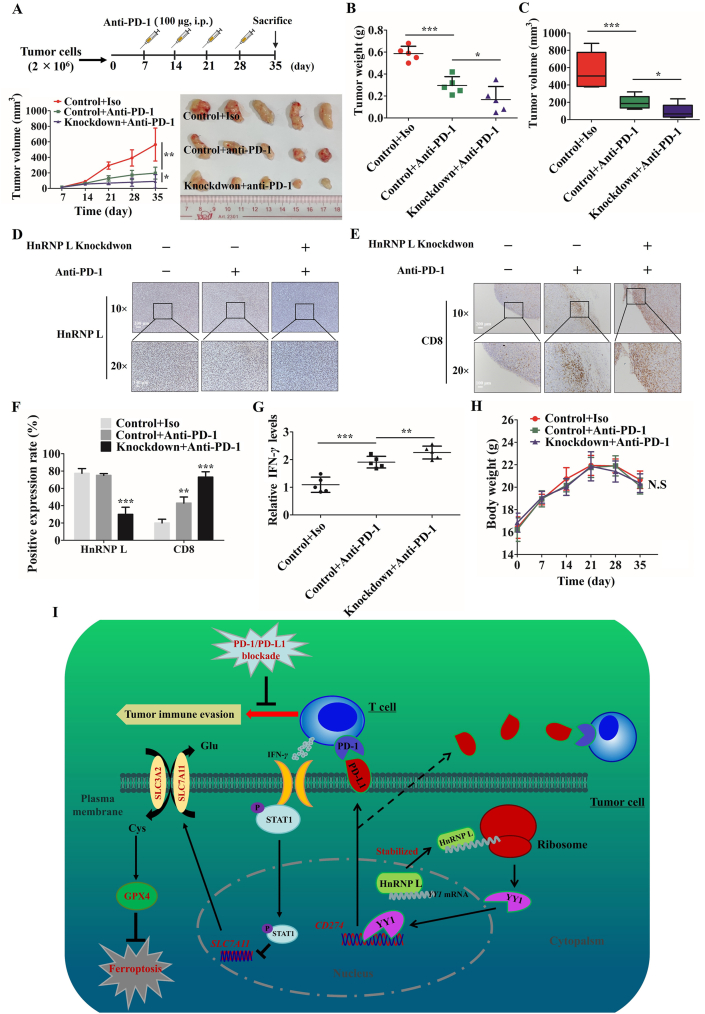
Owing to incurable castration-resistant prostate cancer (CRPC) ultimately developing after treating with androgen deprivation therapy (ADT), it is vital to devise new therapeutic strategies to treat CRPC. Treatments that target programmed cell death protein 1 (PD-1) and programmed death ligand-1 (PD-L1) have been approved for human cancers with clinical benefit. However, many patients, especially prostate cancer, fail to respond to anti-PD-1/PD-L1 treatment, so it is an urgent need to seek a support strategy for improving the traditional PD-1/PD-L1 targeting immunotherapy. In the present study, analyzing the data from our prostate cancer tissue microarray, we found that PD-L1 expression was positively correlated with the expression of heterogeneous nuclear ribonucleoprotein L (HnRNP L). Hence, we further investigated the potential role of HnRNP L on the PD-L1 expression, the sensitivity of cancer cells to T-cell killing and the synergistic effect with anti-PD-1 therapy in CRPC. Indeed, HnRNP L knockdown effectively decreased PD-L1 expression and recovered the sensitivity of cancer cells to T-cell killing in vitro and in vivo, on the contrary, HnRNP L overexpression led to the opposite effect in CRPC cells. In addition, consistent with the previous study, we revealed that ferroptosis played a critical role in T-cell-induced cancer cell death, and HnRNP L promoted the cancer immune escape partly through targeting YY1/PD-L1 axis and inhibiting ferroptosis in CRPC cells. Furthermore, HnRNP L knockdown enhanced antitumor immunity by recruiting infiltrating CD8+ T cells and synergized with anti-PD-1 therapy in CRPC tumors. This study provided biological evidence that HnRNP L knockdown might be a novel therapeutic agent in PD-L1/PD-1 blockade strategy that enhanced anti-tumor immune response in CRPC.

Keywords: ADT, androgen deprivation therapy; Anti-PD-1 therapy; CRPC, castration-resistant prostate cancer; Castration-resistant prostate cancer; DMSO, dimethyl sulfoxide; ELISA, enzyme-linked immunosorbent assay; FBS, fetal bovine serum; Fer-1, ferrostatin-1; Ferroptosis; GSH, glutathione; HnRNP L; HnRNP L, heterogeneous nuclear ribonucleoprotein L; IL, interleukin; INF-γ, interferon gamma; Immune checkpoint blockade; Immune escape; PD-1, programmed cell death protein 1; PD-L1; PD-L1, programmed death ligand1; ROS, reactive oxygen species; STAT, signal transducer and activator of transcription; YY1; qRT-PCR, quantitative reverse transcription polymerase chain reaction.


Figures

Image 1
Graphical abstract
Figure 1
Figure 1
HnRNP L and PD-L1 are co-expressed in PCa cells and PCa tumors. (A) The expression of HNRNPL in normal prostate tissues and prostate cancer tissues based on the data in TCGA database. (B) Expression of HnRNP L in a tissue microarray containing several prostate cancer and non-prostate cancer tissues (n = 24). Representative images of HnRNP L in Normal and Pca specimens examined by IHC. Four representative immunohistochemical staining images of HnRNP L in normal tissue (Normal) and tumor tissue samples (Tumor 1, Tumor 2 and Tumor 3) examined by IHC are shown as indicated. (C) Western blotting bands for HnRNP L and PD-L1 expression in each of the paired Pca tissue samples (T) and adjacent normal tissue samples (N) obtained from the same patients. The mRNA and protein expressions of HnRNP L and PD-L1 in the normal prostate epithelial cell line (RWPE-1) and four PCa cell lines were detected by qRT-PCR (D) and Western blotting (GAPDH was used as loading control) (E). (F) Representative images of IHC of anti-HnRNP L and anti-PD-L1 antibodies of PCa (n = 61) tissue sections. (G) Pie chart showing the staining index of HnRNP L and PD-L1 in PCa. (H) Correlation analysis of the staining index for expression of HnRNP L and PD-L1 in specimens of PCa patients (n = 61). (I) The co-expression data of HNRNPL and CD274 in prostate cancer through the TCGA database indicated their interconnections. Each bar represents the mean ± SD of three independent experiments. ∗P < 0.05; ∗∗P < 0.01; ∗∗∗P < 0.001.
Figure 2
Figure 2
HnRNP L promotes the expression and secretion of PD-L1 in CRPC cells. The qRT-PCR analysis (A and B) and Western blotting analysis (C and D) of the expression of HnRNP L and CD274 (PD-L1) after HnRNP L inhibition or overexpression. Red arrow indicates the main bands for analysis. (E and F) PD-L1 in cell culture medium from the transfected CRPC cells (PC3 and DU145) was measured by enzyme-linked immunosorbent assay (ELISA). The immunofluorescence analysis of the expression of HnRNP L and CD274 (PD-L1) after HnRNP L inhibition or overexpression in PC3 (G) and DU145 (H) cells. Each bar represents the mean ± SD of three independent experiments. ∗P < 0.05; ∗∗P < 0.01; ∗∗∗P < 0.001.
Figure 3
Figure 3
HnRNP L inhibits the killing activity of Jurkat T cells to CRPC cells. (A) Schematic diagram of the process of co-culture of PCa cells and Jurkat T cells. The qRT-PCR analysis (B) and ELISA analysis (C) of the expression and secretion of IL-2 from Jurkat T cells after activating by anti-CD3 plus anti-CD28 co-stimulation for 0, 6, 12, 24 and 48 h. Representative images of annexin-V/propidium iodide staining showing increased apoptosis in CRPC cells treated with si-HnRNP L and decreased apoptosis in CRPC cells treated with HnRNP L overexpression after co-culture with the activated Jurkat T cells, while the opposite effect in co-cultured Jurkat T cells (D). Statistical results are represented as mean ± SD of three independent experiments (E and F). HnRNP L inhibits the directly contacted Jurkat T cells induced-cell death of PC3 and DU145 cells (pre-stained by CFDA-SE), which were analyzed by flow cytometric (G and H) and fluorescence microscope (I) using CFDA-SE/PI staining. The data were analyzed by One-way ANOVA and post-hoc assays. (J) Jurkat T cells were activated by anti-CD3 plus anti-CD28 and co-cultured with the transfected CRPC cells (PC3 and DU145) in 12-well plates for 2 days and the surviving tumor cells were visualized by crystal violet staining. (K) Relative fold ratios of surviving cell intensity are shown (n = 3). The data are presented as mean ± SD. ∗P < 0.05; ∗∗P < 0.01; ∗∗∗P < 0.001.
Figure 4
Figure 4
HnRNP L inhibits the killing activity of Jurkat T cells to CRPC cells. (A) IFN-γ in cell culture medium from the activated Jurkat T cells after co-cultured with the transfected CRPC cells was measured by enzyme-linked immunosorbent assay (ELISA). (B) Western blotting analysis of the expression of p-STAT1 and STAT1 after co-culture with the activated Jurkat T cells in transfected CRPC cells. GAPDH was used as a loading control. Red arrow indicates the main bands for analysis. (C) and (D) Western blotting analysis of the expression of HnRNP L and the ferroptosis-related protein, SLC7A11 and GPX4 after co-culture with the activated Jurkat T cells in transfected CRPC cells (si-HnRNP L or HnRNP L overexpression). GAPDH was used as a loading control. Red arrow indicates the main bands for analysis. (E) and (F) The changes of lipid ROS accumulation in transfected PC3 and DU145 cells after co-culture with the activated Jurkat T cells were measured by fluorescence microscope. (G) and (H) The transfected PC3 and DU145 cells were co-cultured with the activated Jurkat T cells for 48 h, and the amount of glutamate released into culture medium was measured. Indicated cells co-cultured with the activated Jurkat T cells for 48 h were lysed, and the intracellular GSH level was measured. The data are presented as mean ± SD (n = 3). The data were analyzed by one-way ANOVA and post-hoc assays and student’ s t-test. ∗P < 0.05; ∗∗P < 0.01; ∗∗∗P < 0.001, vs. NC or Vector control.
Figure 5
Figure 5
HnRNP L promotes tumor growth through immune escape in PCa tumors. (A) The transfection efficiency of lentivirus vectors labeled with GFP. The ectopic expression of HnRNP L in RM-1 cells was analyzed using (B) qRT-PCR and (C) Western blotting. GAPDH was used as a loading control. Each bar represents the mean ± SD of three independent experiments. (D)–(F) 2 × 106 RM-1 cells (four groups: HnRNP L knockdown, NC, HnRNP L overexpression and Vector) were implanted subcutaneously into the right armpit regions and right inguinal regions of each C57BL/6 mouse. Tumor volumes were measured on the indicated days and drew into the tumor growth curves. (G)–(I) 2 × 106 RM-1 cells (four groups: HnRNP L knockdown, NC, HnRNP L overexpression and Vector) were implanted subcutaneously into the right armpit regions and right inguinal regions of each BALB/c nude mouse. Tumor size data (means ± SD, n = 6) were log-transformed before statistical analyses using generalized linear model. (J)–(O) Representative immunohistochemistry staining images of HnRNP L, PD-L1, CD4, CD8, SLC7A11, and GPX4 from tumor tissues (C57BL/6 mice) in each group. (P) Mean positive rates ± SD were shown (n = 6). ∗P < 0.05; ∗∗P < 0.01; ∗∗∗P < 0.001 (vs. NC or Vector Control). (Q) Representative immunohistochemistry staining images of CD4 and CD8 from spleen tissues (C57BL/6 mice) in each group.
Figure 6
Figure 6
HnRNP L regulates the expression of PD-L1 by stabilizing YY1 in CRPC cells. (A) Correlation analysis of gene expression between HNRNPL and YY1 in specimens of PCa through TCGA database. (B) The interaction probabilities of HnRNP L and YY1 were predicted by RPISeq (RNA-Protein Interaction Prediction). (C) Schematic diagram of operation steps of RNA-immunoprecipitation (RIP) assay. (D) and (E) Adequate CRPC cell (PC3 and DU145) extracts were incubated with a monoclonal antibody for HnRNP L or IgG overnight at 4 °C before the purification of RNA and then Western blotting was performed to identify the efficiency of co-immunoprecipitation. IgG, the fifth and sixth eluent were served as negative control. YY1 mRNA identified as the co-purified mRNA with HnRNP L was proven by immunoprecipitation followed by qRT-PCR. (F) and (G) The qRT-PCR analysis of the expression of HnRNP L and YY1 after HnRNP L inhibition or overexpression in CRPC cells (PC3 and DU145). (H) and (I) The qRT-PCR analysis of the expression of YY1 in 0, 2, 5, and 10 h after treating with actinomycin D in transfected CRPC cells (PC3 and DU145). (J) Schematic diagram of YY1 binding location and sequence on human CD274 (PD-L1) gene. Identified YY1 binding sequence was compared with consensus sequence (CCAT sequence is essential for YY1 binding). TSS, transcription start site. (K) ChIP assay was carried out in PC3 and DU145 cells. Input served as a positive control for ChIP. IgG was used as a negative control for ChIP. The fold enrichment values of qRT-PCR were normalized to the positive control Input. ∗P < 0.05; ∗∗P < 0.01; ∗∗∗P < 0.001.
Figure 7
Figure 7
HnRNP L inhibits Jurkat T cells-mediated ferroptosis of CRPC cells via the YY1/PD-L1 axis. (A) The qRT-PCR analysis of the expression of HnRNP L and YY1 in stable CRPC cells (PC3 and DU145) with or without HnRNP L inhibition and YY1 overexpression. (B) PD-L1 in cell culture medium from the stable CRPC cells (PC3 and DU145) with or without HnRNP L inhibition and YY1 overexpression was measured by enzyme-linked immunosorbent assay (ELISA). (C) IFN-γ in cell culture medium from the activated Jurkat T cells after co-cultured with the stable CRPC cells (PC3 and DU145) with or without HnRNP L inhibition and YY1 overexpression was measured by enzyme-linked immunosorbent assay (ELISA). (D) and (E) Western blotting analysis of the expression of HnRNP L, YY1, pSTAT1, SLC7A11 and GPX4 after co-culture with the activated Jurkat T cells in transfected CRPC cells (si-HnRNP L or/and YY1 overexpression). GAPDH was used as a loading control. Red arrow indicates the main bands for analysis. (F) and (G) Representative images of annexin-V/propidium iodide staining showing increased apoptosis in CRPC cells treated with si-HnRNP L and decreased apoptosis in CRPC cells treated with both si-HnRNP L and YY1 overexpression after co-culture with the activated Jurkat T cells (F). Statistical results were represented as mean ± SD of three independent experiments (G). (H) and (I) The changes of lipid ROS accumulation in transfected PC3 and DU145 (si-HnRNP L or/and YY1 overexpression or/and ferrostatin-1) cells after co-culture with the activated Jurkat T cells were measured by fluorescence microscope. (J) and (K) The stable CRPC cells (PC3 and DU145) with or without HnRNP L inhibition and YY1 overexpression or ferrostatin-1 were co-cultured with the activated Jurkat T cells for 48 h, and the amount of glutamate released into culture medium was measured. Indicated cells co-cultured with the activated Jurkat T cells for 48 h were lysed, and the intracellular GSH level was measured. The data are presented as mean ± SD (n = 3). The data were analyzed by one-way ANOVA and post-hoc assays and student’ s t-test. ∗P < 0.05; ∗∗P < 0.01; ∗∗∗P < 0.001, vs. NC control.
Figure 8
Figure 8
Inhibition of HnRNP L enhances anti-PD1 therapy efficacy by recruiting CD8+ T cells in PCa tumors. Tumor image (A), tumor weight (B) and tumor volume (C) from control and HnRNP L-knockdown RM-1 tumour cells in C57BL/6 mice with or without anti-PD-1 treating (n = 5 mice per group). (D) and (E) Representative immunohistochemistry staining images of HnRNP L and CD8 from tumor tissues (C57BL/6 mice) in each group. (F) Mean positive rates ± SD are shown (n = 5); ∗P < 0.05; ∗∗P < 0.01; ∗∗∗P < 0.001. (G) IFN-γ in the mice tumors from these three groups was measured (n = 5). The collected tumors were homogenized and detected by using Quantikine ELISA (R&D Systems). (H) The body weight of each mouse was monitored during the experiment. N.S: P>0.05. (I) A consolidated model that illustrates a plausible sequence for the mechanism by which inhibition of HnRNP L downregulates PD-L1 and sensitizes castration-resistant prostate cancer cells to T cells killing.

References

    1. Siegel R.L., Miller K.D., Jemal A. Cancer statistics, 2020. CA Cancer J Clin. 2020;70:7–30. - PubMed
    1. Liu J.M., Yu C.P., Chuang H.C., Wu C.T., Hsu R.J. Androgen deprivation therapy for prostate cancer and the risk of autoimmune diseases. Prostate Cancer Prostatic Dis. 2019;22:475–482. - PubMed
    1. Teo M.Y., Rathkopf D.E., Kantoff P. Treatment of advanced prostate cancer. Annu Rev Med. 2019;70:479–499. - PMC - PubMed
    1. Watson P.A., Arora V.K., Sawyers C.L. Emerging mechanisms of resistance to androgen receptor inhibitors in prostate cancer. Nat Rev Cancer. 2015;15:701–711. - PMC - PubMed
    1. Chen D.S., Mellman I. Elements of cancer immunity and the cancer-immune set point. Nature. 2017;541:321–330. - PubMed