. 2022 Feb;12(2):801-820.
doi: 10.1016/j.apsb.2021.07.022. Epub 2021 Jul 29.

Understanding the physiological functions of the host xenobiotic-sensing nuclear receptors PXR and CAR on the gut microbiome using genetically modified mice

Affiliations

Understanding the physiological functions of the host xenobiotic-sensing nuclear receptors PXR and CAR on the gut microbiome using genetically modified mice

Mallory Little et al. Acta Pharm Sin B. 2022 Feb.

Abstract

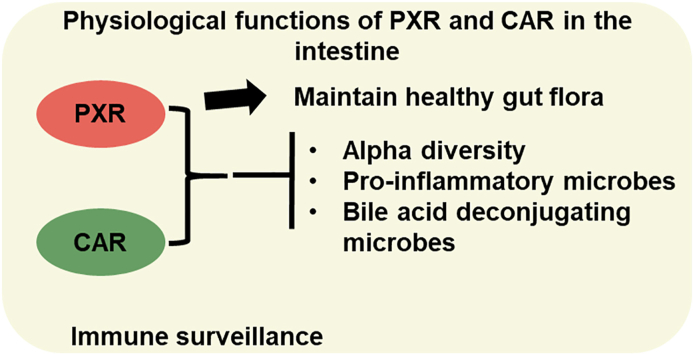
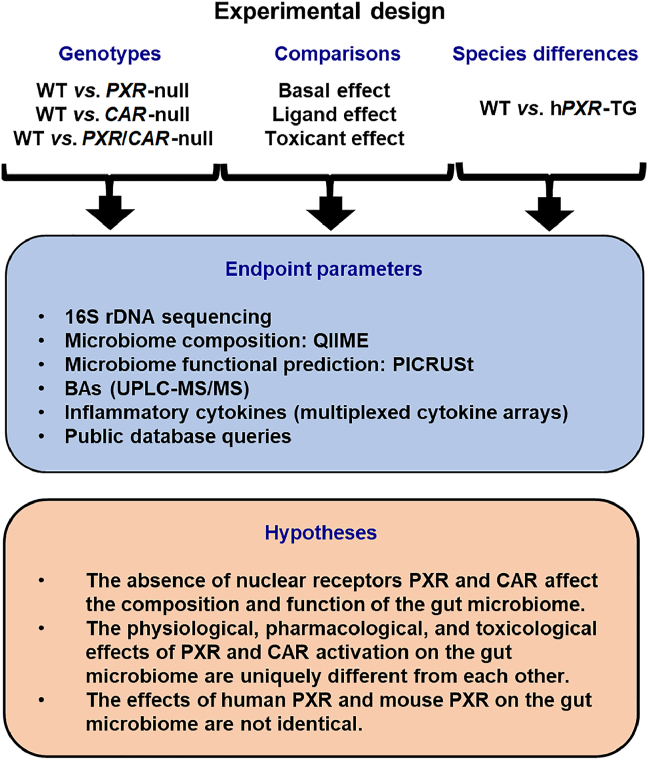
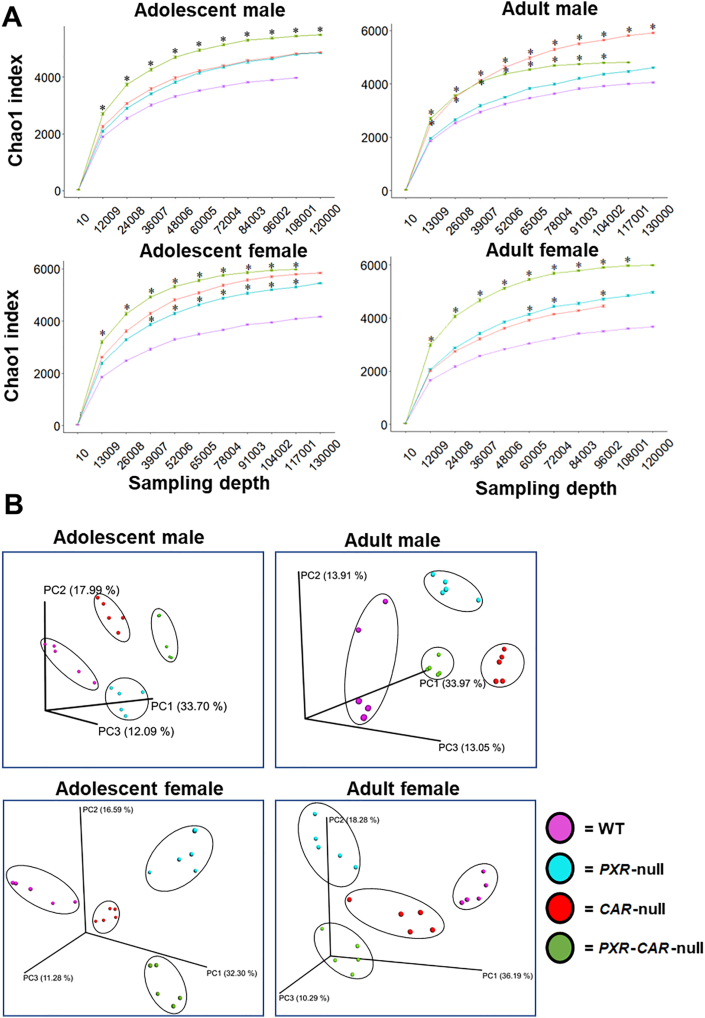
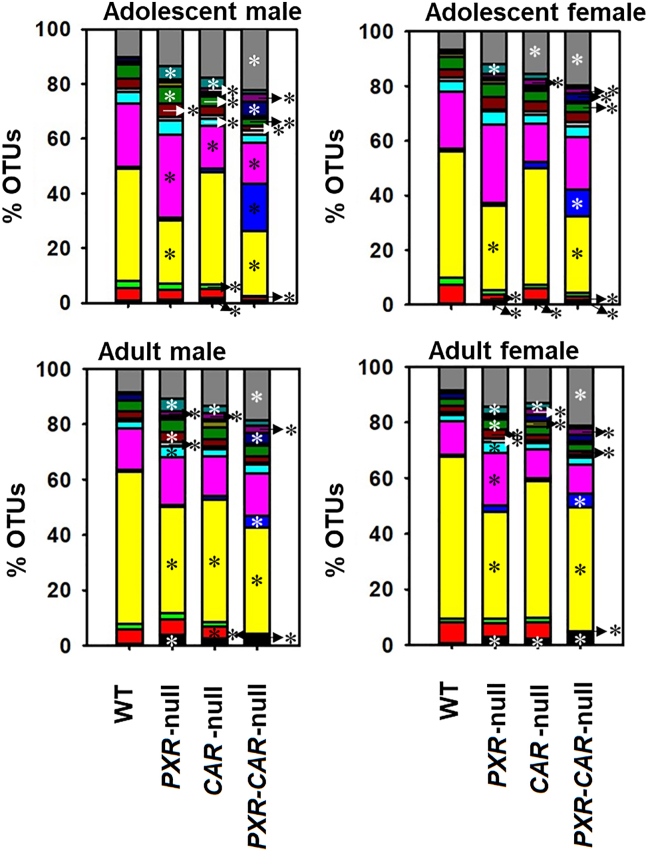
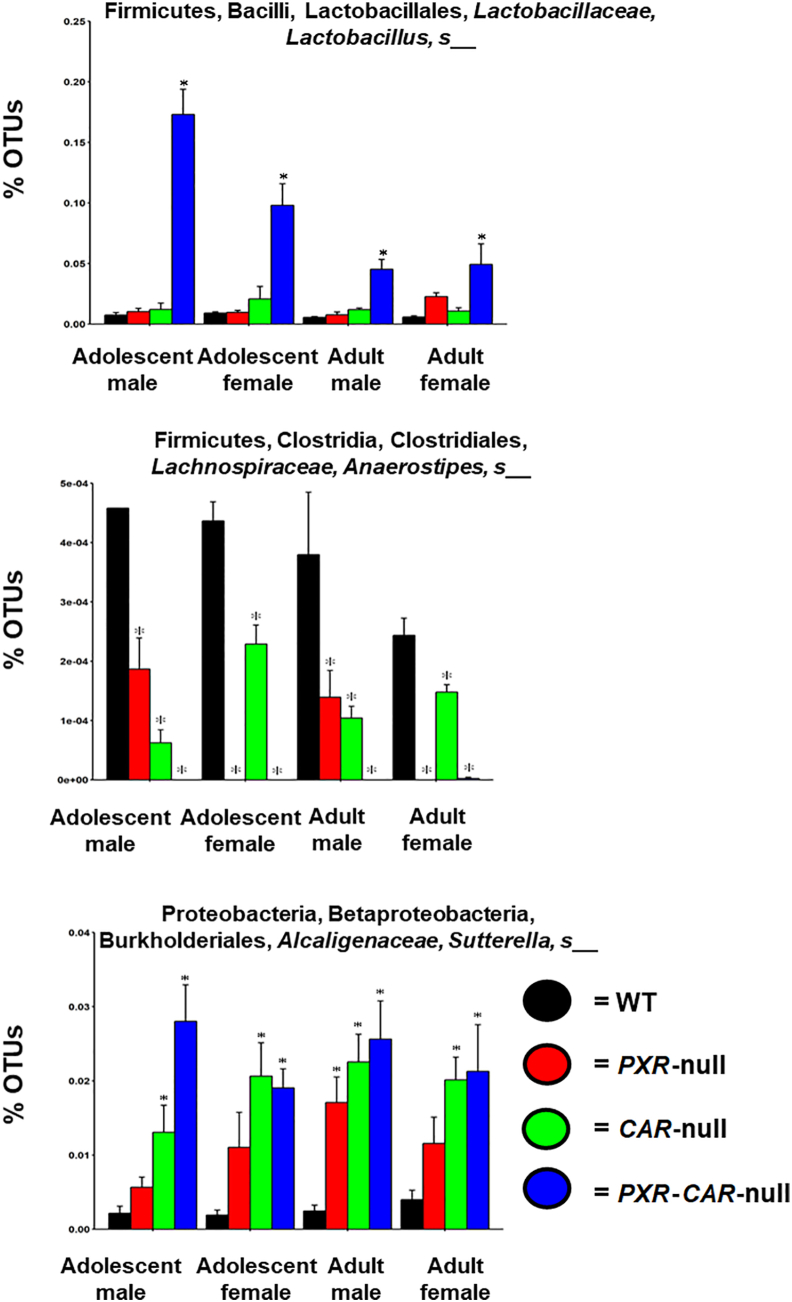
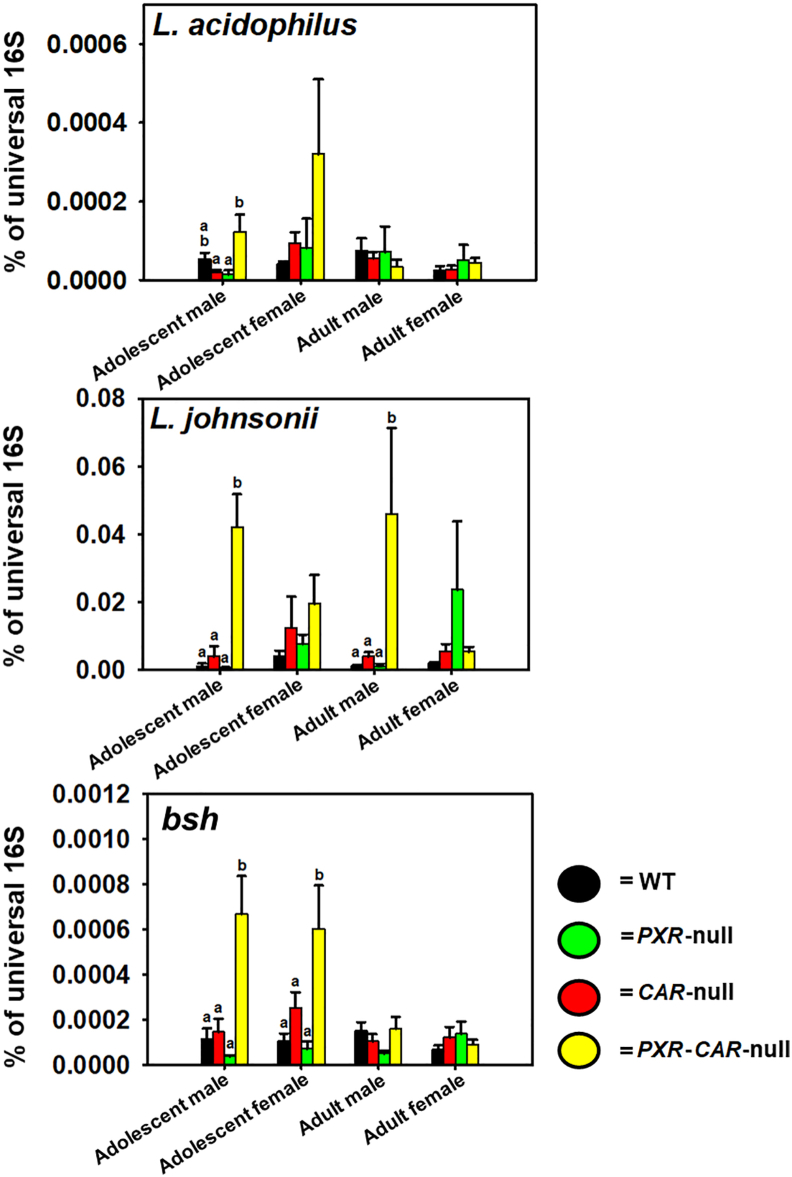
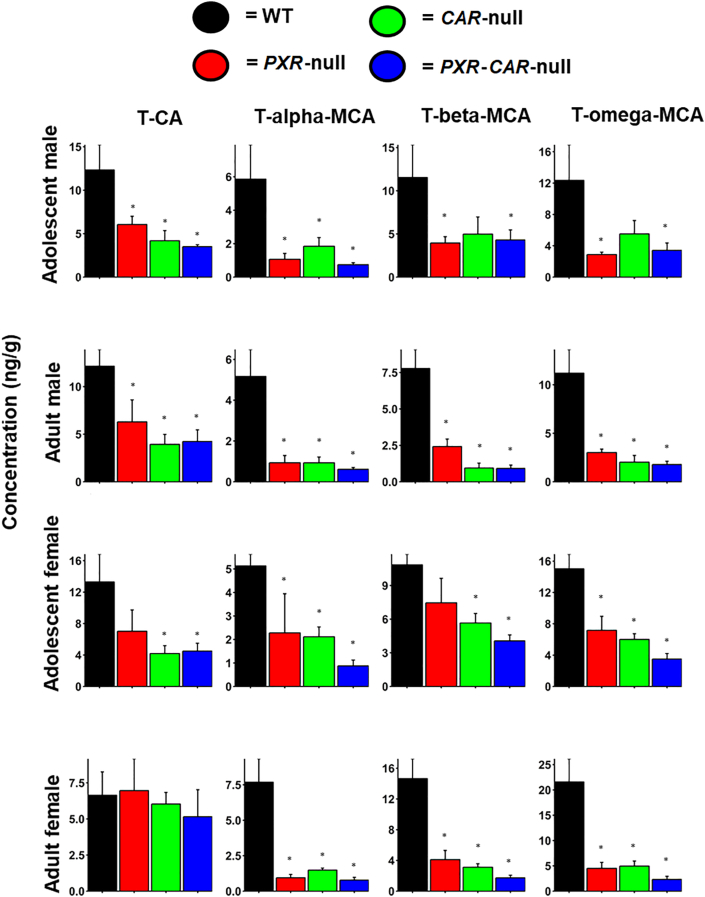
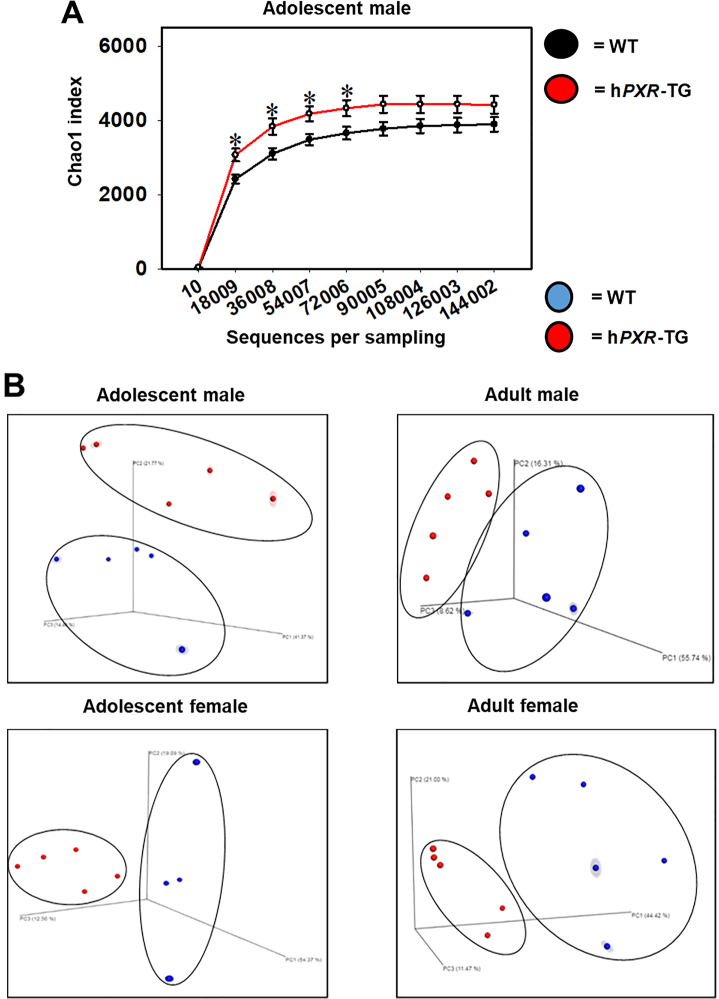
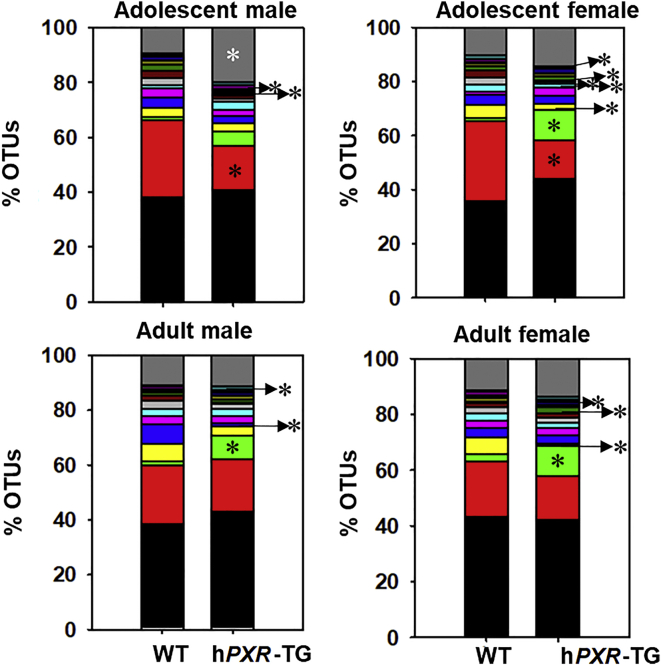
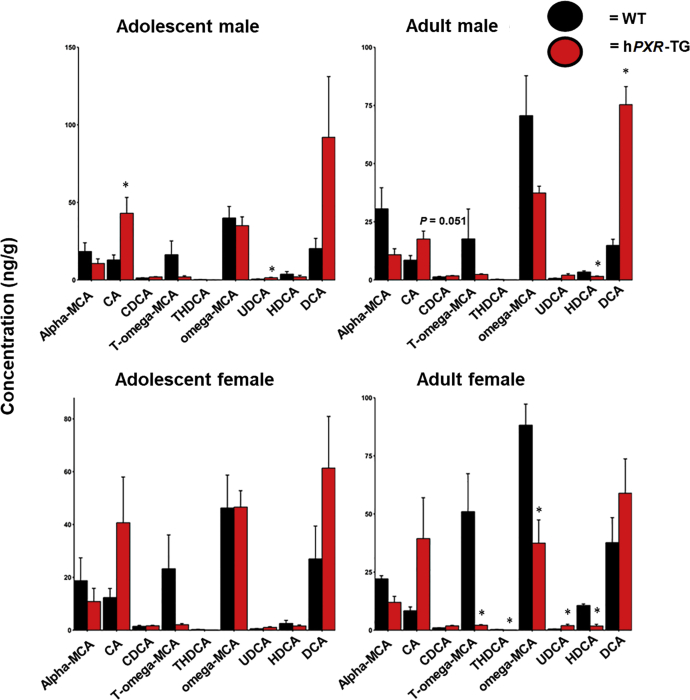
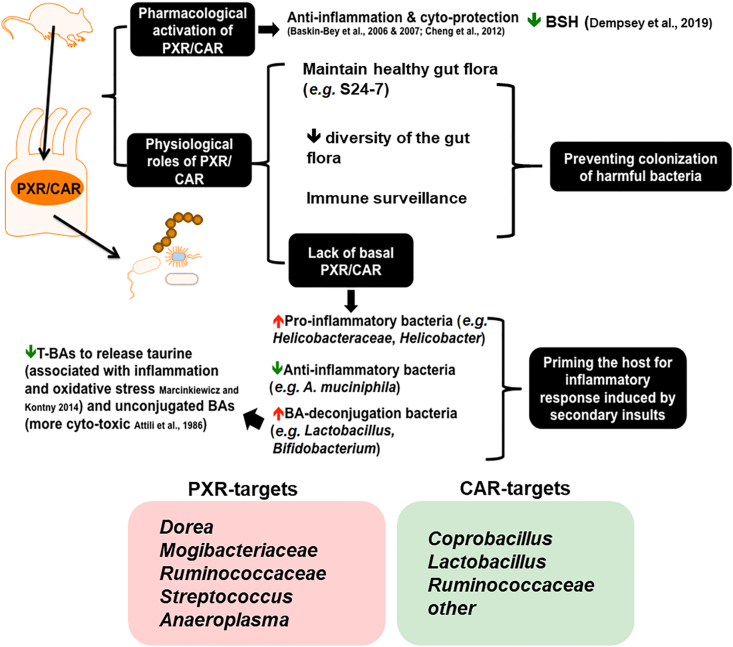
Pharmacological activation of the xenobiotic-sensing nuclear receptors pregnane X receptor (PXR) and constitutive androstane receptor (CAR) is well-known to increase drug metabolism and reduce inflammation. Little is known regarding their physiological functions on the gut microbiome. In this study, we discovered bivalent hormetic functions of PXR/CAR modulating the richness of the gut microbiome using genetically engineered mice. The absence of PXR or CAR increased microbial richness, and absence of both receptors synergistically increased microbial richness. PXR and CAR deficiency increased the pro-inflammatory bacteria Helicobacteraceae and Helicobacter. Deficiency in both PXR and CAR increased the relative abundance of Lactobacillus, which has bile salt hydrolase activity, corresponding to decreased primary taurine-conjugated bile acids (BAs) in feces, which may lead to higher internal burden of taurine and unconjugated BAs, both of which are linked to inflammation, oxidative stress, and cytotoxicity. The basal effect of PXR/CAR on the gut microbiome was distinct from pharmacological and toxicological activation of these receptors. Common PXR/CAR-targeted bacteria were identified, the majority of which were suppressed by these receptors. hPXR-TG mice had a distinct microbial profile as compared to wild-type mice. This study is the first to unveil the basal functions of PXR and CAR on the gut microbiome.

Keywords: BA, bile acid; BSH, bile salt hydrolase; Bile acids; CA, cholic acid; CAR; CAR, constitutive androstane receptor; CDCA, chenodeoxycholic acid; CITCO, 6-(4-chlorophenyl)imidazo[2,1-b][1,3]thiazole-5-carbaldehyde O-(3,4-dichlorobenzyl)oxime; CV, conventional; CYP, cytochrome P450; DCA, deoxycholic acid; EGF, epidermal growth factor; Feces; GF, germ free; GLP-1, glucagon-like peptide-1; GM-CSF, granulocyte-macrophage colony-stimulating factor; Gut microbiome; HDCA, hyodeoxycholic acid; IBD, inflammatory bowel disease; IFNγ, interferon-gamma; IL, interleukin; IS, internal standards; Inflammation; LCA, lithocholic acid; LC–MS/MS, liquid chromatography–tandem mass spectrometry; MCA, muricholic acid; MCP-1, monocyte chemoattractant protein-1; Mice; NF-κB, nuclear factor kappa-light-chain-enhancer of activated B cells; NSAID, non-steroidal anti-inflammatory drug; Nuclear receptor; OH, hydroxylated; OTUs, operational taxonomy units; PA, indole-3 propionic acid; PBDEs, polybrominated diphenyl ethers; PCBs, polychlorinated biphenyls; PCoA, Principle Coordinate Analysis; PXR; PXR, pregnane X receptor; PiCRUSt, Phylogenetic Investigation of Communities by Reconstruction of Observed States; QIIME, Quantitative Insights Into Microbial Ecology; SCFAs, short-chain fatty acids; SNP, single-nucleotide polymorphism; SPF, specific-pathogen-free; T, wild type; T-, taurine conjugated; TCPOBOP, 1,4-bis-[2-(3,5-dichloropyridyloxy)]benzene, 3,3′,5,5′-Tetrachloro-1,4-bis(pyridyloxy)benzene; TGR-5, Takeda G-protein-coupled receptor 5; TLR4, toll-like receptor 4; TNF, tumor necrosis factor; UDCA, ursodeoxycholic acid; YAP, yes-associated protein; hPXR-TG, humanized PXR transgenic.


Figures

Image 1
Graphical abstract
Figure 1
Figure 1
Schematic of the experimental design of this study. [Study 1] To determine the necessity of the host PXR and CAR genes on modulating the compositions and functions of the gut microbiome under physiological conditions, fecal samples were collected from WT, PXR-null, CAR-null, and PXR-CAR-null (all in C57BL/6 background) male and female mice of adolescent and adult ages (n = 5 of each group). [Study 2] To compare the physiological roles of PXR and CAR with ligand-mediated activation and toxicant-mediated activation of these nuclear receptors, data from the present study were compared with publicly inquired databases of the same genetic background (C57BL/6), sexes, and age. For ligand effect, 16S rDNA sequencing data were retrieved from mice that were orally exposed to the prototypical PXR ligand PCN or the prototypical CAR ligand TCPOBOP. For toxicant effect, 16S rDNA sequencing data were retrieved from mice that were orally exposed to PBDEs,, or PCBs, [Study 3] To compare the role of mouse and human PXR genes on the composition and function of the gut microbiome, fecal samples were collected from WT and hPXR-TG (both in FVB background) male and female mice of adolescent and adult ages (n = 5 of each group). Due to poor breeding capacity of hCAR-TG mice in C57BL/6 background and the lack of access of hCAR-TG mice in the FVB background, the comparison of mouse and human CAR genes on gut microbiome was not determined in this study. Fecal samples were collected after 24 h, and 16S rDNA gene sequencing was conducted by amplifying the hypervariable V4 region. Analysis of FASTQ files was conducted using various python scripts in Quantitative Insights Into Microbial Ecology (QIIME), including de-multiplexing, quality filtering, operational taxonomy unit (OTU) picking, as well as alpha- and beta-diversity determinations. Metagenome functional content was predicted using Phylogenetic Investigation of Communities by Reconstruction of Observed States (PICRUSt). BAs were quantified using liquid chromatography–tandem mass spectrometry (LC–MS/MS). Cytokines were quantified using the Mouse Cytokine Array Pro-inflammatory Focused 10-Plex (MDF10; Eve Technologies Corp., Calgary, Alberta, Canada). For Study 1, we hypothesize that the absence of PXR and CAR affect the composition and function of the gut microbiome. For Study 2, we hypothesize that the physiological, pharmacological, and toxicological effects of PXR and CAR activation on gut microbiome are uniquely different from each other. For Study 3, we hypothesize that the effects of human PXR and mouse PXR on the gut microbiome are not identical.
Figure 2
Figure 2
Alpha and beta diversities of WT, PXR-null, CAR-null, and PXR-CAR-null mice. (A) Mean (SE) alpha diversity of gut microbiota within WT, PXR-null, CAR-null, and PXR-CAR-null mice. Line plots are generated using the R package ggplot. Asterisks (∗) represent statistically significant differences compared to WT mice (one-way ANOVA followed by Duncan's post hoc test, P < 0.05). (B) Principal components analysis (PCA) plots showing the beta diversities of adolescent male, adult male, adolescent female, and adult female WT, PXR-null, CAR-null, and PXR-CAR-null mice.
Figure 3
Figure 3
Percentage OTUs (L7) of the fecal microbiome among WT, PXR-null, CAR-null, and PXR-CAR-null mice. Stacked bar charts illustrate the mean percentages of differentially regulated taxa in fecal samples in WT, PXR-null, CAR-null, and PXR-CAR-null male and female, adolescent and adult mice. The top 14 differentially abundant taxa in each group were plotted and all other detected taxa were summed together to form the category labeled as “Other”. Asterisks (∗) represent statistically significant differences compared to WT mice (one-way ANOVA followed by Duncan's post hoc test, P < 0.05).
Figure 4
Figure 4
Percentage OTUs of Lactobacillus sp., Anaerostipes sp., and Sutterella sp. Individual bar plots of mean (SE) percentage OTUs of Lactobacillus sp., Anaerostipes sp., and Sutterella sp., are generated by the R package ggplot2. Asterisks (∗) represent statistically significant differences compared to WT mice (one-way ANOVA followed by Duncan's post hoc test, P < 0.05).
Figure 5
Figure 5
qPCR analysis of the BSH-expressing L. acidophilus and L. johnsonii as well as the DNA encoding BSH. The primer sequences were described as we reported before, and in Table S2. All primers were synthesized by Integrated DNA Technologies. The abundance of the genomic DNA encoding the bacterial 16S rRNAs in the intestinal content of mice was determined by quantitative polymerase chain reaction (qPCR) using a CFX384 Real-Time PCR Detection System. Results are expressed as the mean (SE) delta–delta cycle value (calculated as 2ˆ[−(Cq − average reference Cq)]) of the quantitative PCR as compared with the universal bacteria, per nanogram of DNA from the intestinal content. (a) and (b) represent statistically significant differences compared to post hoc groups. Treatment groups that are not statistically different are labeled with the same letter.
Figure 6
Figure 6
BA concentrations in WT, PXR-null, CAR-null, and PXR-CAR-null mice. Mean (SE) fecal BA concentrations (ng/g) were quantified by LC–MS/MS as described in Materials and methods. Asterisks (∗) represent statistically significant differences compared to WT mice (one-way ANOVA followed by Duncan's post hoc test, P < 0.05).
Figure 7
Figure 7
Alpha and beta diversities of WT and hPXR-TG mice. (A) Mean (SE) alpha diversity of gut microbiota within WT and hPXR-TG FVB/NJ adolescent male mice. Line plots were generated using SigmaPlot. Asterisks (∗) represent statistically significant differences compared to WT mice (t-test, P < 0.05). (B) Principal components analysis (PCA) plots showing the beta diversities of adolescent male, adult male, adolescent female, and adult female WT and hPXR-TG mice.
Figure 8
Figure 8
Percentage OTUs of WT and hPXR-TG mice. Stacked bar charts illustrate the mean percentages of differentially regulated taxa in fecal samples in WT and hPXR-TG male and female, adolescent and adult mice. The top 14 differentially abundant taxa in each group were plotted and all other detected taxa were summed together to form the Other category. Asterisks (∗) represent statistically significant differences compared to WT mice (t-test, P < 0.05).
Figure 9
Figure 9
BA concentrations in WT and hPXR-TG FVB/NJ mice. Bar plots of mean (SE) BA concentrations (ng/g) in WT and hPXR-TG mice as generated by the R package ggplot2. BAs were quantified by LC–MS/MS as described in Materials and methods. Asterisks (∗) represent statistically significant differences compared to WT mice (t-test, P < 0.05).
Figure 10
Figure 10
A schematic illustrating the key findings of the study. There is a bivalent hormetic relationship between PXR/CAR levels and microbial richness, and PXR/CAR interacts with the gut microbiome to modulate immune surveillance and BA metabolism of the host. Physiological, pharmacological, and toxicological activation of PXR and CAR produce distinct effects on the gut microbiome; most taxa are not commonly regulated; however, common receptor-targets have been identified, and context-specific duality of PXR and CAR is noted.

References

    1. Klaassen C.D., Cui J.Y. Review: mechanisms of how the intestinal microbiota alters the effects of drugs and bile acids. Drug Metab Dispos. 2015;43:1505–1521. - PMC - PubMed
    1. Ridlon J.M., Kang D.J., Hylemon P.B., Bajaj J.S. Bile acids and the gut microbiome. Curr Opin Gastroenterol. 2014;30:332–338. - PMC - PubMed
    1. Watanabe M., Houten S.M., Mataki C., Christoffolete M.A., Kim B.W., Sato H., et al. Bile acids induce energy expenditure by promoting intracellular thyroid hormone activation. Nature. 2006;439:484–489. - PubMed
    1. Li T., Apte U. Bile acid metabolism and signaling in cholestasis, inflammation, and cancer. Adv Pharmacol. 2015;74:263–302. - PMC - PubMed
    1. Allen K., Jaeschke H., Copple B.L. Bile acids induce inflammatory genes in hepatocytes: a novel mechanism of inflammation during obstructive cholestasis. Am J Pathol. 2011;178:175–186. - PMC - PubMed