

Air quality improvement and its relation to mobility during COVID-19 lockdown in Marmara Region, Turkey
- PMID: 35257238
- PMCID: PMC8900962
- DOI: 10.1007/s10661-022-09889-7
Air quality improvement and its relation to mobility during COVID-19 lockdown in Marmara Region, Turkey
Abstract
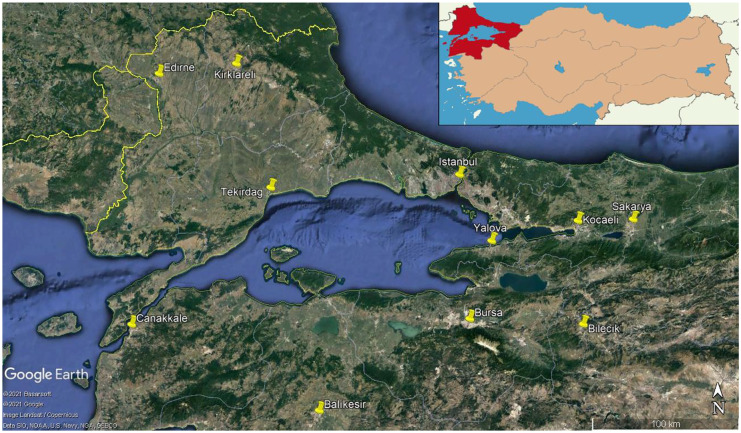
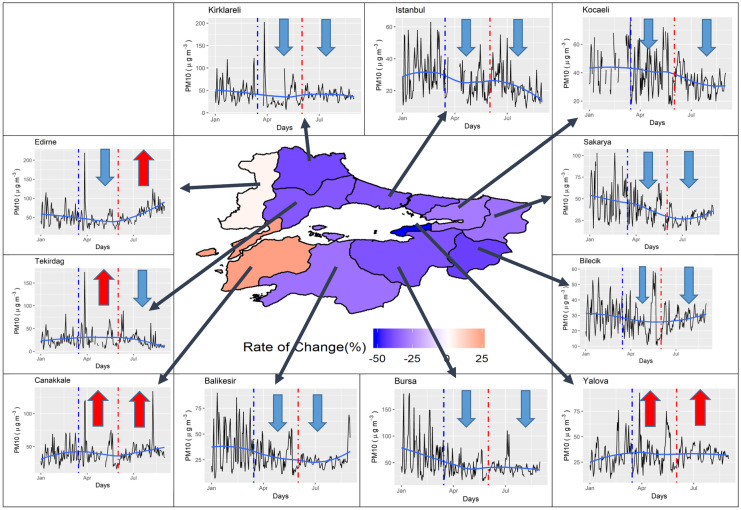
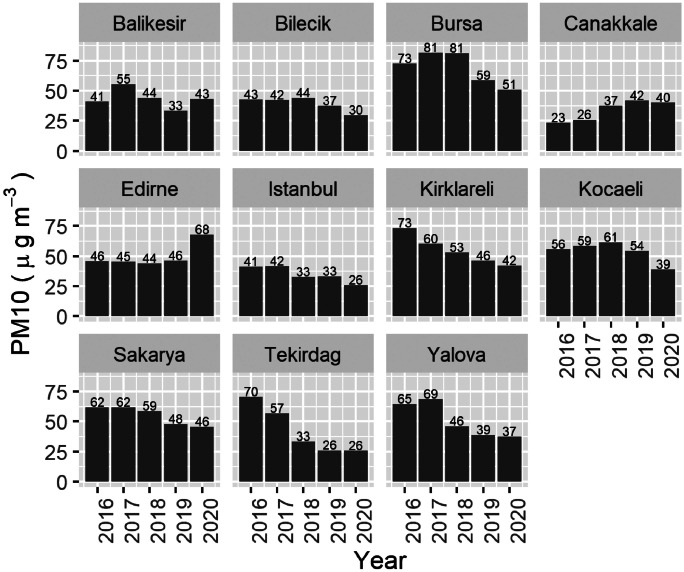
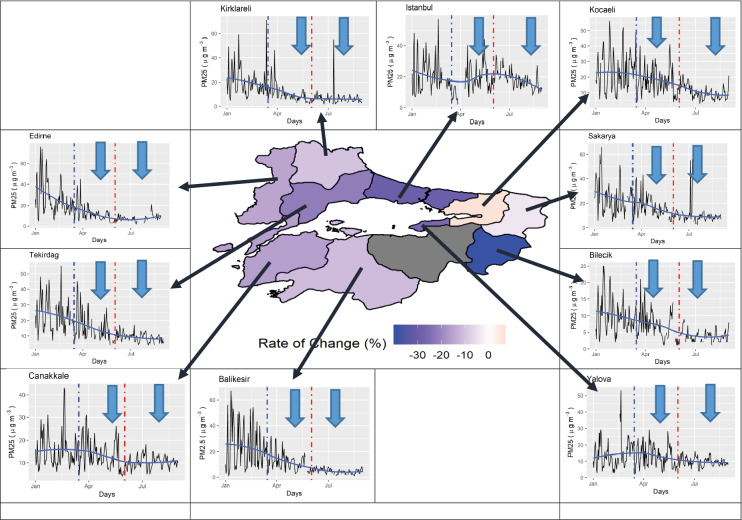
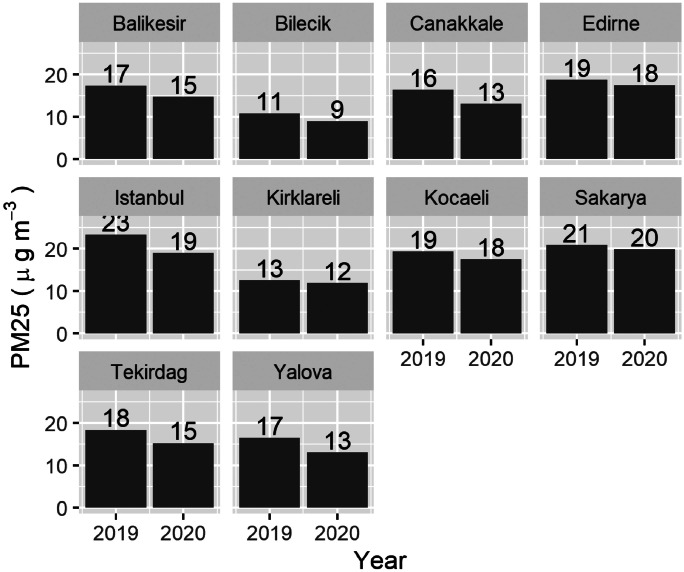
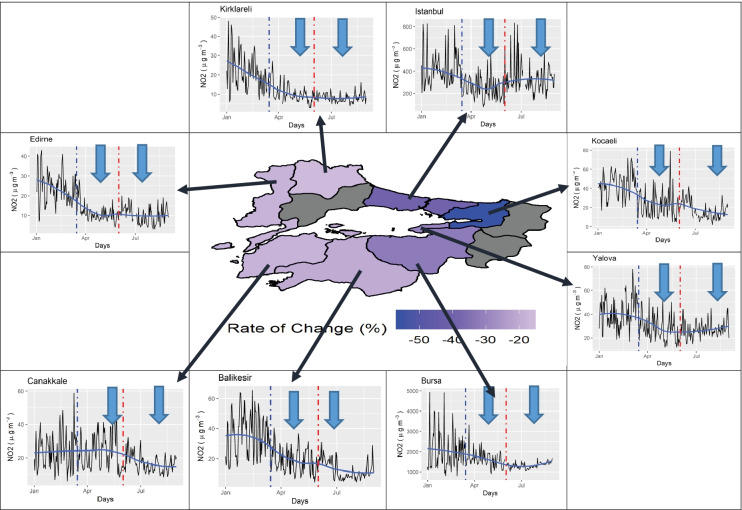
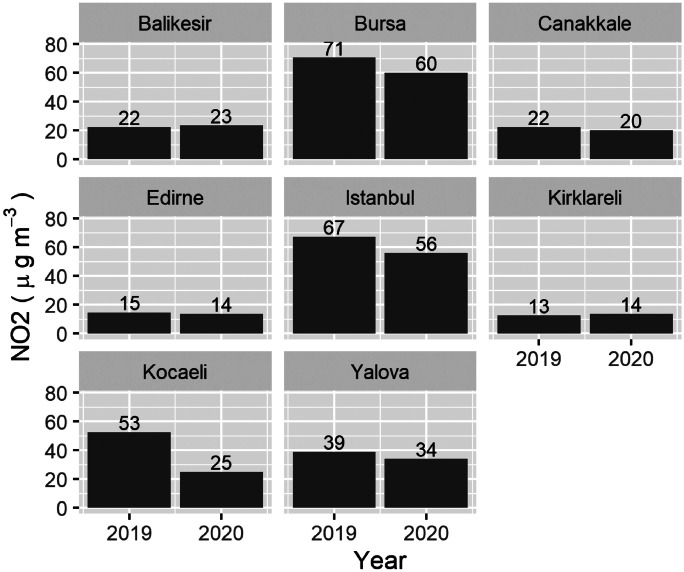
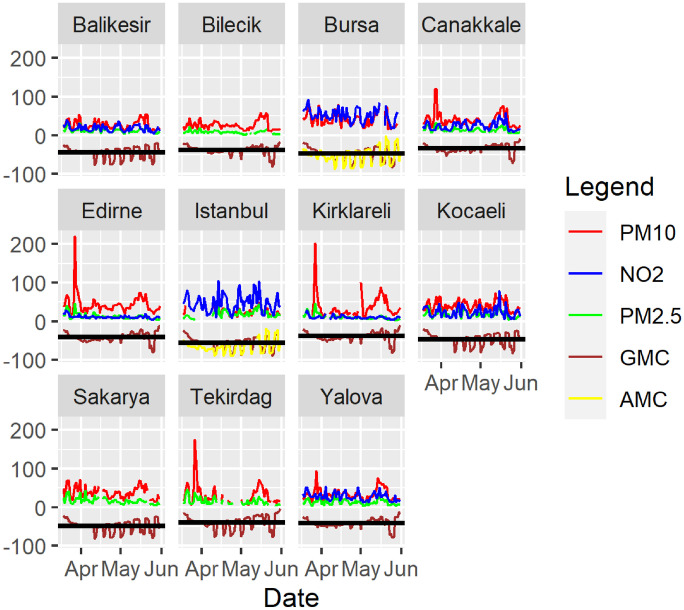
The outbreak of the novel coronavirus SARS-CoV-2 (hereafter COVID-19) has changed the daily routines of people around the world. When the first case was confirmed on 11 March 2020 in Turkey, the number of cases reached 4500 per day by 10 April in Turkey. Afterwards, the government declared more restrictive lockdown measures for 31 metropolitan cities starting 10 April, and it was implemented for the following weekends, national, and religious holidays. The change in concentrations of PM10, PM2.5, and NO2 during these measures with respect to the pre-lockdown period, the same period in the previous years and for different levels of measures for the cities in the Marmara Region of Turkey was investigated in this study. The daily mean concentrations of PM10, PM2.5, and NO2 obtained from 11 stations operated by the Ministry of Environment and Urbanization and Google mobility data are used in this study. Average PM2.5 and NO2 concentrations during the lockdown period declined with respect to the pre-lockdown period and the previous year for all stations. Average PM10 concentrations during the lockdown of 8 of 11 stations declined, while the rest of the stations increased with respect to the pre-lockdown period. In 9 of the 11 stations, the average concentration of PM10 decreased compared to the previous four years. In 7 of the 11 stations, the number of days exceeding WHO limit for PM10 was decreased during the lockdown period with respect to the pre-lockdown period. For PM2.5, the number of days exceeding WHO limit was decreased during the lockdown period compared to the pre-lockdown period for all the stations. For NO2, the number of days exceeding WHO limit was decreased during the lockdown period compared to the pre-lockdown period for 7 of the 8 stations. There is a significant relationship between mobility decrease and NO2 concentrations in large cities. The correlation coefficients are generally lower in small cities in the study region.
Keywords: Air pollution; COVID-19; Marmara Region; Turkey.
© 2022. The Author(s), under exclusive licence to Springer Nature Switzerland AG.
Conflict of interest statement
The author declares no competing interests.
Figures
References
-
- Agacayak, T., Kindap, T., Unal, A., Pozzoli, L., Mallet, M. & Solmon, F. (2015). A case study for Saharan dust transport over Turkey via RegCM4.1 model. Atmospheric Research, 153 (2015), 392–403. 10.1016/j.atmosres.2014.09.012
-
- Baltaci H. Spatial and temporal variation of the extreme Saharan Dust event over Turkey in March 2016. Atmosphere. 2017;8:41. doi: 10.3390/atmos8020041. - DOI
-
- Benesty, J., Chen. J, Huang, Y. & Cohen, I. (2009) Pearson correlation coefficient. In: Noise reduction in speech processing. Springer Topics in Signal Processing, vol 2. Springer, Berlin, Heidelberg. 10.1007/978-3-642-00296-0_5
MeSH terms
Substances
LinkOut - more resources
Full Text Sources
Medical
Miscellaneous
