. 2022 Jul;112(1):201-212.
doi: 10.1002/JLB.5COVA0721-392RR. Epub 2022 Mar 8.

Characterization of memory T cell subsets and common γ-chain cytokines in convalescent COVID-19 individuals

Affiliations

Characterization of memory T cell subsets and common γ-chain cytokines in convalescent COVID-19 individuals

Anuradha Rajamanickam et al. J Leukoc Biol. 2022 Jul.

Abstract

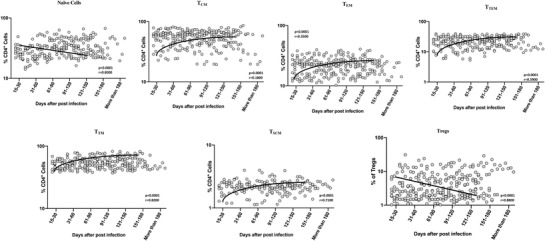
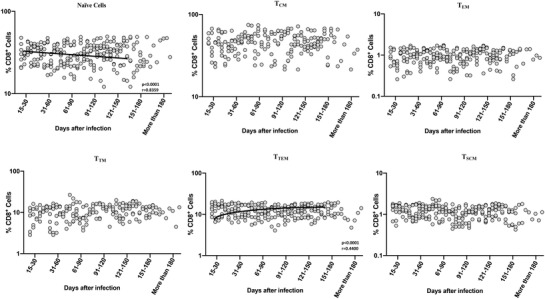
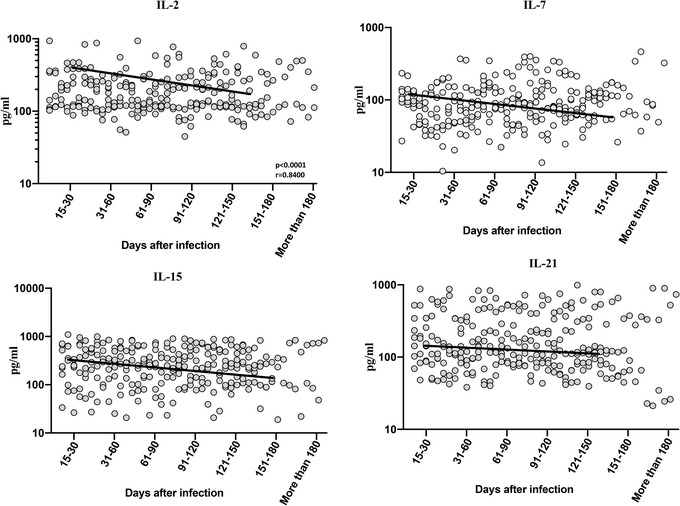
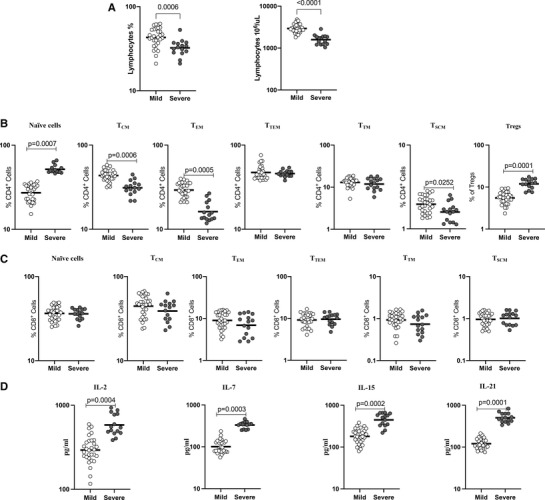
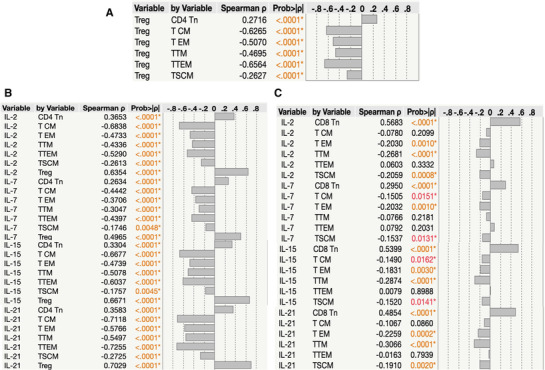
T cells are thought to be an important correlates of protection against SARS-CoV2 infection. However, the composition of T cell subsets in convalescent individuals of SARS-CoV2 infection has not been well studied. The authors determined the lymphocyte absolute counts, the frequency of memory T cell subsets, and the plasma levels of common γ-chain in 7 groups of COVID-19 individuals, based on days since RT-PCR confirmation of SARS-CoV-2 infection. The data show that both absolute counts and frequencies of lymphocytes as well as, the frequencies of CD4+ central and effector memory cells increased, and the frequencies of CD4+ naïve T cells, transitional memory, stem cell memory T cells, and regulatory cells decreased from Days 15-30 to Days 61-90 and plateaued thereafter. In addition, the frequencies of CD8+ central memory, effector, and terminal effector memory T cells increased, and the frequencies of CD8+ naïve cells, transitional memory, and stem cell memory T cells decreased from Days 15-30 to Days 61-90 and plateaued thereafter. The plasma levels of IL-2, IL-7, IL-15, and IL-21-common γc cytokines started decreasing from Days 15-30 till Days 151-180. Severe COVID-19 patients exhibit decreased levels of lymphocyte counts and frequencies, higher frequencies of naïve cells, regulatory T cells, lower frequencies of central memory, effector memory, and stem cell memory, and elevated plasma levels of IL-2, IL-7, IL-15, and IL-21. Finally, there was a significant correlation between memory T cell subsets and common γc cytokines. Thus, the study provides evidence of alterations in lymphocyte counts, memory T cell subset frequencies, and common γ-chain cytokines in convalescent COVID-19 individuals.

Keywords: CD4+ T cell subsets; CD8+ T cell subsets; COVID-19, acute and convalescent COVID-19; Memory T cell subsets.


Figures

FIGURE 1
FIGURE 1
Alterations in frequencies of circulating CD4+ memory T cell subsets in convalescent COVID‐19 individuals over a period of time. Analysis of memory T cell subsets (Naïve cells (TN), central memory cells (TCM), effector memory cells (TEM), Terminal effector memory cells (TTE), stem cell memory (TSCM), transitional memory cells (TTM) and Treg (regulatory T cells) from acute and convalescent COVID‐19 individuals, classified the groups based on days since RT‐PCR confirmation. The frequencies of CD4+ memory T cell subsets are shown with preferred model for best fit curve and each dot represents single individuals. Thick black line represents best fit curve.
FIGURE 2
FIGURE 2
Alterations in frequencies of circulating CD8+ naïve cells and terminal effector memory T cell subsets in convalescent COVID‐19 individuals over a period of time. Analysis of CD8+ memory T cell subsets (naïve cells [TN], central memory cells [TCM], effector memory cells [TEM], Terminal effector memory cells [TTE], stem cell memory [TSCM], transitional memory cells [TTM]) from acute and convalescent COVID‐19 individuals classified the groups based on days since RT‐PCR confirmation. The frequencies of memory T cell subsets are shown with preferred model for best fit curve and each dot represent single individuals. Thick black line represents best fit curve
FIGURE 3
FIGURE 3
Decreased levels of common γ−chain cytokines in convalescent COVID‐19 individuals over a period of time. (A) Circulating plasma levels of common γ−chain cytokines IL‐2, IL‐7, IL‐15, and IL‐21 from acute and convalescent COVID‐19 individuals classified the groups based on days since RT‐PCR confirmation. The levels of common γ−chain cytokines were shown with preferred model for best fit curve and each dot represent single individuals. Thick black line represents best fit curve
FIGURE 4
FIGURE 4
Severe COVID‐19 disease associated with altered frequencies CD4+ and CD8+ memory T cell subsets and decreased common γ−chain cytokines. (A) Lymphocyte absolute count and percentage were shown for mild (n = 30) and severe (n = 15) COVID‐19 individuals sampled between days 15 and 60 following RT‐PCR confirmation. The data are represented as scatter plots with each circle representing a single individual. (B) The frequencies of CD4+ T cell memory subsets in mild (n = 30) and severe (n = 15) COVID‐19 individuals sampled between days 15 and 60 following RT‐PCR confirmation. (C) The frequencies of CD8+ T cell memory subsets in mild (n = 30) and severe (n = 15) COVID‐19 individuals sampled between days 15 and 60 following RT‐PCR confirmation. (D) Circulating plasma levels of common γ−chain cytokines IL‐2, IL‐7, IL‐15, and IL‐21 in mild (n = 30) and severe (n = 15) COVID‐19 sampled between days 15 and 60 following RT‐PCR confirmation. The data are represented as scatter plots with each circle representing a single individual. p‐Values were calculated using the Mann– Whitney U‐test.
FIGURE 5
FIGURE 5
Association between Memory T cell subsets and common γc cytokines levels Multiparametric correlation plot of memory T cell subsets (naïve cells [TN], central memory cells [TCM], effector memory cells [TEM], terminal effector memory cells [TTE], stem cell memory [TSCM], transitional memory cells [TTM]), and common γc cytokines levels (IL‐2, IL‐7, IL‐15, and IL‐21) from all 7 groups of convalescent COVID‐19 individuals classified as groups based on days since RT‐PCR confirmation. Spearman's correlation coefficients are visualized. (A) Correlation analysis between regulatory T cells versus memory CD4+ T cell subsets. (B) Correlation analysis between absolute numbers of memory CD4+ T cell subsets Vs common γc cytokines levels (IL‐2, IL‐7, IL‐15, and IL‐21). (C) Correlation analysis between absolute numbers of memory CD8+ T cell subsets versus common γc cytokines levels (IL‐2, IL‐7, IL‐15, and IL‐21)

References

    1. Perlman S, Netland J. Coronaviruses post‐SARS: update on replication and pathogenesis. Nat Rev Microbiol. 2009;7:439‐50. - PMC - PubMed
    1. Xu Z, Shi L, Wang Y, et al. Pathological findings of COVID‐19 associated with acute respiratory distress syndrome. Lancet Respir Med. 2020;8:420‐422. - PMC - PubMed
    1. Guan WJ, Ni ZY, Hu Y, et al, China Medical Treatment Expert Group for, C . Clinical Characteristics of Coronavirus Disease 2019 in China. N Engl J Med. 2020;382:1708‐1720. - PMC - PubMed
    1. Diao B, Wang C, Tan Y, et al. Reduction and functional exhaustion of t cells in patients with coronavirus disease 2019 (COVID‐19). Front Immunol. 2020;11:827. - PMC - PubMed
    1. Song CY, Xu J, He JQ, Lu YQ. Immune dysfunction following COVID‐19, especially in severe patients. Sci Rep. 2020;10:15838. - PMC - PubMed

Publication types