. 2022 Apr 15;376(6590):eabi9591.
doi: 10.1126/science.abi9591. Epub 2022 Apr 15.

KIR+CD8+ T cells suppress pathogenic T cells and are active in autoimmune diseases and COVID-19

Affiliations

KIR+CD8+ T cells suppress pathogenic T cells and are active in autoimmune diseases and COVID-19

Jing Li et al. Science. .

Abstract

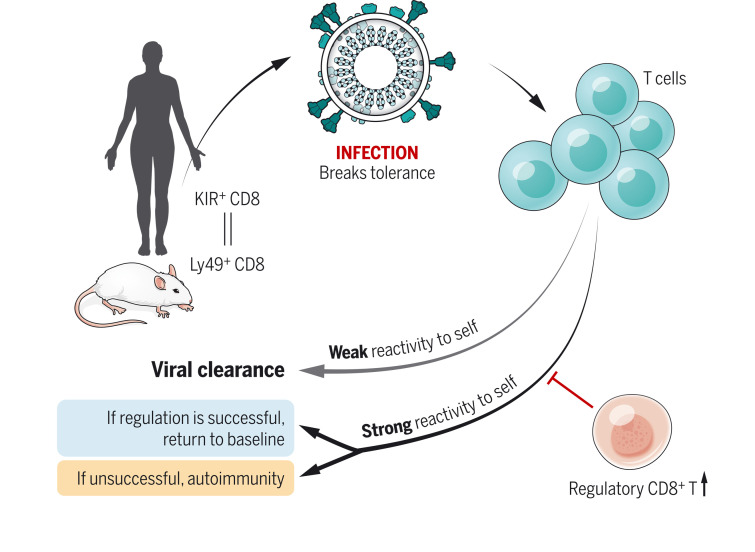
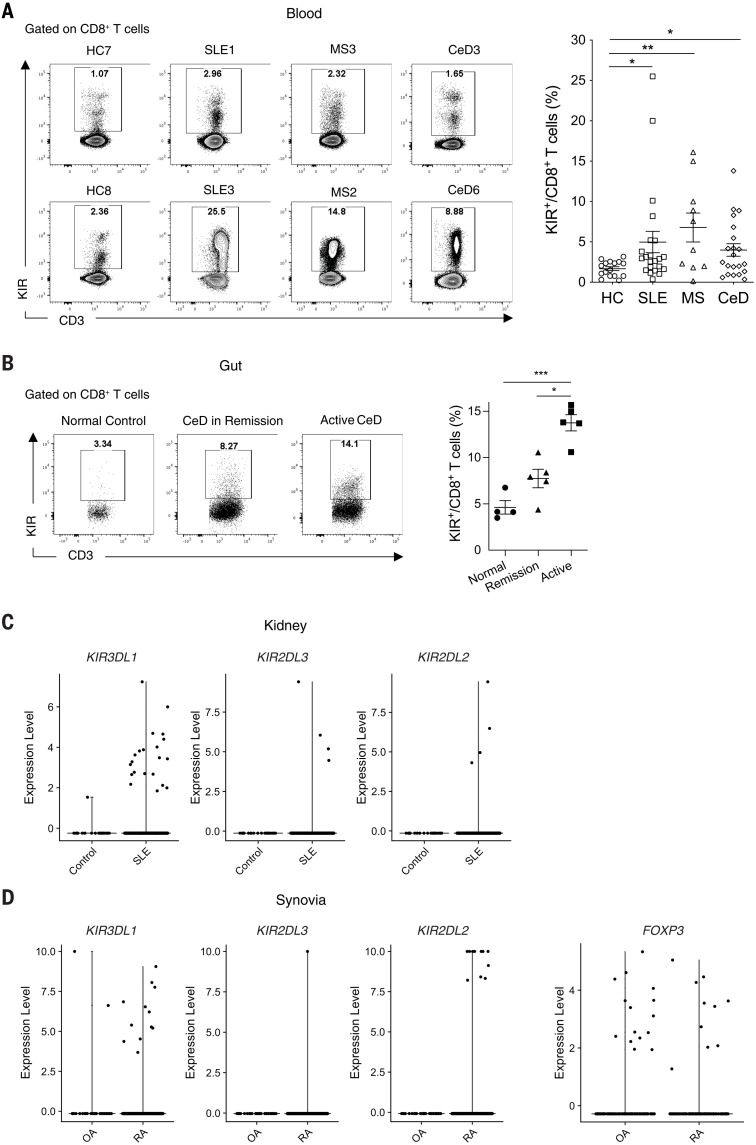
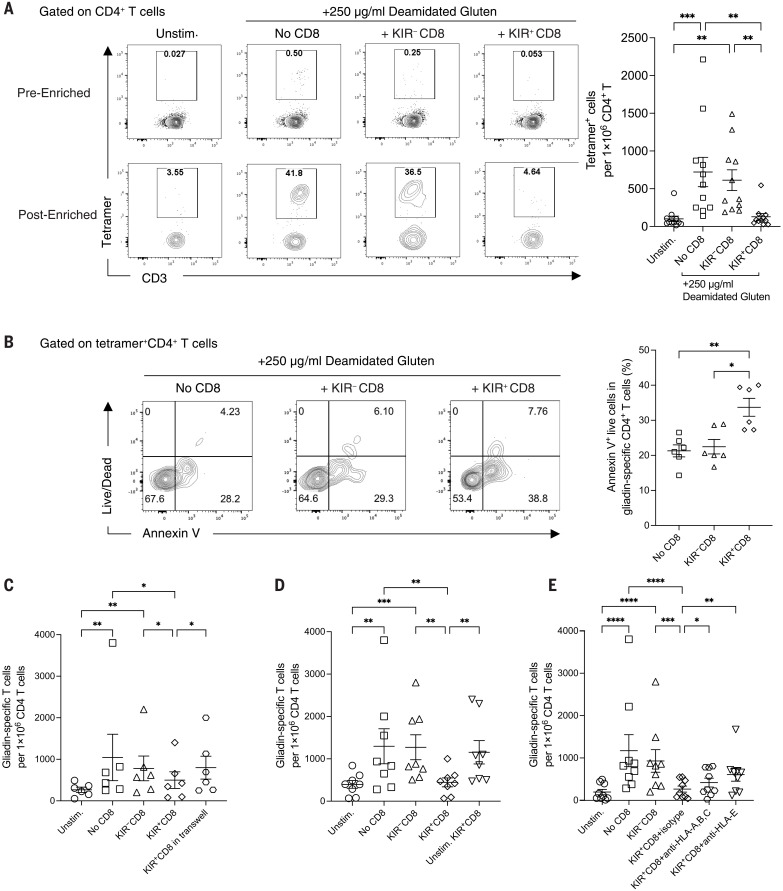
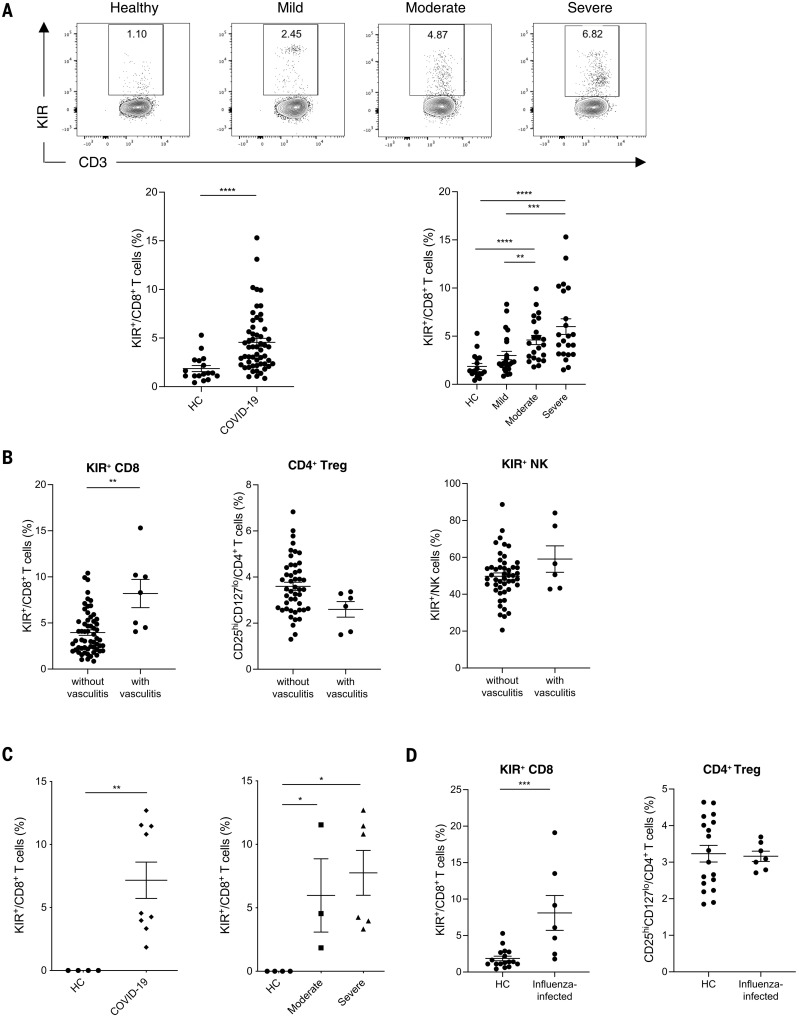
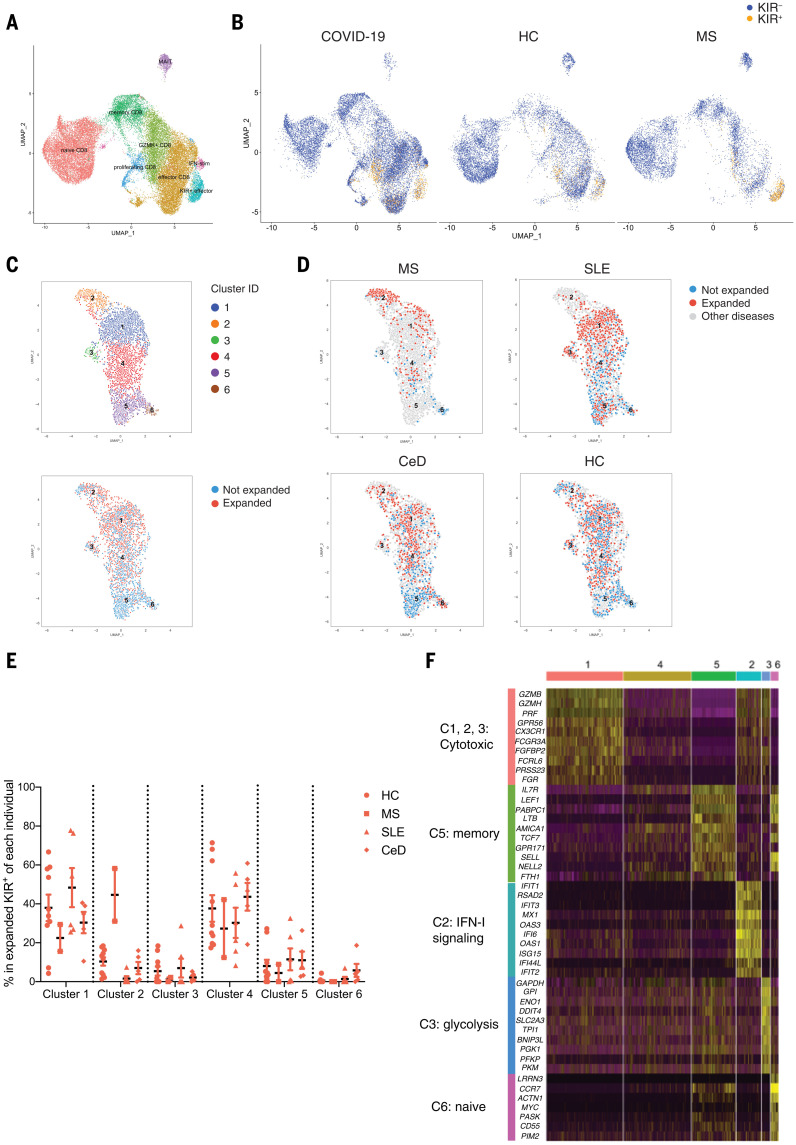
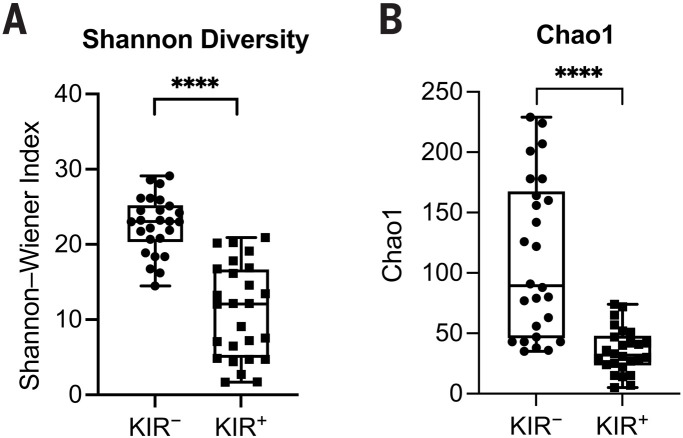
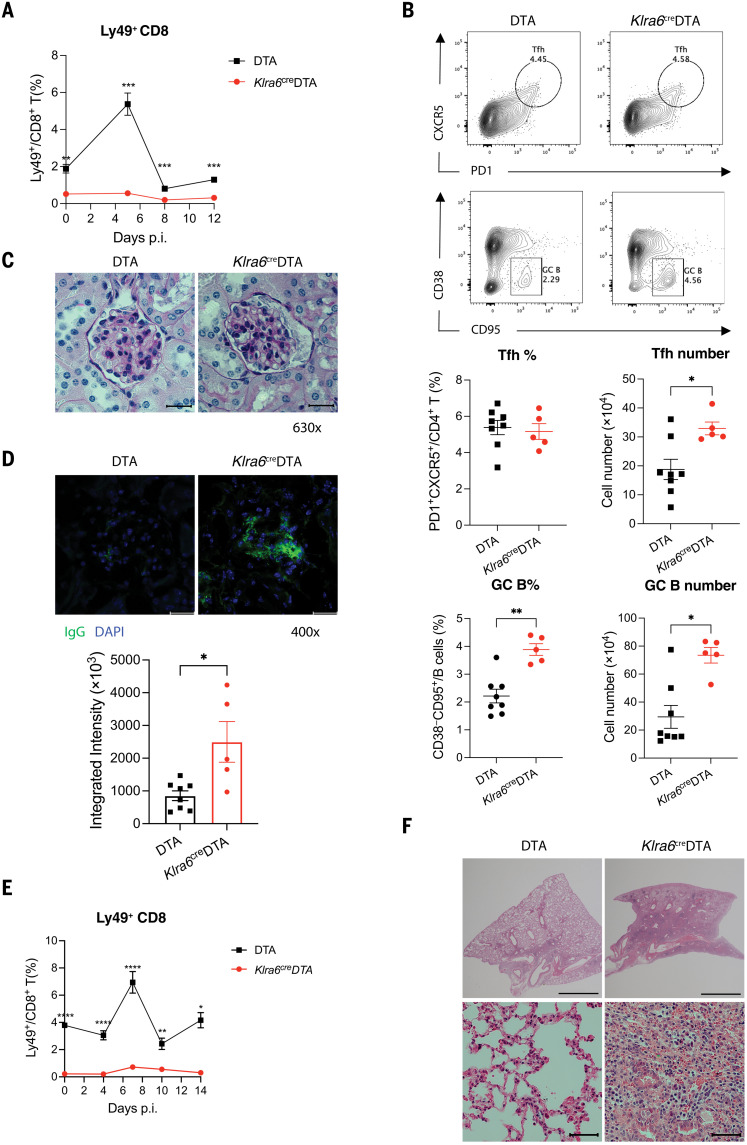
In this work, we find that CD8+ T cells expressing inhibitory killer cell immunoglobulin-like receptors (KIRs) are the human equivalent of Ly49+CD8+ regulatory T cells in mice and are increased in the blood and inflamed tissues of patients with a variety of autoimmune diseases. Moreover, these CD8+ T cells efficiently eliminated pathogenic gliadin-specific CD4+ T cells from the leukocytes of celiac disease patients in vitro. We also find elevated levels of KIR+CD8+ T cells, but not CD4+ regulatory T cells, in COVID-19 patients, correlating with disease severity and vasculitis. Selective ablation of Ly49+CD8+ T cells in virus-infected mice led to autoimmunity after infection. Our results indicate that in both species, these regulatory CD8+ T cells act specifically to suppress pathogenic T cells in autoimmune and infectious diseases.


Figures

None
The proposed role of CD8+ regulatory T cells in peripheral tolerance.
KIR+CD8+ T cells are the equivalent of mouse Ly49+CD8+ T cells in humans, with similar regulatory functions. During an infection, this kind of CD8+ regulatory T cell is induced and suppresses those CD4+ T cells with a strong reactivity to self, which may cause autoimmunity without interfering with the immune responses against pathogens.
Fig. 1.
Fig. 1.. Increased KIR+CD8+ T cells in patients with autoimmune diseases.
(A) Representative contour plots and a summary histogram showing the frequency of KIR+CD8+ T cells in the peripheral blood of HCs (N = 16) and patients with SLE (N = 22), MS (N = 10), or CeD (N = 21) analyzed by flow cytometry. KIR+ cells were detected by PE-conjugated antibodies against KIR2DL1 (clone no. 143211), KIR2DL2/L3 (Dx27), KIR2DL5 (UP-R1), KIR3DL1 (Dx9), and KIR3DL2 (clone no. 539304). *P < 0.05; **P < 0.01; Kruskal-Wallis test followed by multiple comparisons test. (B) Representative contour plots and a summary histogram showing the frequency of KIR+CD8+ T cells in the duodenum of normal controls (N = 4), CeD in remission (N = 5), and active CeD (N = 5) analyzed by flow cytometry. *P < 0.05; ***P < 0.001; Kruskal-Wallis test followed by multiple comparisons test. (C) Expression of KIR transcripts (KIR3DL1, KIR2DL3, and KIR2DL2) in CD8+ T cells from healthy kidneys (control, N = 6) versus SLE nephritis kidneys (N = 20). (D) Expression of KIR transcripts (KIR3DL1, KIR2DL3, and KIR2DL2) in synovial CD8+ T cells and expression of FOXP3 in synovial CD4+ T cells from RA (N = 18) and OA (N = 3).
Fig. 2.
Fig. 2.. Elimination of gliadin-specific CD4+ T cells by KIR+CD8+ T cells.
(A) Representative contour plots showing tetramer-bound CD4+ T cells before and after enrichment and summary of the number of gliadin-specific CD4+ T cells per 1 × 10⁶ CD4+ T cells on day 6. Experiments were repeated using PBMCs from 11 CeD patients. **P < 0.01; ***P < 0.001; Friedman test followed by multiple comparisons test. Unstim., unstimulated. (B) Representative contour plots and a summary graph displaying annexin V binding of gliadin-specific CD4+ T cells from the culture harvested on day 3 (N = 6). *P < 0.05; **P < 0.01; Friedman test followed by multiple comparisons test. (C) Frequency of gliadin-specific CD4+ T cells from the cell cultures in the presence or absence of KIR or KIR+CD8+ T cells or with KIR+CD8+ T cells separated by a 4-μm insert in a transwell plate (N = 6). *P < 0.05; **P < 0.01; Friedman test followed by multiple comparisons test. (D) Frequency of gliadin-specific CD4+ T cells from the PBMC cultures in the presence or absence of KIR or KIR+CD8+ T cells with or without preactivation (N = 8). **P < 0.01; ***P < 0.001; Friedman test followed by multiple comparisons test. (E) Frequency of gliadin-specific CD4+ T cells from the PBMC cultures in the presence or absence of preactivated KIR or KIR+CD8+ T cells with isotype control, anti–HLA-ABC, or anti–HLA-E blockade (N = 9). *P < 0.05; **P < 0.01; ***P < 0.001; ****P < 0.0001; Friedman test followed by multiple comparisons test.
Fig. 3.
Fig. 3.. Increased KIR+CD8+ T cells in infectious diseases.
(A) Representative contour plots and summary scatter plots showing the percentage of KIR+ cells in CD8+ T cells from the blood of 17 HCs and 53 COVID-19 patients with varying disease severity (mild, N = 23; moderate, N = 17; severe, N = 13). ****P < 0.0001; Mann-Whitney test (left). **P < 0.01; ***P < 0.001; ****P < 0.0001; Kruskal-Wallis test followed by multiple comparisons test (right). (B) Frequency of KIR+CD8+ T cells, CD4+ Tregs (CD25hiCD127lo), and KIR+ NK cells in the blood of COVID-19 patients with or without vasculitis. **P < 0.01; Mann-Whitney test. (C) Frequency of CD8+ T cells expressing KIR transcripts (KIR3DL1, KIR3DL2, KIR2DL3, or KIR2DL1) in the bronchoalveolar lavage fluid of HCs (N = 4) versus COVID-19 patients (N = 9) (left; **P < 0.01; Mann-Whitney test) and HCs versus COVID-19 patients with moderate (N = 3) or severe (N = 6) disease (right; *P < 0.05; Kruskal-Wallis test followed by multiple comparisons test). (D) Frequency of KIR+CD8+ T cells and CD4+ Tregs (CD25hiCD127low) in the blood of HCs (N = 17) versus influenza-infected patients (N = 7). ***P < 0.01; Mann-Whitney test.
Fig. 4.
Fig. 4.. scRNA-seq analysis of KIR+CD8+ T cells in the blood.
(A and B) scRNA-seq analysis of total CD8+ T cells from the blood of HCs (N = 10), MS patients (N = 6), and COVID-19 patients (N = 25) by 10X Genomics. (A) UMAP plot of the eight subpopulations identified by unsupervised clustering. (B) UMAP plots showing the distribution of KIR+CD8+ T cells (expressing KIR3DL1, KIR3DL2, KIR2DL1, or KIR2DL3 transcripts) and KIRCD8+ T cells from HCs, MS patients, and COVID-19 patients. (C to F) KIR+CD8+ T cells in the blood of HCs (N = 10) and patients with MS (N = 2), SLE (N = 6), and CeD (N = 5) were sorted for scRNA-seq using the Smart-seq2 protocol and analyzed using the R package “Seurat.” (C) UMAP plots showing KIR+CD8+ T cells segregated into six clusters (top) and the distribution of expanded (≥2 cells expressing same TCR) and unexpanded (cells expressing unique TCRs) cells (bottom). (D) UMAP plots of KIR+CD8+ T cells from MS, SLE, and CeD patients and HCs are shown, with expanded and unexpanded cells annotated with different colors (expanded, red; unexpanded, blue; other diseases, gray). (E) Cluster compositions of expanded KIR+CD8+ T cells from each individual. (F) Heatmap showing expression of the top 10 genes differentially expressed in each cluster, with the categories of each group of genes annotated on the left.
Fig. 5.
Fig. 5.. Analysis of TCR sequences of KIR+CD8+ T cells.
(A and B) Summary histograms showing Shannon-Wiener indices (A) and Chao estimates (B) of TCRs of KIR versus KIR+CD8+ T cells from 26 subjects, including 11 healthy donors, two MS, five SLE, three CeD, and five T1D patients as evaluated by VDJtools. ****P < 0.0001; Wilcoxon matched-pairs signed-rank test.
Fig. 6.
Fig. 6.. Exacerbated autoimmunity in Klra6creDTA mice after viral infection.
(A) Frequency of Ly49+CD8+ T cells in the blood of DTA mice (N = 8) and Klra6creDTA mice (N = 5) 0, 5, 8, and 12 days after LCMV-Armstrong infection. **P < 0.01; ***P < 0.001; repeated measures (RM) two-way analysis of variance (ANOVA) followed by multiple comparisons test. p.i., postinfection. (B) Representative contour plots and summarized scatter plots displaying frequency and absolute number of PD1+CXCR5+CD4+ T cells (TFH) and CD38CD95+ GC B cells in the spleen of DTA mice (N = 8) and Klra6creDTA mice (N = 5) 30 days after LCMV-Armstrong infection. *P < 0.05; **P < 0.01; Mann-Whitney test. Tfh, T follicular helper cell. (C) Representative kidney pathology of day-30 LCMV-infected DTA mice and Klra6creDTA mice assessed by PAS staining (630X; scale bars, 20 μm). (D) IgG deposition in glomeruli of the kidneys of DTA mice (N = 8) and Klra6creDTA mice (N = 5) 30 days after LCMV infection accessed by immunofluorescence staining (400X; scale bars, 20 μm) and quantified by ImageJ. *P < 0.05; Mann-Whitney test. DAPI, 4′,6-diamidino-2-phenylindole. (E) Frequency of Ly49+CD8+ T cells in the blood of DTA mice (N = 6) and Klra6creDTA mice (N = 5) after influenza A-PR8 infection. *P < 0.05; **P < 0.01; ****P < 0.0001; RM two-way ANOVA followed by multiple comparisons test. (F) Microscopy of representative H&E staining of lung sections from DTA mice and Klra6creDTA mice 60 days after influenza infection (top, 20X; scale bars, 2 mm) (bottom, 630X; scale bars, 50 μm). Representative data from two independent experiments are shown. The means ± SEMs are indicated.

Update of

Comment in

References

    1. Nakagawa H., Wang L., Cantor H., Kim H. J., New Insights Into the Biology of CD8 Regulatory T Cells. Adv. Immunol. 140, 1–20 (2018). 10.1016/bs.ai.2018.09.001 - DOI - PubMed
    1. Koh D. R., Fung-Leung W.-P., Ho A., Gray D., Acha-Orbea H., Mak T.-W., Less mortality but more relapses in experimental allergic encephalomyelitis in CD8-/- mice. Science 256, 1210–1213 (1992). 10.1126/science.256.5060.1210 - DOI - PubMed
    1. Jiang H., Zhang S. I., Pernis B., Role of CD8+ T cells in murine experimental allergic encephalomyelitis. Science 256, 1213–1215 (1992). 10.1126/science.256.5060.1213 - DOI - PubMed
    1. Kim H. J., Verbinnen B., Tang X., Lu L., Cantor H., Inhibition of follicular T-helper cells by CD8+ regulatory T cells is essential for self tolerance. Nature 467, 328–332 (2010). 10.1038/nature09370 - DOI - PMC - PubMed
    1. Kim H. J., Wang X., Radfar S., Sproule T. J., Roopenian D. C., Cantor H., CD8+ T regulatory cells express the Ly49 Class I MHC receptor and are defective in autoimmune prone B6-Yaa mice. Proc. Natl. Acad. Sci. U.S.A. 108, 2010–2015 (2011). 10.1073/pnas.1018974108 - DOI - PMC - PubMed

Publication types