. 2022 Oct;18(10):2409-2426.
doi: 10.1080/15548627.2022.2038898. Epub 2022 Mar 8.

Mitochondrial respiration supports autophagy to provide stress resistance during quiescence

Affiliations

Mitochondrial respiration supports autophagy to provide stress resistance during quiescence

Silvia Magalhaes-Novais et al. Autophagy. 2022 Oct.

Abstract

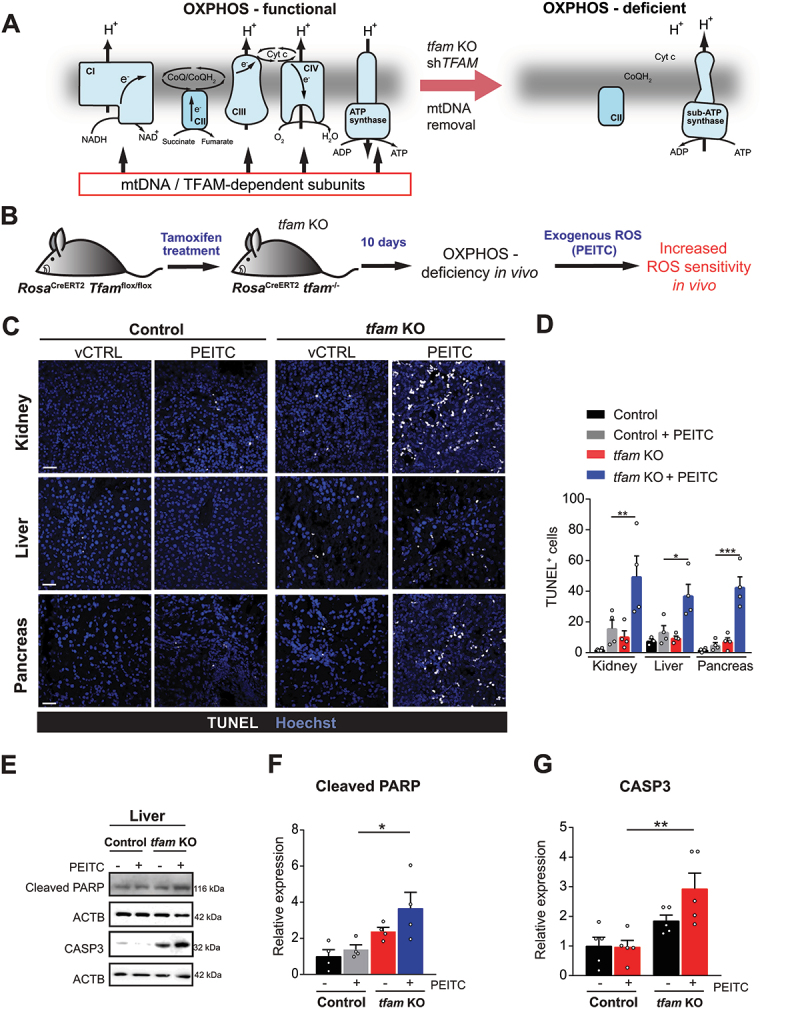
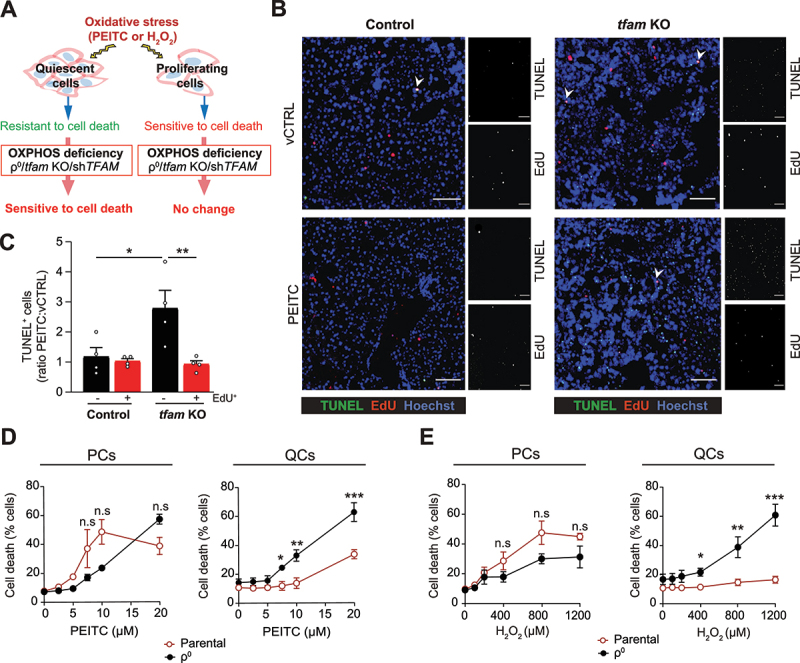
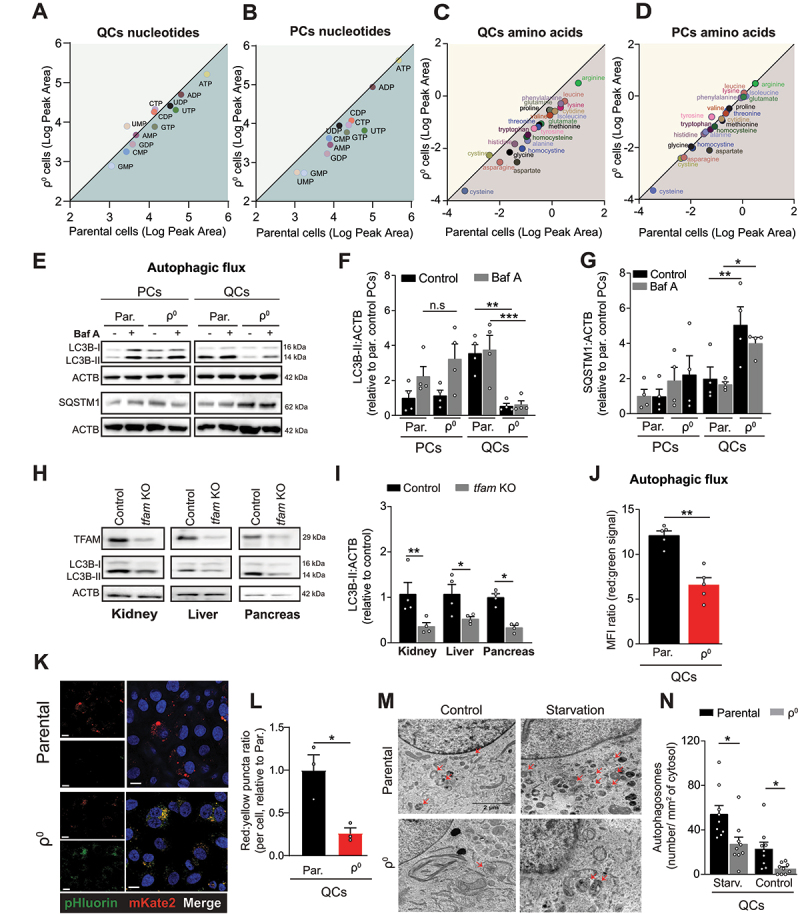
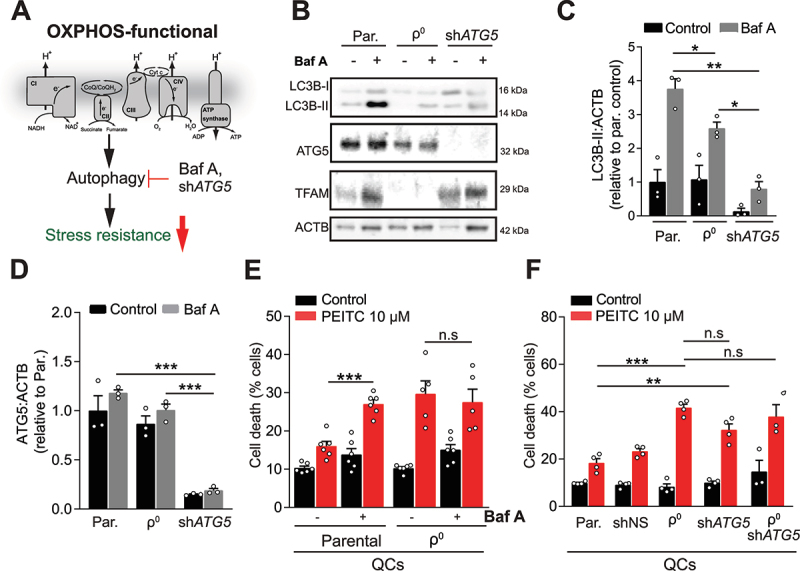
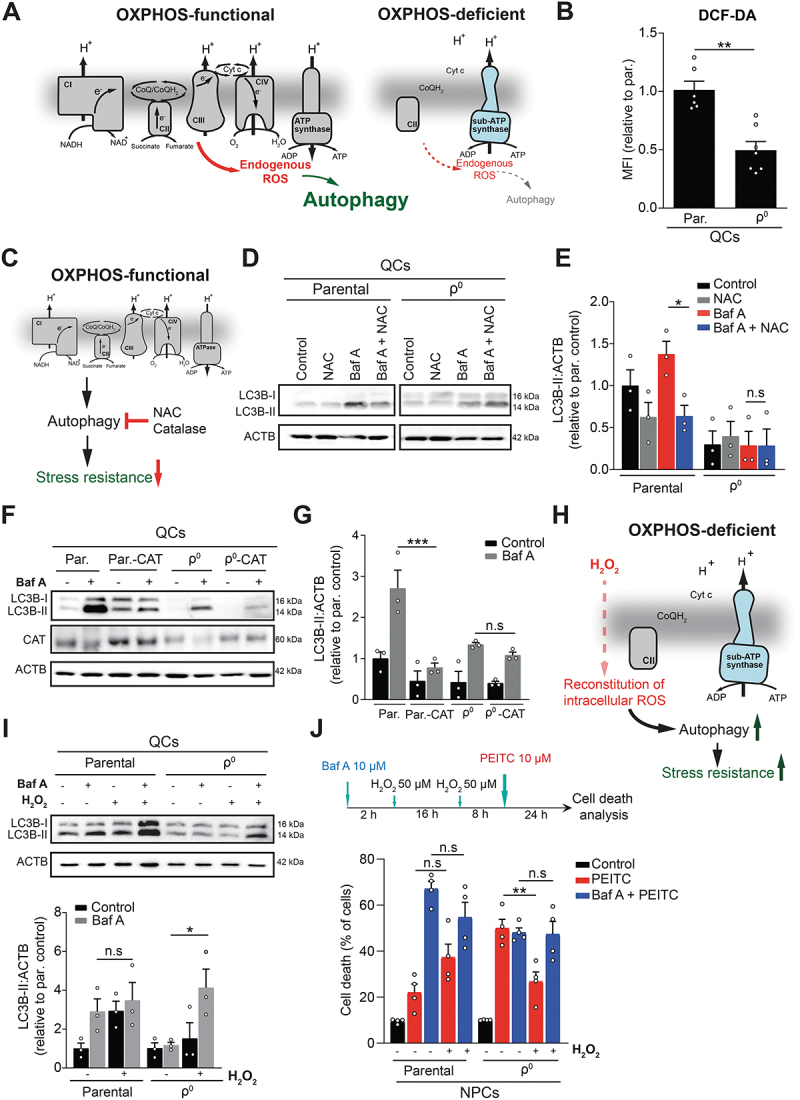
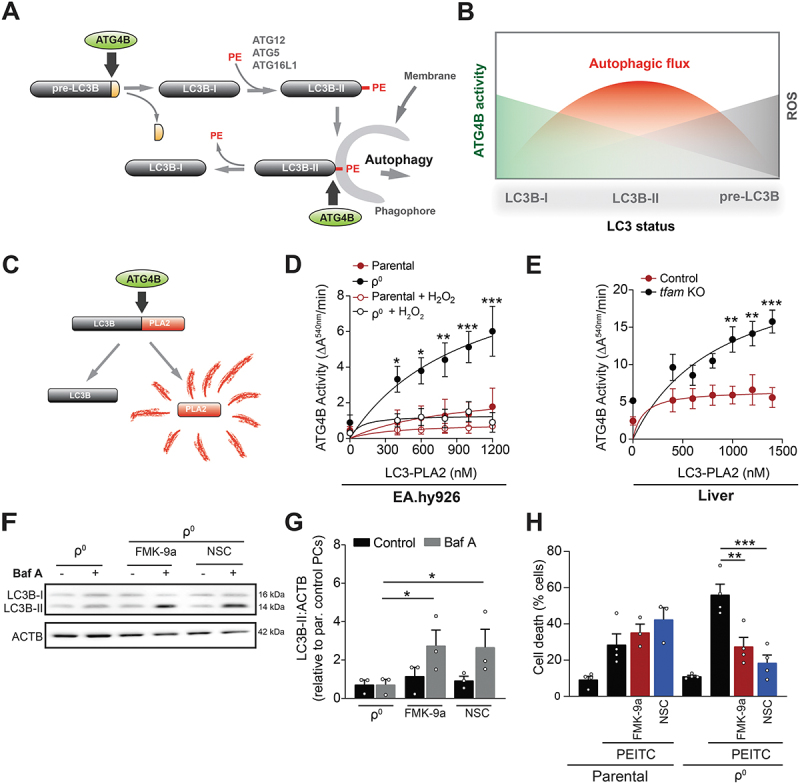
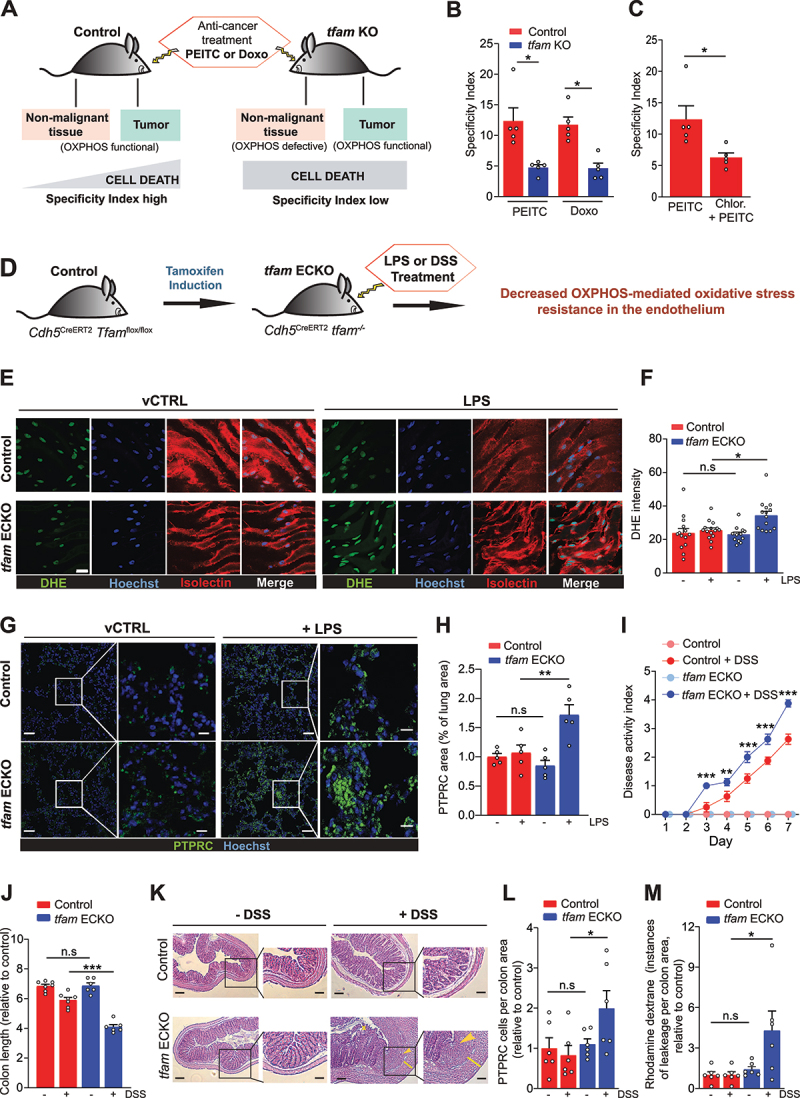
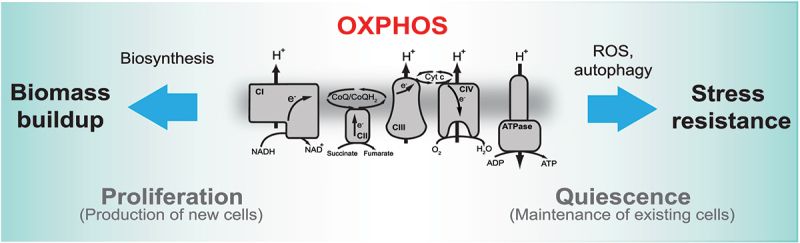
Mitochondrial oxidative phosphorylation (OXPHOS) generates ATP, but OXPHOS also supports biosynthesis during proliferation. In contrast, the role of OXPHOS during quiescence, beyond ATP production, is not well understood. Using mouse models of inducible OXPHOS deficiency in all cell types or specifically in the vascular endothelium that negligibly relies on OXPHOS-derived ATP, we show that selectively during quiescence OXPHOS provides oxidative stress resistance by supporting macroautophagy/autophagy. Mechanistically, OXPHOS constitutively generates low levels of endogenous ROS that induce autophagy via attenuation of ATG4B activity, which provides protection from ROS insult. Physiologically, the OXPHOS-autophagy system (i) protects healthy tissue from toxicity of ROS-based anticancer therapy, and (ii) provides ROS resistance in the endothelium, ameliorating systemic LPS-induced inflammation as well as inflammatory bowel disease. Hence, cells acquired mitochondria during evolution to profit from oxidative metabolism, but also built in an autophagy-based ROS-induced protective mechanism to guard against oxidative stress associated with OXPHOS function during quiescence.Abbreviations: AMPK: AMP-activated protein kinase; AOX: alternative oxidase; Baf A: bafilomycin A1; CI, respiratory complexes I; DCF-DA: 2',7'-dichlordihydrofluorescein diacetate; DHE: dihydroethidium; DSS: dextran sodium sulfate; ΔΨmi: mitochondrial inner membrane potential; EdU: 5-ethynyl-2'-deoxyuridine; ETC: electron transport chain; FA: formaldehyde; HUVEC; human umbilical cord endothelial cells; IBD: inflammatory bowel disease; LC3B: microtubule associated protein 1 light chain 3 beta; LPS: lipopolysaccharide; MEFs: mouse embryonic fibroblasts; MTORC1: mechanistic target of rapamycin kinase complex 1; mtDNA: mitochondrial DNA; NAC: N-acetyl cysteine; OXPHOS: oxidative phosphorylation; PCs: proliferating cells; PE: phosphatidylethanolamine; PEITC: phenethyl isothiocyanate; QCs: quiescent cells; ROS: reactive oxygen species; PLA2: phospholipase A2, WB: western blot.

Keywords: ATG4B; biosynthesis; cell death; electron transport chain; endothelial cells; mitochondria; oxidative phosphorylation; oxidative stress; reactive oxygen species.


Conflict of interest statement

The authors declare no competing interests.

Figures

Figure 1.
Figure 1.
OXPHOS deficiency sensitizes to oxidative stress in vivo. (A) mtDNA removal, TFAM silencing or tfam deletion results in OXPHOS-deficient cells that lack ETC and contain a subcomplex of ATP synthase (sub-ATP synthase) that functions in reverse to hydrolyze ATP for ΔΨmi maintenance. (B) tfam deletion strategy in RosaCreERT2 Tfamflox/flox mice (referred to as tfam KO). (C) Representative images of cell death analyzed by TUNEL assay in kidney, liver and pancreas from vehicle-treated (vCTRL) and PEITC-treated control and tfam KO mice. Scale bar: 300 µm. (D) Quantification of TUNEL+ cells as shown in (C) (mean ± S.E.M., n = 4 mice per condition, *p < 0.05, **p < 0.01, ***p < 0.001, one-way ANOVA with Sidak’s multiple comparisons test). (E) Representative WB images of the cleaved PARP and cleaved CASP3 in liver tissue of control and tfam KO mice treated or not with PEITC. (F and G) Densitometric quantification of WB in E and 3-4 additional independent experiments (normalized to ACTB, mean ± S.E.M., n ≥ 3 mice per condition, *p < 0.05, **p < 0.01, one-way ANOVA with Sidak’s multiple comparisons test).
Figure 2.
Figure 2.
OXPHOS deficiency selectively sensitizes quiescent cells to oxidative stress. (A) OXPHOSdeficiency in quiescent cells leads to increased cell death upon oxidative damage. (B) Representative images of cell death and cell proliferation analyzed by TUNEL and EdU staining, respectively, in the liver of vCTRL and PEITC-treated mice. Scale bar: 500 µm. (C) Quantification of TUNEL positivity (ratio between PEITC and vCTRL) in EdU+ (proliferating, PCs) and EdU (quiescent, QCs) cells (mean ± S.E.M., n = 4 mice per condition, *p < 0.05, **p < 0.01, one-way ANOVA with Sidak’s multiple comparisons test). (D and E) Cell death in EA.hy926 PCs and QCs with (ρ0) or without OXPHOS deficiency and treated with (D) PEITC and (E) H2O2 for 22 h evaluated by ANXA5-FITC and PI using flow cytometry (mean ± S.E.M., n ≥ 4, n.s.p > 0.05, *p < 0.05, **p < 0.01, ***p < 0.001 versus parental cells, two-way ANOVA with Tukey’s multiple comparisons test).
Figure 3.
Figure 3.
Autophagy is suppressed in OXPHOS-deficient quiescent cells and tissues. (A-D) Mass spectrometry quantification of intracellular levels of nucleotides and amino acids in parental and ρ0 EA.hy926 cells. Nucleotides QCs (A), nucleotides PCs (B), amino acids QCs (C), amino acids PCs (D). The plots show the logarithms of peak area for individual nucleotides and amino acids (mean of n > 3 independent experiments). The values below the diagonal are reduced in ρ0 compared to parental cells. (E) Representative WB images of activated LC3B (LC3B-II) and SQSTM1 in PCs and QCs in the presence or absence of 50 nM of Baf A for 4 h. (F and G) Densitometric quantification of LC3B-II (F) and SQSTM1 (G) (mean ± S.E.M., n = 4, n.s.p > 0.05, *p < 0.05, **p < 0.01, one-way ANOVA with Sidak’s multiple comparisons test). (H) Representative WB images of TFAM protein expression and activated LC3B (LC3B-II) in kidney, liver and pancreas of control and tfam KO mice. (I) Densitometric quantification of activated LC3B (LC3B-II) as in H (mean ± S.E.M, n = 4 mice, *p < 0.05, **p < 0.01, unpaired two-tailed t test). (J) Fluorescent signal of the pHluorin-mKate2-LC3 autophagy flux reporter in parental and OXPHOS deficient EA.hy926 QCs assessed by flow cytometry (mean ± S.E.M., n = 5, **p < 0.01, unpaired two-tailed t test). Note: red:green fluorescence ratio is proportional to the native autophagic flux. (K and L) Representative images pHluorin-mKate2-LC3 flux reporter (K) and quantification of LC3 puncta (L) in parental and OXPHOS deficient EA.hy926 QCs assessed by confocal microscopy. Puncta counts were normalized to the number of cells (mean ± S.E.M., n = 3, **p < 0.01, unpaired two-tailed t test). Scale bar: 40 µm. (M) Representative transmission electron microscopy images and (N) autophagosome quantification of control and starved EA.hy926 parental and ρ0 QCs cells. Autophagosomes are indicated by red arrows (n = 9 cells per condition, *p < 0.05, unpaired two-tailed t test). Scale bar: 2 µm.
Figure 4.
Figure 4.
Suppression of autophagy in quiescent cells recapitulates the effects of OXPHOS deficiency on resistance to stress. (A) Pharmacological (Baf A) and genetic (shATG5) suppression of autophagy in parental QCs was used to explore its potential effects downstream of OXPHOS deficiency. (B, C, D) Representative WB images (B) and quantifications of LC3B-II (C) and ATG5 (D) in parental and ρ0 EA.hy926 QCs (mean ± S.E.M., n = 3, n.s.p > 0.05, *p < 0.05, **p < 0.01, ***p < 0.001, one-way ANOVA with Sidak’s multiple comparisons test). (E) Cell death in EA.hy926 QCs with or without OXPHOS deficiency, pre-incubated or not with 50 nM of Baf A for 2 h followed by 10 µM PEITC for 22 h, evaluated by ANXA5-FITC and PI (mean ± S.E.M., n ≥ 4, n.s.p > 0.05, ***p < 0.001, one-way ANOVA with Sidak’s multiple comparisons test). (F) Cell death in indicated EA.hy926 QCs treated with 10 µM of PEITC for 22 h, evaluated by ANXA5-FITC and PI (mean ± S.E.M., n = 4, n.s.p > 0.05, **p < 0.01, ***p < 0.001, one-way ANOVA with Sidak’s multiple comparisons test).
Figure 5.
Figure 5.
OXPHOS-derived ROS maintain autophagy and ROS resistance in quiescent cells. (A) OXPHOS-deficient QCs lack respiratory complexes and are therefore expected to produce less ROS from the ETC, possibly affecting autophagy. (B) Baseline ROS levels in EA.hy926 QCs assessed using DCF-DA fluorescent probe by flow cytometry (mean ± S.E.M., n ≥ 6, **p < 0.01, unpaired two-tailed t test). (C) Pharmacological (NAC) and genetic (catalase overexpression) reduction of endogenous ROS in parental QCs was used to recapitulated effects of OXPHOS deficiency on autophagy. (D and E) Representative WB image (D) and quantification (E) of activated LC3B (LC3B-II) in parental or ρ0 EA.hy926 QCs treated or not with NAC (1 mM) for 6 h and/or with Baf A (50 nM) for 4 h (mean ± S.E.M., n = 3, n.s.p > 0.05, *p < 0.05, unpaired two-tailed t test). (F and G) Representative WB image (F) and quantification (G) of activated LC3B (LC3B-II) protein levels in parental and ρ0 EA.hy926 QCs with or without overexpression of catalase in the presence or absence of Baf A (50 nM) (mean ± S.E.M., n = 3, n.s.p > 0.05, ***p < 0.001, unpaired two-tailed t test). (H) Treatment with low levels of exogenous ROS (H2O2) in OXPHOS deficient QCs was used to restore autophagy and cell death resistance. (I) Representative WB image (top) and quantification (bottom) of the activated LC3B (LC3B-II) protein expression in EA.hy926 parental and ρ0 QCs treated or not with H2O2 (1 mM) for 4 h in the presence or absence of Baf A (50 nM) (mean ± S.E.M., n = 3, n.s.p > 0.05, *p < 0.05, unpaired two-tailed t test). (J) PEITC-induced cell death in parental and ρ0 EA.hy926 QCs pre-treated or not with Baf A (10 µM), with or without pre-conditioning by H2O2 as shown in the scheme, measured by ANXA5 and PI (mean ± S.E.M, n = 4, n.s.p > 0.05, **p < 0.01, one-way ANOVA with Sidak’s multiple comparisons test).
Figure 6.
Figure 6.
ETC-derived ROS regulate autophagy during quiescence via ATG4B. (A and B) ROS-sensitive ATG4B both activates (by cleaving pre-LC3) and inhibits (by removing PE) LC3B (A), leading to a complex relationship between ATG4B activity, ROS and autophagy (B). At optimal ROS levels ATG4B activity is partially attenuated, the activating pre-LC3 cleavage can proceed while the inhibitory removal of PE is suppressed, leading to the maximal autophagic flux. (C) The LC3B-PLA2 (phospholipase A2)-based reporter to assess ATG4B function. Active ATG4B liberates PLA2, producing signal in a fluorogenic assay. (D) ATG4B activity in cell lysates from EA.hy926 QCs treated or not with H2O2 (1 mM) for 4 h and incubated with increasing concentrations of LC3B-PLA2 fusion protein substrate (mean ± S.E.M., n ≥ 4, *p < 0.05, **p < 0.01, ***p < 0.001, versus parental cells, two-Way ANOVA with Tukey’s multiple comparisons test). (E) ATG4B activity in cell lysates from liver of control or tfam KO mice incubated with increasing concentrations of LC3B-PLA2 fusion protein substrate (mean ± S.E.M., n = 4 mice, **p < 0.01, ***p < 0.001, versus control cells, two-way ANOVA with Tukey’s multiple comparisons test). (F and G) Representative WB image (F) and quantification (G) of the activated LC3B (LC3B-II) protein in EA.hy926 ρ0 QCs treated with FMK-9a (1 µM) and NSC185058 (0.1 µM) for 4h (mean ± S.E.M., n = 3, *p < 0.05, unpaired two-tailed t test). (H) PEITC-induced cell death in parental and ρ0 EA.hy926 QCs pre-treated or not with FMK-9a (1 µM) and NSC185058 (0.1 µM) for 2 h, measured by ANXA5 and PI. (mean ± S.E.M, n = 4, n.s.p > 0.05, **p < 0.01, one-way ANOVA with Sidak’s multiple comparisons test).
Figure 7.
Figure 7.
OXPHOS-mediated stress resistance during quiescence maintains therapeutic window in cancer and limits inflammation-linked pathology. (A) OXPHOS maintains therapeutic window by supporting resistance to ROS in non-malignant tissue during ROS-based cancer therapy. Treatment-induced cell death in non-malignant tissues (contain mostly QCs) is increased in tumor-bearing tfam KO mice, compromising specificity of treatment. (B) Specificity index (SI) assessed by quantification of the ratio of TUNEL+ cells in tumor and liver tissue from control and tfam KO mice after treatment with PEITC and doxorubicin (Doxo). (C) Specificity index (SI) assessed by quantification of the ratio of TUNEL+ cells in tumor and liver tissues from control mice treated with PEITC (1.25 mg/25 g mouse in corn oil) or PEITC + chloroquine (1 mg/20 g mouse in corn oil), (mean ± S.E.M., n = 5 mice per condition, *p < 0.05, **p < 0.01, one-way ANOVA with Sidak’s multiple comparisons test). (D) Endothelium-specific tfam deletion strategy in Cdh5CreERT2 Tfamflox/flox mice (referred to as tfam ECKO). (E and F) Representative images (E) and quantification (F) of aorta open book preparations from control and tfam ECKO mice treated with LPS for 4 h, stained for DHE (green), the EC marker isolectin B4 (red) and nuclei (Hoechst-blue). Scale bar: 20 µm. (n ≥ 12 mice per group, n.s.p > 0.05, *p < 0.05, one-way ANOVA with Sidak’s multiple comparisons test). (G and H) Representative images (G) and quantification (H) of lungs from control and tfam ECKO mice 4 h after injection of LPS or vehicle solution stained with PTPRC/CD45 (green) and Hoechst (blue) (n = 5 mice per group, n.s.p > 0.05, **p < 0.01, one-way ANOVA with Sidak’s multiple comparisons test). Right panels in G are magnifications of the boxed areas on the left. Scale bar: 40 µm (left panels) and 20 µm (right panels). (I) Disease activity index of colitis in control and tfam ECKO mice during treatment with 2.5% DSS in the drinking water for 7 consecutive days (n = 6 mice, ***p < 0.001, two-way ANOVA Tukey’s multiple comparisons test). (J) Colon length in control and tfam ECKO mice after 2.5% DSS treatment (n = 6; 3 males, 3 females per group), n.s.p > 0.05, **p < 0.01, ***p < 0.001, one-way ANOVA with Sidak’s multiple comparisons test). (K) Representative images of hematoxylin and eosin-stained sections of colon from control and tfam ECKO mice treated as in I. Right panels are magnifications of the respective boxed areas. Asterisks denotes loss of crypts; arrowhead denotes more severe separation of the crypt base from the muscularis mucosa, infiltrated with inflammatory cells; yellow line visualizes the thickness of the colonic wall. Scale bar: 500 µm. (L) Quantification of colon PTPRC/CD45+ cells per total area of tissue from control and tfam ECKO mice after 2.5% DSS treatment (n = 6 mice, n.s.p > 0.05, *p < 0.05, one-way ANOVA with Sidak’s multiple comparisons test). (M) Quantification of vascular leakiness (dextran-rhodamine signal) in colon from control and tfam ECKO mice after 2.5% DSS treatment (n = 6 mice, n.s.p > 0.05, *p < 0.05, one-way ANOVA with Sidak’s multiple comparisons test).
Figure 8.
Figure 8.
Distinct roles of OXPHOS during proliferation and quiescence. The proposed model depicts specific roles of OXPHOS in proliferating and quiescent cells. In proliferating cells OXPHOS supports biosynthesis, whereas in quiescent cells it provides stress resistance via ROS-stimulated autophagy.

References

    1. Arrojo EDR, Lev-Ram V, Tyagi S. et al. Age Mosaicism across Multiple Scales in Adult Tissues. Cell Metab. 2019;30(2):343–351 e343. PubMed PMID: 31178361 - PMC - PubMed
    1. Kops GJ, Dansen TB, Polderman PE. et al. Forkhead transcription factor FOXO3a protects quiescent cells from oxidative stress. Nature. 2002;419(6904):316–321. PubMed PMID: 12239572 - PubMed
    1. Naderi J, Hung M, Pandey S.. Oxidative stress-induced apoptosis in dividing fibroblasts involves activation of p38 MAP kinase and over-expression of Bax: resistance of quiescent cells to oxidative stress. Apoptosis. 2003;8(1):91–100. PubMed PMID: 12510156 - PubMed
    1. Legesse-Miller A, Raitman I, Haley EM. et al. Quiescent fibroblasts are protected from proteasome inhibition-mediated toxicity. Mol Biol Cell. 2012;23(18):3566–3581. PubMed PMID: 22875985 - PMC - PubMed
    1. Valentin M, Yang E.. Autophagy is activated, but is not required for the G0 function of BCL-2 or BCL-xL. Cell Cycle. 2008;7(17):2762–2768. PubMed PMID: 18758240 - PubMed

MeSH terms