. 2022 Mar 31;479(6):767-786.
doi: 10.1042/BCJ20220008.

Regulation of chromatin accessibility by hypoxia and HIF

Affiliations

Regulation of chromatin accessibility by hypoxia and HIF

Michael Batie et al. Biochem J. .

Abstract

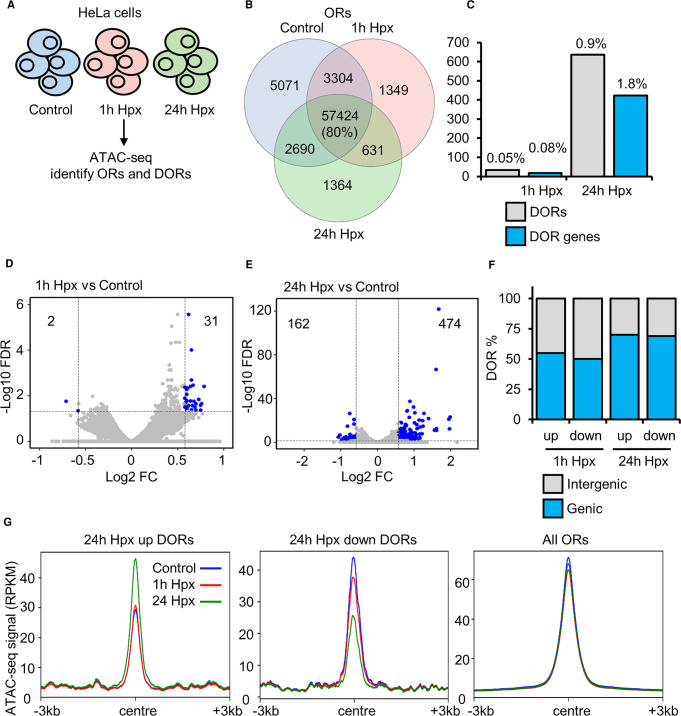
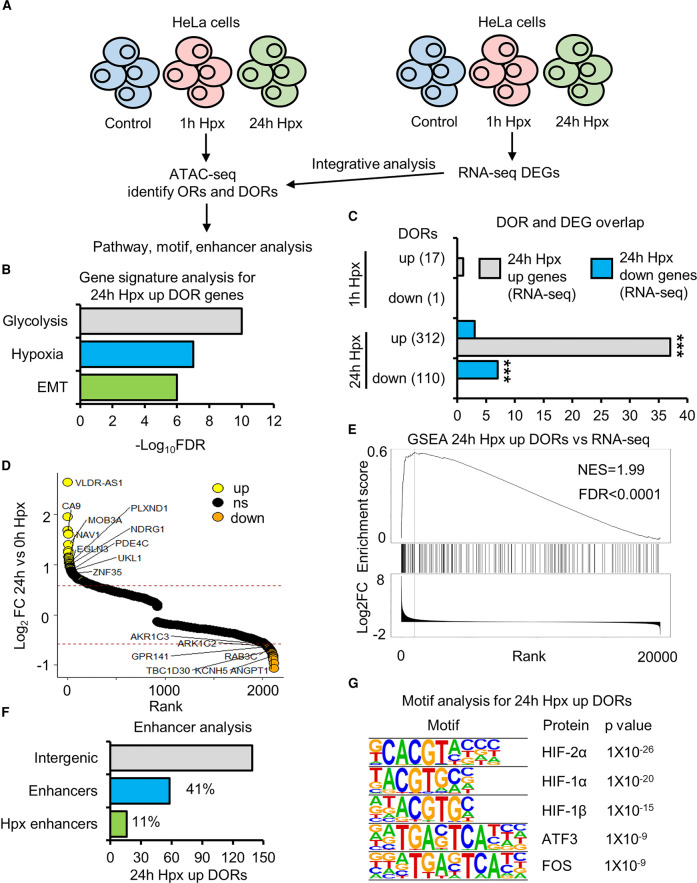
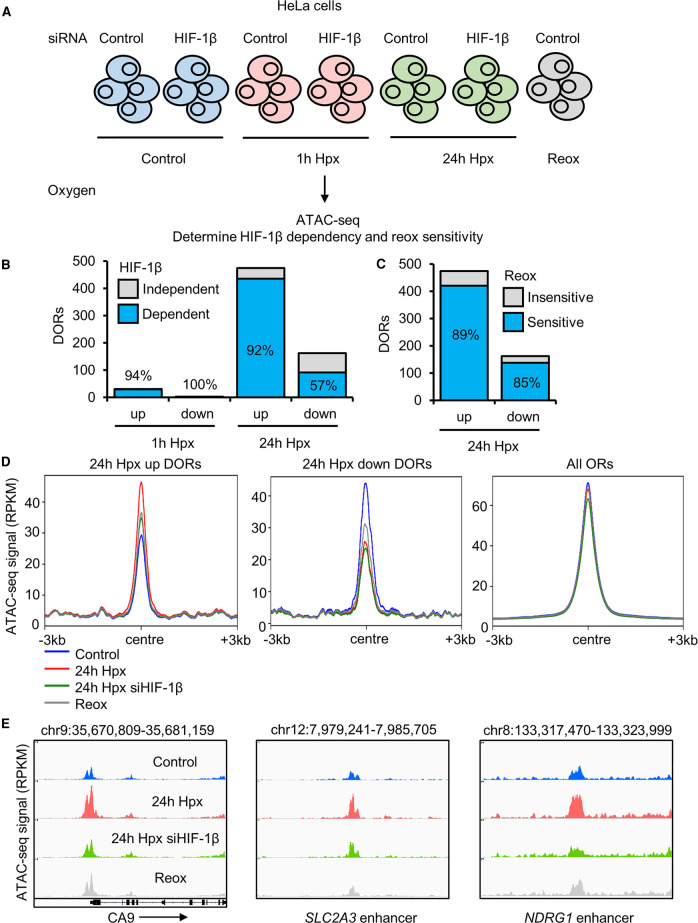
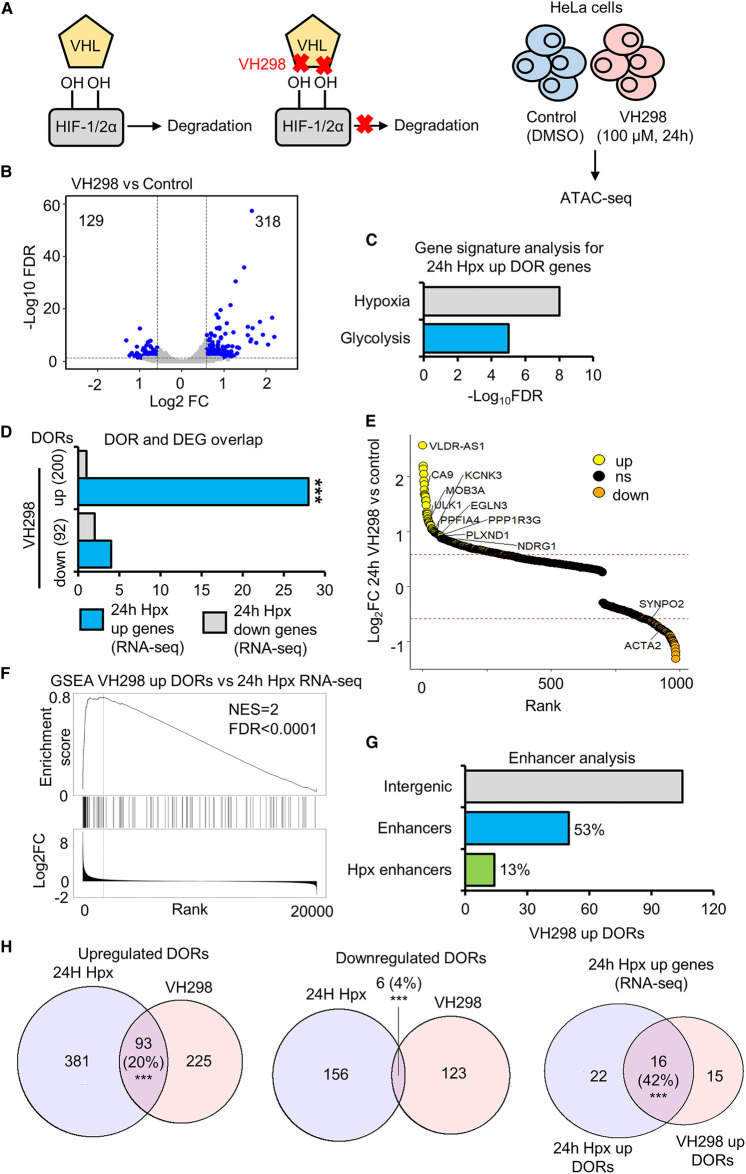
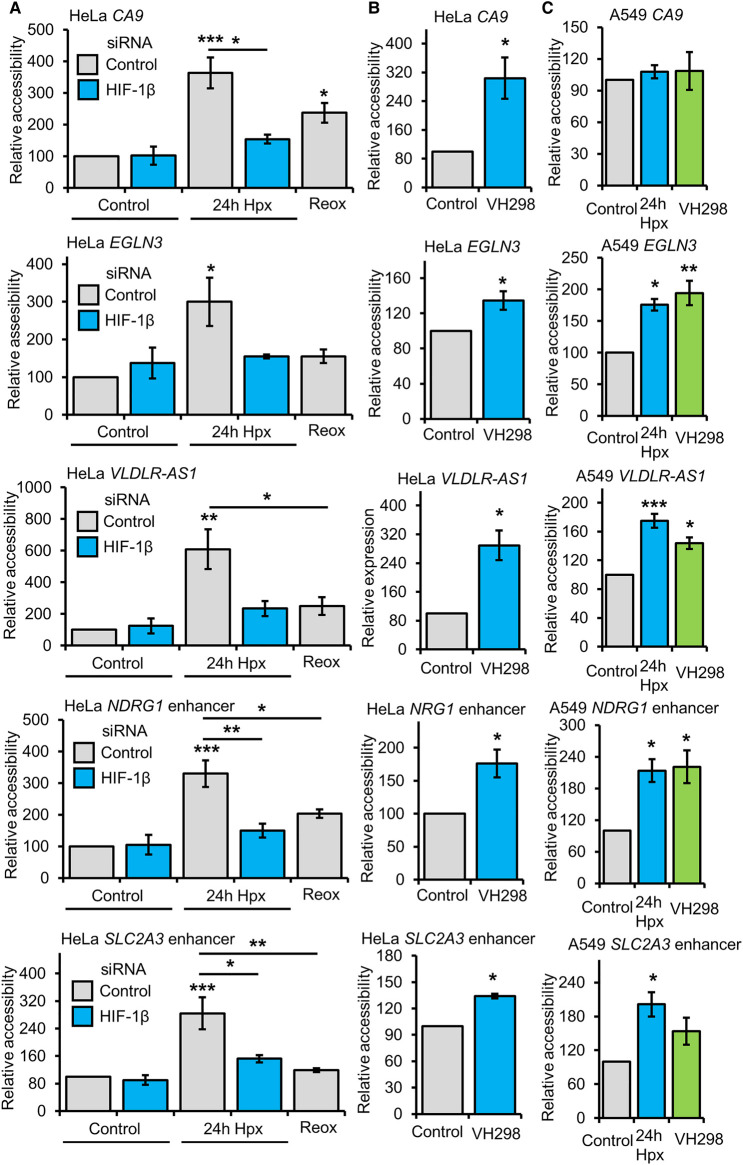
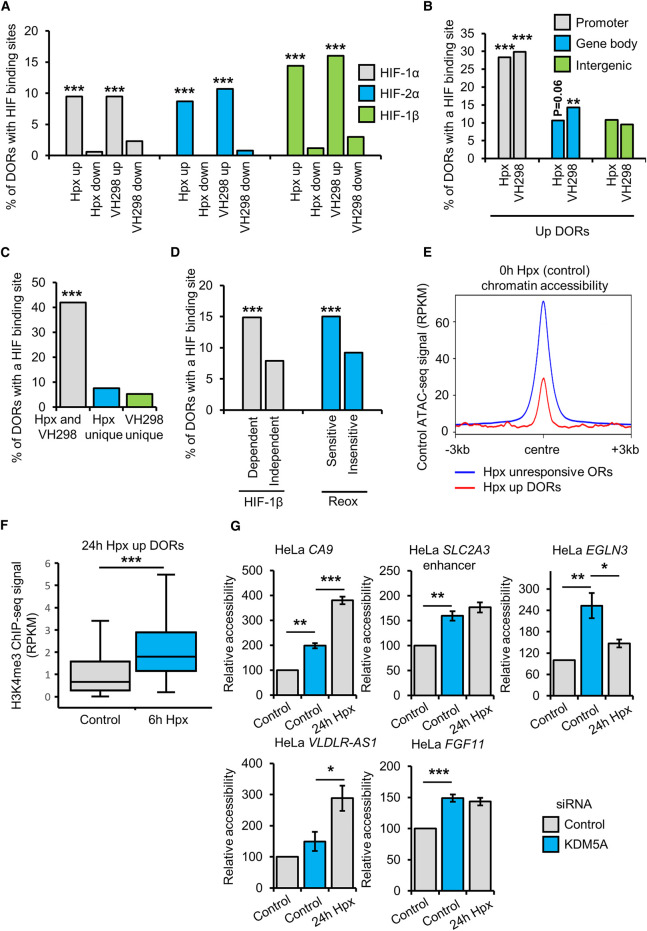
Reduced oxygen availability (hypoxia) can act as a signalling cue in physiological processes such as development, but also in pathological conditions such as cancer or ischaemic disease. As such, understanding how cells and organisms respond to hypoxia is of great importance. The family of transcription factors called Hypoxia Inducible Factors (HIFs) co-ordinate a transcriptional programme required for survival and adaptation to hypoxia. However, the effects of HIF on chromatin accessibility are currently unclear. Here, using genome wide mapping of chromatin accessibility via ATAC-seq, we find hypoxia induces loci specific changes in chromatin accessibility are enriched at a subset hypoxia transcriptionally responsive genes, agreeing with previous data using other models. We show for the first time that hypoxia inducible changes in chromatin accessibility across the genome are predominantly HIF dependent, rapidly reversible upon reoxygenation and partially mimicked by HIF-α stabilisation independent of molecular dioxygenase inhibition. This work demonstrates that HIF is central to chromatin accessibility alterations in hypoxia, and has implications for our understanding of gene expression regulation by hypoxia and HIF.

Keywords: ATAC-seq; JmjC-histone demethylases; chromatin; hypoxia; hypoxia inducible factors; transcription.


Conflict of interest statement

The authors declare that there are no competing interests associated with the manuscript.

Figures

Figure 1.
Figure 1.. Chromatin accessibility changes in response to hypoxia.
(A) ATAC-seq (n = 2) in HeLa cells cultured at 21% oxygen, transfected with control siRNA and exposed to 0 h (control), 1 h and 24 h 1% oxygen (hypoxia (Hpx)). (B) Overlap of open chromatin regions (ORs). (C) Number of high stringency (log2 fold change >±0.58 and FDR <0.05) differentially open chromatin regions (DORs) and genes with DORs (DOR genes), and percentage relative to total ORs and OR genes. (D,E) Volcano plots for 1 h hypoxia vs control DOR analysis and 24 h hypoxia vs control DOR analysis, blue points indicate high stringency DORs. (F) Genomic location of DORs. (G) Metagene plots of ATAC-seq signal (RPKM) at the indicated regions.
Figure 2.
Figure 2.. Hypoxia inducible changes in open chromatin are enriched at hypoxia transcriptionally regulated genes.
(A) ATAC-seq (n = 2) and RNA-seq (n = 3) in HeLa cells cultured at 21% oxygen, transfected with control siRNA and exposed to 0 h (control), 1 h and 24 h 1% oxygen (hypoxia (Hpx)). (B) Gene signature analysis. (C) Overlap between genes with differentially open chromatin regions (DOR genes) and genes with differential RNA expression (DEG) in response to hypoxia. Statistical significance was determined via Fisher's exact test, *** P < 0.001. (D) Gene list ranked from high to low fold change in chromatin accessibility in response to 24 h hypoxia. Up-regulated DOR genes are coloured yellow, down-regulated DOR genes are coloured orange. Some hypoxia up-regulated DEG and DOR genes and down-regulated DEG and DOR genes are labelled. (E) GeneSet Enrichment Analysis between 24 h hypoxia up-regulated DOR genes and a list of genes ranked from high to low 24 h hypoxia RNA expression fold change. (F) Percentage of 24 h hypoxia up-regulated DORs at intergenic regions that are active enhancers and active enhancers linked to the promoters of genes with 24 h hypoxia up-regulated RNA expression. (G) Motif enrichment analysis, top 5 enriched motifs are displayed.
Figure 3.
Figure 3.. Hypoxia inducible changes in open chromatin are mainly sensitive to reoxygenation HIF dependent.
(A) ATAC-seq (n = 2) in HeLa cells cultured in 21% oxygen; transfected with control siRNA or HIF-1β siRNA, and exposed to 0 h (control), 1 h, 24 h 1% oxygen (hypoxia (Hpx)) and 24 h hypoxia followed by 1 h at 21% oxygen (reoxygenation (Reox)). (B) HIF-1β dependence of hypoxia differentially open chromatin regions (DORs), percentage of HIF-1β dependent DORs are labelled. (C) Reoxygenation sensitivity of 24 h hypoxia DORs, percentage of reoxygenation sensitive DORs are labelled. (D) Metagene plots of ATAC-seq signal (RPKM) at the indicated regions. (E) Coverage tracks of ATAC-seq signal at the CA9 promoter, SLC2A3 (protein name GLUT3) enhancer and NDRG1 enhancer.
Figure 4.
Figure 4.. Chromatin accessibility changes in response to HIF stabilisation via VH298.
(A) ATAC-seq (n = 2) in HeLa cells cultured at 21% oxygen and treated with DMSO (control) and 100 µM VH298 for 24 h. (B) Volcano plot for differentially open chromatin region (DOR) analysis, blue points indicate high stringency DORs. (C) Gene signature analysis. (D) Overlap between genes with differentially open chromatin regions (DOR genes) in response to VH298 and genes with differential RNA expression (RNA-seq (n = 3)) (DEGs) in response to hypoxia. Statistical significance was determined via Fisher's exact test *** P < 0.001. (E) Gene list ranked from high to low fold change in chromatin accessibility in response to VH298. Up-regulated DOR genes are coloured yellow, down-regulated DOR genes are coloured orange. Some up-regulated hypoxia DEG and VH298 DOR genes and down-regulated hypoxia DEG and VH298 DOR genes are labelled. (F) GeneSet Enrichment Analysis between VH298 up-regulated OR genes and a list of genes ranked from high to low 24 h hypoxia RNA expression fold change. (G) Percentage of VH298 up-regulated DORs at intergenic regions that are active enhancers and active enhancers linked to the promoters of genes with 24 h hypoxia up-regulated RNA expression. (H) Overlap of VH298 and 24 h hypoxia DORs. Statistical significance was determined via hypergeometric test *** P < 0.001.
Figure 5.
Figure 5.. Validation of accessibility changes.
(A) ATAC-qPCR analysis in HeLa cells cultured at 21% oxygen, transfected with control siRNA or HIF-1β siRNA, and exposed to 0 h (control), 24 h 1% oxygen (hypoxia (Hpx)) and 24 h hypoxia followed by 1 h at 21% oxygen (reoxygenation). (B) ATAC-qPCR analysis in HeLa cells cultured at 21% oxygen and treated with 24 h DMSO (control) and 24 h 100 µM VH298. (C) ATAC-qPCR analysis in A549 cells cultured at 21% oxygen with treated with 24 h DMSO (control), 24 h hypoxia and 24 h 100 µM VH298. Graphs show mean (n = 3) ± SEM, * P < 0.05, ** P < 0.01, *** P < 0.001. (A,C) Statistical significance was determined via one-way ANOVA with post-hoc Tukey test. (B) Statistical significance was determined via Student's t-test.
Figure 6.
Figure 6.. Mechanistic insight into hypoxia inducible changes in chromatin accessibility.
(AD) Overlap of differential open chromatin regions (DORs) identified by ATAC-seq (n = 2) with HIF subunit binding sites identified by ChIP-seq (n = 2) in HeLa cells. (A) Overlap of 24 h 1% oxygen (hypoxia (Hpx)) or 24 h, 100 µM VH298 DORs with of HIF subunit binding sites. Percentage of DORs containing a HIF binding site (HIF-1α, HIF-2α or HIF-1β) are displayed. (B) Overlap of 24 h hypoxia or VH298 up-regulated DORs with of HIF subunit binding sites. Percentage of promoter, gene body and intergenic DORs containing a HIF binding sites (HIF-1α, HIF-2α or HIF-1β) are displayed. (C) Overlap of both VH298 and 24 h hypoxia up-regulated DORs, 24 h hypoxia specific up-regulated DORs or VH298 specific up-regulated DORs with HIF subunit binding sites. Percentage of DORs containing a HIF binding site (HIF-1α, HIF2α or HIF1β) are displayed. (D) Overlap of HIF-1beta dependent/independent and reoxygenation sensitive/insensitive 24 h hypoxia up-regulated DORs with HIF subunit binding sites. Percentage of DORs containing a HIF binding site (HIF-1α, HIF-1β or HIF-2α) are displayed. (AD) Statistical significance was determined via hypergeometric test, ** P < 0.01, *** P < 0.001. (E) Metagene plot of control condition (0 h hypoxia) ATAC-seq signal (RPKM) at the indicated regions. (F) Box plot of H3K4me3 ChIP-seq (n = 2) signal (RPKM) in HeLa cells exposed to 0 h (control) and 6 h hypoxia at 24 h hypoxia up-regulated DORs (centre ±1 kb). Statistical significance was determined via Wilcoxon signed-rank test, *** P < 0.001. (G) ATAC-qPCR analysis in HeLa cells cultured at 21% oxygen, transfected with control or KDM5A siRNA, and exposed to 0 h (control) or 24 h hypoxia. Graphs show mean (n = 3) ± SEM, statistical significance was determined via one-way ANOVA with post-hoc Tukey test, * P < 0.05, ** P < 0.01, *** P < 0.001.

References

    1. Edgar, R., Domrachev, M. and Lash, A.E. (2002) Gene Expression Omnibus: NCBI gene expression and hybridization array data repository. Nucleic Acids Res. 30, 207–210 10.1093/nar/30.1.207 - DOI - PMC - PubMed
    1. Kaelin, Jr, W.G. and Ratcliffe, P.J. (2008) Oxygen sensing by metazoans: the central role of the HIF hydroxylase pathway. Mol. Cell 30, 393–402 10.1016/j.molcel.2008.04.009 - DOI - PubMed
    1. Lee, P., Chandel, N.S. and Simon, M.C. (2020) Cellular adaptation to hypoxia through hypoxia inducible factors and beyond. Nat. Rev. Mol. Cell Biol. 21, 268–283 10.1038/s41580-020-0227-y - DOI - PMC - PubMed
    1. Dengler, V.L., Galbraith, M. and Espinosa, J.M. (2014) Transcriptional regulation by hypoxia inducible factors. Crit. Rev. Biochem. Mol. Biol. 49, 1–15 10.3109/10409238.2013.838205 - DOI - PMC - PubMed
    1. Choudhry, H. and Harris, A.L. (2018) Advances in hypoxia-inducible factor biology. Cell Metab. 27, 281–298 10.1016/j.cmet.2017.10.005 - DOI - PubMed

Publication types

MeSH terms