. 2022 Apr 4;219(4):e20212032.
doi: 10.1084/jem.20212032. Epub 2022 Mar 8.

Functional vulnerability of liver macrophages to capsules defines virulence of blood-borne bacteria

Affiliations

Functional vulnerability of liver macrophages to capsules defines virulence of blood-borne bacteria

Haoran An et al. J Exp Med. .

Abstract

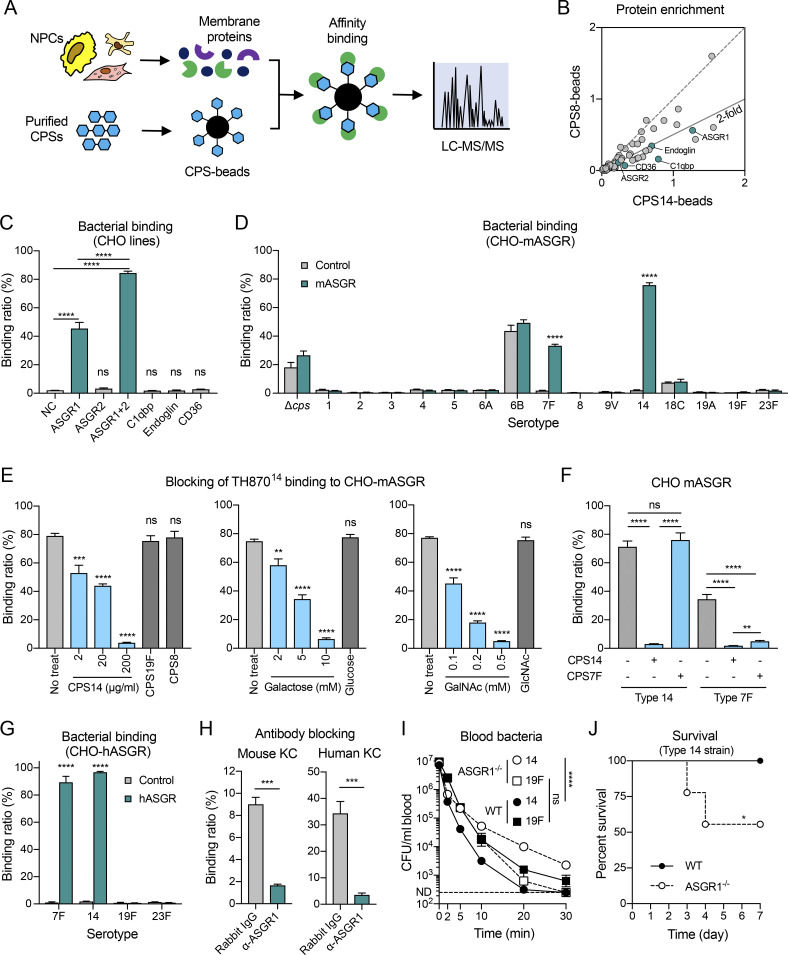
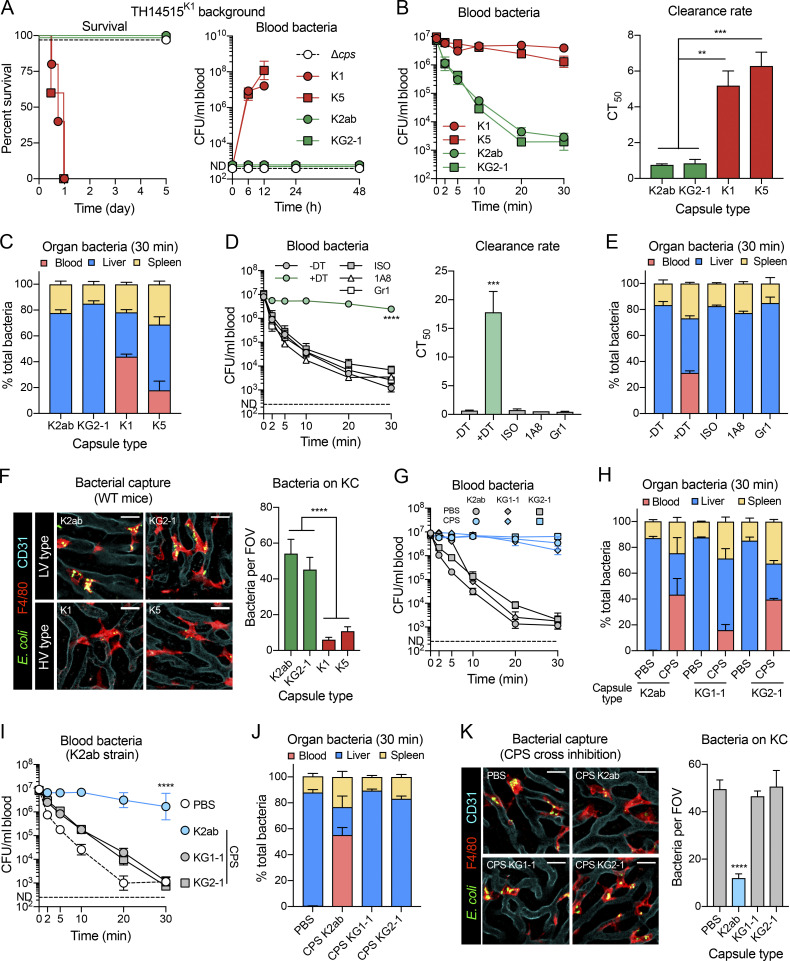
Many encapsulated bacteria use capsules to cause invasive diseases. However, it remains largely unknown how the capsules enhance bacterial virulence under in vivo infection conditions. Here we show that the capsules primarily target the liver to enhance bacterial survival at the onset of blood-borne infections. In a mouse sepsis model, the capsules enabled human pathogens Streptococcus pneumoniae and Escherichia coli to circumvent the recognition of liver-resident macrophage Kupffer cells (KCs) in a capsular serotype-dependent manner. In contrast to effective capture of acapsular bacteria by KCs, the encapsulated bacteria are partially (low-virulence types) or completely (high-virulence types) "untouchable" for KCs. We finally identified the asialoglycoprotein receptor (ASGR) as the first known capsule receptor on KCs to recognize the low-virulence serotype-7F and -14 pneumococcal capsules. Our data identify the molecular interplay between the capsules and KCs as a master controller of the fate and virulence of encapsulated bacteria, and suggest that the interplay is targetable for therapeutic control of septic infections.


Conflict of interest statement

Disclosures: M.R. Oggioni has a PhD student jointly with GSK Vaccines working on the pathogenesis of pneumonia (BBSRC grant BB/S507052/1). No other disclosures were reported.

Figures

None
Graphical abstract
Figure 1.
Figure 1.
Strain-to-strain variations in the virulence level of S. pneumoniae. (A) Schematic workflow of systemic assessment of the virulence levels of pneumococcal isolates in murine sepsis model. (B) Survival (left) and bacteremia (right) levels of CD1 mice infected i.p. with 104 CFU of representative HV (red line) and LV (green line) pneumococcal isolates. Serotype of each strain is denoted with superscript characters. n = 5–6. ND, not detected. (C) Bacteremia kinetics of the 48 HV (left) and 96 LV (right) strains 12 and 24 h after infection as in B. Each dot represents the mean value of five to nine mice for one strain. Lined dots indicate the values for the same strain at two time points. (D) Mean survival time of the mice infected with the same HV and LV strains as in B. Each dot represents the mean value for one strain. (E) Correlation between pneumococcal serotypes and mean survival times of mice infected as in B. The number of strains tested for each serotype is indicated at the right. All data were pooled from two independent experiments. Unpaired t test (D), ****, P < 0.0001.
Figure S1.
Figure S1.
Serotype-related variations in the virulence level of S. pneumoniae. (A) Survival (left) and bacteremia levels (right) of mice inoculated i.p. with 102 CFU of representative HV (D39, TIGR4, and TH870) strains. n = 5–7. (B) Survival (left) and bacteremia levels (right) of mice inoculated i.p. with 108 CFU of unencapsulated R6 and representative LV (G54, ST556, and TH2919) strains. n = 5–7. (C–E) Survival (left) and bacteremia (right) levels of mice were assessed by i.p. infection with 104 CFU of the isogenic capsule variants generated in serotype 6A strain TH197 (C), serotype 14 strain TH2912 (D), and serotype 3 strain TH2891 (E). n = 5–6. All mice were used on a CD1 background. Data were pooled from two independent experiments.
Figure 2.
Figure 2.
Causal relationship between capsule types and virulence phenotypes. (A) Schematic illustration of the capsule-switching scheme. The cps gene clusters of target (recipient) strains were first replaced with JC to produce unencapsulated mutants, which were then transformed with the cps gene amplicons of donor strains to yield capsule replacement strains. Selected HV (red symbols) and LV (green symbols) serotypes are indicated below. (B) The levels of survival (left) and bacteremia (right) of CD1 mice infected i.p. with 104 CFU of the isogenic capsule variants generated in serotype 6A strain TH8706A. n = 5–6. (C) Same as B except for using the isogenic variants of serotype 6B strain TH29196B. n = 5–6. (D) The differences in the sequence of wciP and CPS repeating unit between serotypes 6A and 6B. The polymorphic nucleotide and corresponding amino acid sequences of wciP and linkage between rhamnose and ribitol-5-phosphate in serotypes 6A and 6B are depicted. Glc, glucose; Gal, galactose; Rha, rhamnose; R-5-P, ribitol-5-phosphate. (E) Same as B except for using the isogenic strains with reciprocal single nucleotide polymorphism (SNP) switches in the TH8706A and TH29196B backgrounds. n = 5. (F and G) The levels of survival (F) and bacteremia (G) of CD1 mice after i.t. infection with 107 CFU of the isogenic strains. n = 5. All data were pooled from two independent experiments.
Figure 3.
Figure 3.
Impact of pneumococcal capsule on hepatic trapping. (A) Illustration of experimental detection of bacteria localization in CD1 mice after i.v. infection with 106 CFU of isogenic TH870 derivatives. (B) Bacteremia kinetics of WT or acapsular (Δcps) strain in the first 30 min of infection. n = 5. (C) Proportional distribution of WT and Δcps in the blood and organs at 5 min after infection. n = 3. (D) Bacterial load in the liver at 5 min. n = 3. (E) Bacteremia kinetics of HV (red) and LV (green) serotypes as in B. n = 5–6. (F) Proportional distribution of HV (red) and LV (blue) serotypes in the blood and organs at 5 min. n = 3. (G) Bacterial load in the liver at 5 min as in F. (H) Viable isogenic HV and LV pneumococci detected in the blood and five major organs of mice at 5 min after infection. n = 3. (I) Kinetics of viable HV (left) and LV (right) pneumococci in the liver of mice during the first 30 min of infection. n = 3–9. (J) Kinetics of viable pneumococci detected in the blood and organs in the first 30 min. The CFU values are presented as ratios of the corresponding inoculum sizes. n = 3–9. (K and L) Bacteremia kinetics (K) and proportional distribution (L) of serotype-8 and -14 pneumococci in SPX and SHM mice in the first 30 min of infection. n = 3–6. (M and N) Bacterial load (M) and proportional distribution (N) of serotype-8 and -14 pneumococci 12 h after i.t. instillation with 107 CFU. n = 3–6. Data were from one experiment (C, D, and F–H) or pooled from two independent experiments (B, E, and I–N). Unpaired t test (D), ordinary one-way ANOVA with Dunnett’s multiple comparisons test (G), ****, P < 0.0001.
Figure S2.
Figure S2.
Capsule-related capture of pneumococci by liver KCs. (A and B) Survival of mice after i.v. infection with 106 CFU of WT TH870 and acapsular mutant (A) or isogenic capsule-switched derivatives (B). n = 5–6. (C) Bacteremia kinetics in the mice during the first 72 h after i.v. infection. n = 5–6. (D) Proportional distribution of isogenic HV and LV pneumococci in blood, liver, and spleen 10 and 30 min after infection. n = 3. (E) Depletion efficiency of neutrophil and monocyte verified by flow cytometry. Mice were treated with 500 μg anti-Ly6G (1A8), 500 μg anti-Ly6C/Ly6G (Gr1), or the isotype controls (ISO). The ratios of neutrophils (Ly6Clow/SSChigh) and inflammatory monocytes (Ly6Chigh/SSClow) in the blood were measured in the myeloid populations (CD45+/CD11b+). n = 3. (F) Depletion efficiency of tissue-resident macrophage verified by flow cytometry. The Clec4f-DTR mice were treated with 10 ng/g DT. The populations of liver KC and spleen red pulp macrophage (RPM) were measured 24 h after DT treatment. Depletion efficiency was calculated by comparing the ratios of macrophages (CD11blow/F4/80+) in the immune cells (CD45+). n = 3. (G) 3D rendering of the liver sinusoid revealing bacterium-binding KCs 20 min after inoculation. (H) Clearance rates of LV isogenic derivatives of TH870 (type 14, 19F, and 23F) during the first 30 min after infection with 106 CFU in Clec4f-DTR mice treated with (+) or without (−) DT. n = 5–10. (I) Sustained bacteremia levels of LV strain TH87014 in the KC-depleted mice after i.v. infection with 108 CFU. n = 5. (J) In vitro binding of pneumococcal isogenic capsule variants to primary human KCs. n = 3. Mice were used on CD1 (A–D) or C57BL/6 (E–I) backgrounds. Data are representative results (D–G and J) or pooled (A–C, H, and I) from two independent experiments. Two-way ANOVA with Sidak’s multiple comparisons test (H), ordinary one-way ANOVA with Tukey’s multiple comparisons test (J), **, P < 0.01, ***, P < 0.001, ****, P < 0.0001.
Figure 4.
Figure 4.
Impact of capsular types on pneumococcal clearance rate in the bloodstream. (A–C) Bacteremia kinetics in the first 30 min (A), proportional distribution at 5 min (B), and bacterial viability at 30 min (C) after i.v. infection of CD1 mice with 108 CFU of acapular (Δcps) and serotype-14 derivatives of TH870 (Spn14). n = 3. (D–F) Bacteria in the bloodstream of CD1 mice infected i.v. with 103–107 CFU in the first 30 min. Data are presented as bacteremia kinetics of serotypes 14 (D) and 3 (E) or CT50 (F). n = 3–6. (G) Ranking of 15 pneumococcal serotypes based on the CT50 values of isogenic capsule-switched derivatives of TH870 in CD1 mice infected i.v. with 106 CFU. n = 5–6. CT50 was calculated by nonlinear regression of bacteremia data, which is presented as 30 min when >50 of the inoculum was still detectable in the circulation. Data were from one experiment (A–C) or pooled from two independent experiments (D–G). Two-way ANOVA with Tukey’s multiple comparisons test (A), unpaired t test (C), ***, P < 0.001, ****, P < 0.0001.
Figure 5.
Figure 5.
Capture of acapsular pneumococci by KCs. (A) Schematic depiction of experimental design to assess the contribution of major phagocytes to the hepatic clearance of acapsular bacteria. (B–E) Bacteremia kinetics (B), clearance rates during the first 30 min (C), proportional distribution at 10 min (D), and bacterial killing in 30 min (E) after i.v. infection of phagocyte-depleted mice with 106 CFU of Δcps. Clec4f-DTR mice were treated with (+DT) or without (−DT) 10 ng/g body weight of DT, and WT mice were treated with 500 μg of each antibody 24 h before i.v. infection. n = 3–5. (F and G) IVM detection of bacterium-binding KCs. Representative IVM images exemplify the KCs (red), pneumococci (green), and sinusoid endothelial cells (cyan) in the liver sinusoids of WT (F) and Clec4f-DTR (G) mice 10 min after i.v. infection with 5 × 10⁷ CFU of pneumococcal strains. n = 3. Five to 10 random fields of IVM images were quantified as bacteria per field of view (FOV) and presented at the right of the images. Scale bar, 20 μm. All mice were used on a C57BL/6 background. Data were representative results (F and G) or pooled (B–E) from two independent experiments. Two-way ANOVA with Tukey’s multiple comparisons test (B), ordinary one-way ANOVA with Tukey’s multiple comparisons test (C and E), *, P < 0.05, ****, P < 0.0001.
Figure 6.
Figure 6.
Capture of LV encapsulated pneumococci by KCs. (A) Representative IVM images of the liver sinusoids of mice (n = 3) 10 min after i.v. infection with 5 × 10⁷ CFU of isogenic TH870 derivatives producing the LV (type 14, 19F, and 23F) or HV (type 3, 6A, and 8) capsule variants (left). Scale bar, 20 μm. Bacterium-capture capacity of KCs are presented as KC-associated bacteria per FOV (right, n = 5–10 random fields). (B) IVM visualization of liver captured LV pneumococci in the KC-deficient mice (n = 3). Scale bar, 20 μm. Hepatic captured bacteria are quantified as numbers per FOV (right, n = 5–10 random fields). (C) Bacteremia kinetics of LV isogenic TH870 derivatives (type 14, 19F, and 23F) during the first 30 min after infection with 106 CFU in Clec4f-DTR mice were treated with (+) or without (−) DT. n = 5–10. (D) Proportional distribution of viable LV isogenic TH870 derivatives (type 14, 19F, and 23F) in the blood, liver, and spleen 10 min after infection in Clec4f-DTR mice pretreated with (+) or without (−) DT. n = 3–6. (E) Representative IVM images (left) showing the LV TH87014 outside (arrow) and inside (arrowhead) of KCs (blue) 20 min after i.v. inoculation of 108 CFU. Scale bar, 10 μm. Intracellular bacteria were detected by the activation of pH-sensitive dye pHrodo (red). The ratio of intra- and extracellular bacteria was quantified (right, n = 10 random fields). (F) Survival of KC-depleted mice after i.v. infection with 108 CFU of TH87014. n = 5. (G) Evasion of mouse KC capture by the HV capsule types of pneumococci. Freshly isolated primary KCs were used to test bacterial adherence with TH870 derivatives of representative LV (14, 19F, and 23F) and HV (3, 6A, and 8) capsule types. Bacterium-binding levels were calculated by dividing the KC-associated bacterial numbers to the total bacterial doses. n = 3. All mice were used in C57BL/6 background. Data were representative results (A, B, E, and G) or pooled (C, D, and F) from two independent experiments. Ordinary one-way ANOVA with Tukey’s multiple comparisons test (A), two-way ANOVA with Sidak’s (B and G) or Tukey’s (C) multiple comparisons test, log-rank test (F), **, P < 0.01, ****, P < 0.0001.
Figure 7.
Figure 7.
Serotype-specific inhibition of bacterial clearance by free CPSs. (A) Schematic illustration of CPS treatment. (B–D) Blockage of TH87014 clearance and hepatic capture with CPS14. Mice were treated i.v. with PBS or purified type 14 CPS 2 min before infection with TH87014 and used to assess bacterial clearance as in Fig. 3 E, hepatic capture as in Fig. 3 F, and bacterial killing as in Fig. 3 J. n = 3–6. (E) Inhibition of pneumococcal clearance by CPS of LV but not HV serotypes. Mice pretreated with 400 μg of CPSs were infected with homologous serotypes and assessed for bacterial load in the blood at 10 min as in B. n = 3–6. (F) Visualization of inhibitory effect of CPSs on KC capture of serotype-14, -19F, and -23F pneumococci in mice pretreated with 400 μg of CPSs as in Fig. 6 A. n = 2. (G–I) Serotype-specific blocking of pneumococcal clearance in mice pretreated with one of selected LV CPSs (400 μg/mouse) and infected with serotype-14 (G), -19F (H), or -23F (I) derivatives of TH870 as in B. n = 3–6. (J) Impact of C3 deficiency on the clearance of serotype-14, -19F, or -23F pneumococci. Pneumococcal clearance in WT and C3−/− mice were evaluated as in B. n = 5–6. (K) Impact of CRIg deficiency on the clearance of serotype-14, -19F, or -23F pneumococci in CRIg−/− mice. n = 5–6. CD1 (B–E and G–I) or C57BL/6 (F, J, and K) mice were used. The data were representative results (F) or pooled (B–E and G–K) from two independent experiments. Two-way ANOVA with Tukey’s (B, left panel, and G–J) or Sidak’s (E, F, and K) multiple comparisons test, Ordinary one-way ANOVA with Tukey’s multiple comparisons test (B, right panel, and D), * P < 0.05, **, P < 0.01, ***, P < 0.001, ****, P < 0.0001.
Figure S3.
Figure S3.
Serotype-specific inhibition of bacterial clearance by free CPSs. (A) Blocking effect of free CPS19F and CPS23F on the clearance of homologous serotypes of pneumococci were assessed as in Fig. 7 B. n = 6. (B) Impact of free LV CPSs on elimination of homologous serotypes of pneumococci during the first 30 min of infection. n = 3–6. (C) Impact of free CPS3, CPS6A, and CPS8 on the clearance of homologous serotype derivatives of TH870 was assessed as in A. n = 3–6. (D) Same as B except using HV CPSs. n = 3–6. (E) Survival of mice infected i.v. with 104–106 CFU of serotype-3 pneumococci. n = 5. (F) Impact of CPS3 on the clearance of sublethal dose (105 CFU) of serotype-3 pneumococci during the first 30 min of infection. n = 3. (G) Clearance rates of serotype-14 pneumococci in mice pretreated with one of the eight free CPSs (400 μg/mouse) before i.v. infection with 106 CFU. n = 3–6. (H) Clearance rates of serotype-19F pneumococci in mice pretreated with each type of free CPSs (400 μg/mouse) before i.v. infection with 106 CFU. n = 3–6. (I) Same as H except using serotype-23F pneumococci as an inoculum. n = 3–6. All mice were used on a CD1 background. Data were pooled from two independent experiments, except F (one experiment). Two-way ANOVA with Tukey’s (A, left and middle panels) and Sidak’s (A, right panel, B, and D) multiple comparisons test, Ordinary one-way ANOVA with Tukey’s multiple comparisons test (G–I), **, P < 0.01, ***, P < 0.001, ****, P < 0.0001.
Figure 8.
Figure 8.
ASGR-mediated KC capture of serotype-7F and -14 pneumococci. (A) Strategy for screening CPS14-binding proteins of mouse KCs. (B) Plot of membrane-associated proteins significantly enriched by CPS14 beads. Solid line represents the threshold of twofold enrichment by CPS14 compared with CPS8. The top five enriched proteins with potential ligand-binding activities are labeled. (C) TH87014 adhesion to CHO cells expressing mASGR and other CPS14-binding candidates is expressed as the percentage of adherent bacteria out of the input. n = 3. (D) Adhesion of 15 selected serotypes to CHO-mASGR cells was measured with the TH870 derivatives as in C. n = 3. (E) Blocking of mASGR-mediated TH87014 adhesion by CPS14 and known ASGR ligands (galactose or GalNAc). n = 3. (F) Cross-blocking of mASGR-mediated pneumococcal adherence by CPS7F and CPS14. n = 3. (G) TH87014 adhesion to CHO cells expressing hASGR was measured as in C. n = 3. (H) Blocking of mouse (left) and human (right) ASGR-mediated TH87014 adhesion by ASGR antibodies. The antibodies and isotype IgG were added at 5 μg/ml at the same time with bacteria. n = 3. (I) Clearance of TH87014 in ASGR1−/− mice infected i.v. with 107 CFU. This dose was used because the mice showed no deficiency in TH87014 clearance at 106 CFU. n = 3–6. (J) Survival of ASGR1−/− mice after i.v. infection with 108 CFU of TH87014. n = 9. All experiments were performed with C57BL/6 mice. Data were representative (C–H) or pooled (B, I, and J) results from two to three independent experiments. Ordinary one-way ANOVA with Tukey’s (C, E, and F) multiple comparisons test, two-way ANOVA with Sidak’s (D and G) or Tukey’s (I) multiple comparisons test, unpaired t test (H), log-rank test (J), * P < 0.05, **, P < 0.01, ***, P < 0.001, ****, P < 0.0001.
Figure S4.
Figure S4.
ASGR-mediated KC capture of serotype-7F and -14 pneumococci. (A) Dose-dependent blocking of mASGR-mediated TH8707F adherence by free CPS7F, galactose, or GalNAc. n = 3. (B) Alignment of the C-type lectin domains of human and mouse ASGR1. (C) Same as A except using hASGR-transfected CHO cells and serotype-14 pneumococci. n = 3. (D) Same as C except using serotype-7F pneumococci. n = 3. (E) Impact of mASGR on adherence to CHO cells by natural pneumococcal strains with terminal galactose in the CPSs. Bacterial adherence was quantified as in Fig. 7 D. n = 3. (F) Same as E except using hASGR-transfected cells. n = 3. (G) The disaccharide structures of endogenous ASGR ligands and the known terminal galactose-containing capsules in S. pneumoniae. Only CPS14 has the identical signature with the native ligand core structure Galβ1,4GlcNAc. (H) Effect of centrifugation on receptor-mediated bacterial adhesion to host cells. Isogenic serotype-14 or -19F pneumococci were suspended in F-12K medium to a density of 106 CFU/ml; 50 μl of bacterial suspension was added to the monolayers of ASGR-expressing CHO cells in 96-well plates; mild centrifugation (500 g for 5 min) was applied immediately after bacterial suspensions were added to cell monolayers to mimic the sheer force that blood-borne bacteria experience in the blood circulation. n = 3. All data were representative results from two to three independent experiments. Ordinary one-way ANOVA with Tukey’s multiple comparisons test (A, C, and D), two-way ANOVA with Sidak’s multiple comparisons test (E, F, and H), *, P < 0.05, ***, P < 0.001, ****, P < 0.0001.
Figure S5.
Figure S5.
Capsule type–dependent evasion of hepatic clearance of invasive E. coli. (A and B) Survival (A) and bacteremia (B) levels of mice infected i.p. with 107 CFU of representative HV (red line) and LV (green line) invasive E. coli isolates. Capsular type of each strain is denoted with superscript characters. n = 5. (C) Schematic illustration of the experimental procedures for genetic switching of the cps genes in E. coli. The original cps locus of the host strain was deleted by Cas9-mediated genome editing with the cps gene-targeting guide RNA, followed by DNA repair through homologous recombination with the 1.5 kb up- and downstream arms of the cps locus. The recipient cps genes were introduced into the cps-negative host mutant through another cycle of Cas9-mediated genome editing and repair. See Materials and methods for more details. (D and E) Bacteremia kinetics (D) and proportional distribution (E) of isogenic E. coli strains in SPX mice during the first 30 min after infection. n = 3. (F) Clearance rates of LV E. coli strains in the presence of free homologous CPSs (400 μg) before i.v. infection with 107 CFU. n = 3–5. (G) Bacteremia kinetics of HV K1 (left) and K5 (right) E. coli in the presence of corresponding CPSs during the first 30 min after infection. n = 3. (H) Clearance rates of LV K2ab E. coli in mice pretreated with each type of free CPSs (400 μg) before i.v. infection with 107 CFU. n = 3–5. (I and J) Bacteremia kinetics of LV isogenic E. coli in C3−/− (I) and CRIg−/− (J) mice during the first 30 min after infection. n = 3. All mice were used in C57BL/6 background. Data were from one experiment (D, E, G, I, and J) or pooled (A, B, F, and H) from two independent experiments. Two-way ANOVA with Sidak’s (F) or Tukey’s (I and J) multiple comparisons test, Ordinary one-way ANOVA with Tukey’s multiple comparisons test (H), ****, P < 0.0001.
Figure 9.
Figure 9.
Capsule type-dependent evasion of hepatic clearance of invasive E. coli. (A) Capsule type-dependent virulence of invasive E. coli isolates. Survival (left) and bacteremia (right) levels of mice i.p. infected with 107 CFU of unencapsulated mutant (Δcps), representative HV (K1 and K5), and LV (K2ab and KG2-1) isogenic E. coli in type K1 TH14515 background. n = 5. (B) Capsule type-dependent clearance of isogenic E. coli strains in the blood. Bacteremia kinetics (left) and calculated clearance rate (right) were measured during the first 30 min after i.v. infection with 107 CFU of isogenic E. coli. n = 3–6. (C) Proportional distribution of isogenic E. coli strains in the blood, liver, and spleen of mice in the first 30 min after infection as in B. n = 3–6. (D) Importance of KC, monocytes, and neutrophils in early clearance of LV type K2ab E. coli. Mice were treated for specific depletion as in Fig. 5 B before i.v. infection with 107 CFU of TH15511K2ab and bled for enumeration of viable bacteria in the blood (left). The clearance rates (right) were calculated as in Fig. 4 F. n = 3–5. (E) Proportional distribution of E. coli TH15511K2ab in the blood, liver, and spleen of mice in the first 30 min after infection. n = 3–5. (F) Capsule type-dependent evasion of KC capture by E. coli. Representative IVM images (left) of the liver sinusoids in the mice infected i.v. with 5 × 10⁷ CFU of FITC-labeled isogenic E. coli strains (n = 2). The imaging data were quantified in the right panel (n = 5–10 random fields). Scale bar, 20 μm. (G) Inhibition of free CPSs to the early clearance of the homologous LV E. coli strains. Bacterial load in the blood were measured in the mice pretreated with control PBS or 400 μg of each CPS 2 min before i.v. infection with 107 CFU of LV bacteria. n = 3–5. (H) Proportional distribution of E. coli in the blood, liver, and spleen of mice in the first 30 min after infection as in G. n = 3–5. (I) Cross-inhibition of E. coli capsules to the early clearance of heterologous strains. Bacterial load in the blood was measured in the mice pretreated with 400 μg of each CPS 2 min before i.v. infection with 107 CFU of E. coli TH15511K2ab. n = 3. (J) Proportional distribution of E. coli in the blood, liver, and spleen of mice in the first 30 min after infection as in I. n = 3. (K) Visualization of inhibitory effect of LV CPSs on KC capture of E. coli. Representative IVM images (left) display significantly reduced LV E. coli captured by KCs after administration with homologous but not heterologous CPSs (n = 2). The imaging data were quantified in the right panel (n = 5–10 random fields). Scale bar, 20 μm. All mice were used in C57BL/6 background. Data were representative results (F and K) or pooled (A–E and G–J) from two independent experiments. Ordinary one-way ANOVA with Dunnett’s (B and F) or Tukey’s (D, right panel, and K) multiple comparisons test, two-way ANOVA with Tukey’s multiple comparisons test (D, left panel, and I), **, P < 0.01, ***, P < 0.001, ****, P < 0.0001.

Similar articles

Cited by

References

    1. Aoyagi, Y., Adderson E.E., Min J.G., Matsushita M., Fujita T., Takahashi S., Okuwaki Y., and Bohnsack J.F.. 2005. Role of L-ficolin/mannose-binding lectin-associated serine protease complexes in the opsonophagocytosis of type III group B streptococci. J. Immunol. 174:418–425. 10.4049/jimmunol.174.1.418 - DOI - PubMed
    1. Aoyagi, Y., Adderson E.E., Rubens C.E., Bohnsack J.F., Min J.G., Matsushita M., Fujita T., Okuwaki Y., and Takahashi S.. 2008. L-Ficolin/Mannose-binding lectin-associated serine protease complexes bind to group B streptococci primarily through N-acetylneuraminic acid of capsular polysaccharide and activate the complement pathway. Infect. Immun. 76:179–188. 10.1128/IAI.00837-07 - DOI - PMC - PubMed
    1. Arshad, M., Goller C.C., Pilla D., Schoenen F.J., and Seed P.C.. 2016. Threading the needle: Small-molecule targeting of a xenobiotic receptor to ablate Escherichia coli polysaccharide capsule expression without altering antibiotic resistance. J. Infect. Dis. 213:1330–1339. 10.1093/infdis/jiv584 - DOI - PMC - PubMed
    1. Ashare, A., Stanford C., Hancock P., Stark D., Lilli K., Birrer E., Nymon A., Doerschug K.C., and Hunninghake G.W.. 2009. Chronic liver disease impairs bacterial clearance in a human model of induced bacteremia. Clin. Transl. Sci. 2:199–205. 10.1111/j.1752-8062.2009.00122.x - DOI - PMC - PubMed
    1. Avery, O.T., Macleod C.M., McCarty M., and Peltier L. 2000. Studies on the chemical nature of the substance inducing transformation of pneumococcal types: Induction of transformation by a desoxyribonucleic acid fraction isolated from pneumococcus type III. J. Exp. Med. 79:137–158. 10.1097/00003086-200010001-00002 - DOI - PMC - PubMed

Publication types