. 2022 May 24;34(6):2174-2187.
doi: 10.1093/plcell/koac079.

Genome-wide cis-decoding for expression design in tomato using cistrome data and explainable deep learning

Affiliations

Genome-wide cis-decoding for expression design in tomato using cistrome data and explainable deep learning

Takashi Akagi et al. Plant Cell. .

Abstract

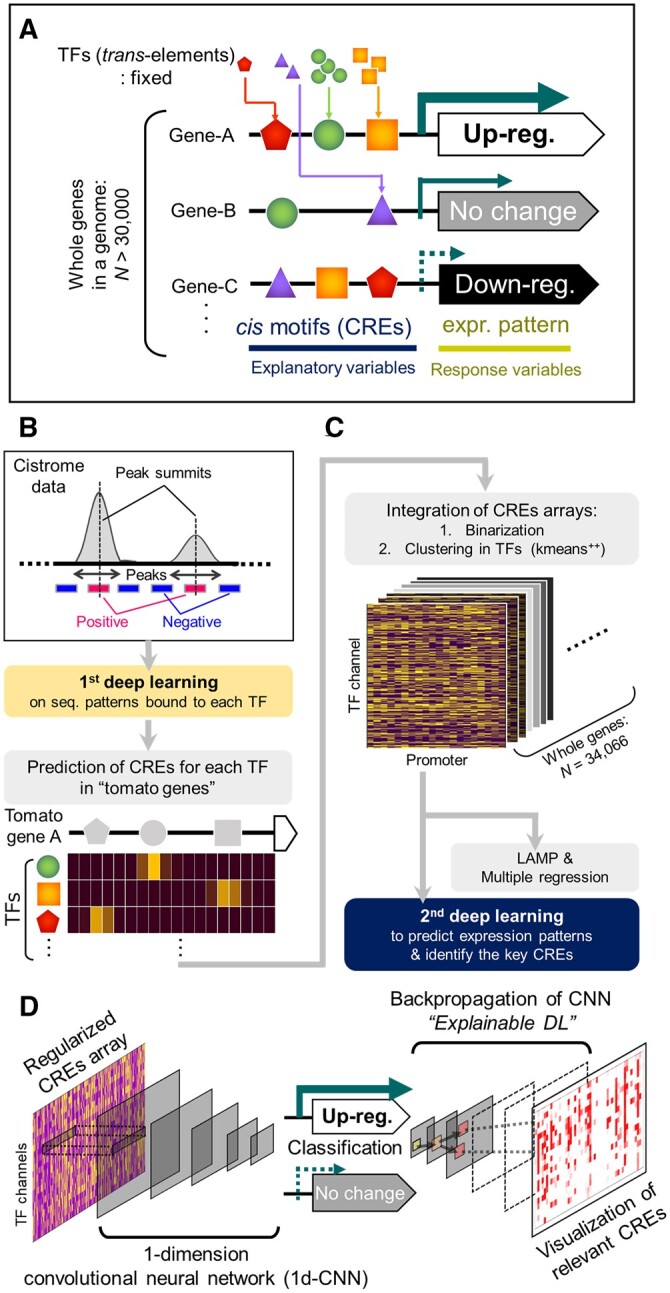
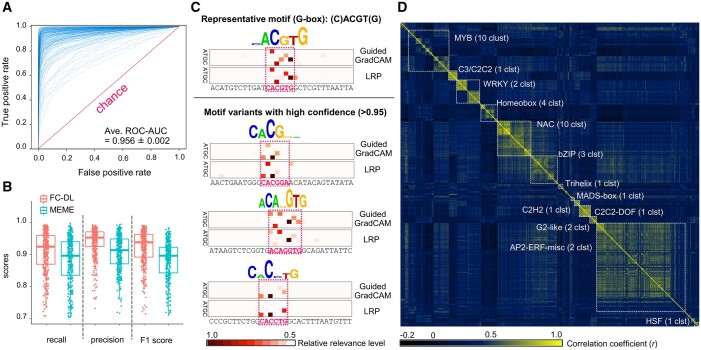
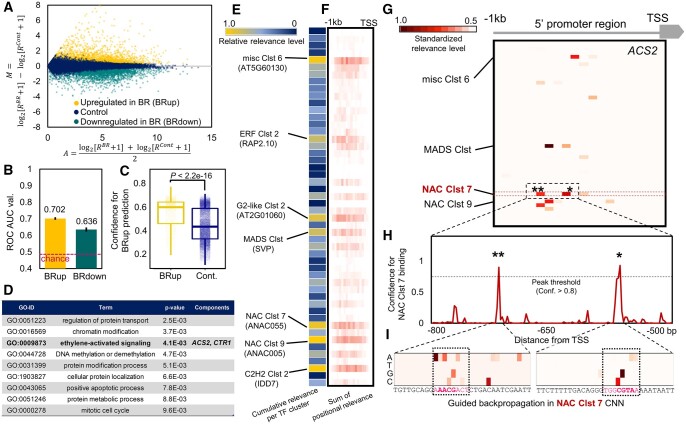
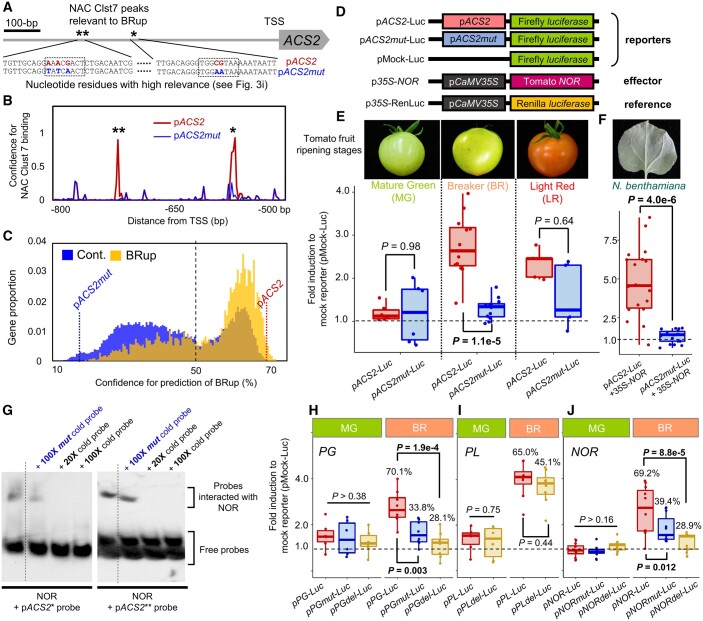
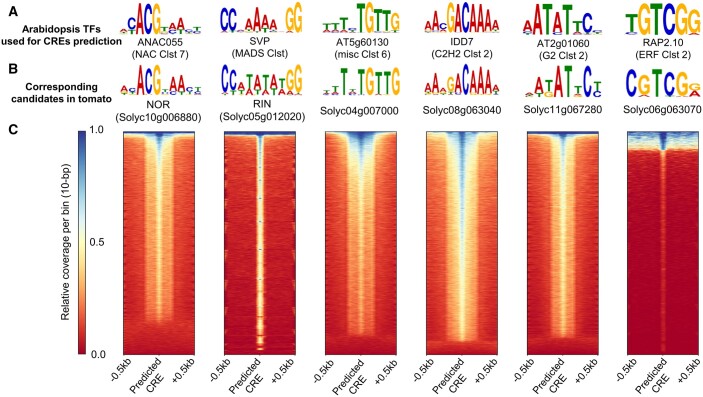
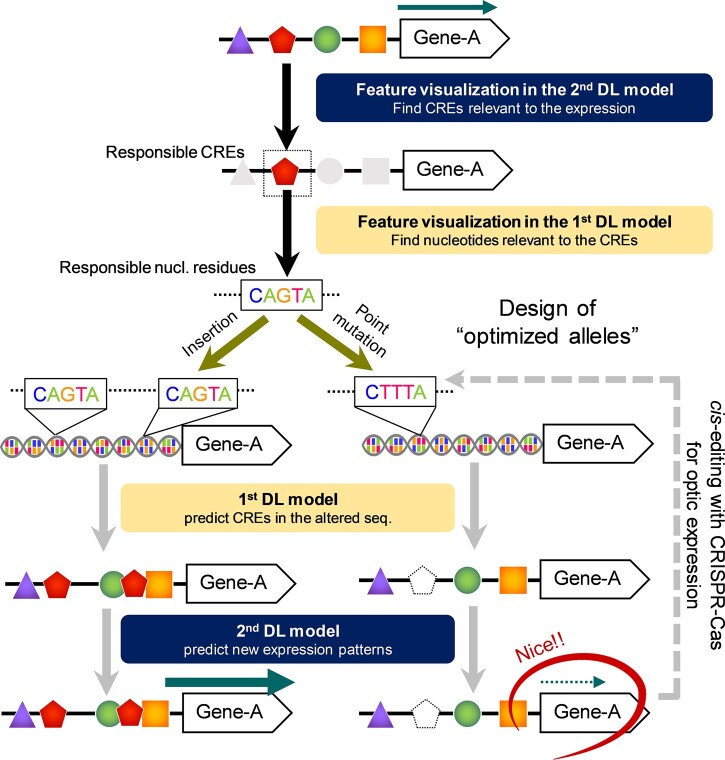
In the evolutionary history of plants, variation in cis-regulatory elements (CREs) resulting in diversification of gene expression has played a central role in driving the evolution of lineage-specific traits. However, it is difficult to predict expression behaviors from CRE patterns to properly harness them, mainly because the biological processes are complex. In this study, we used cistrome datasets and explainable convolutional neural network (CNN) frameworks to predict genome-wide expression patterns in tomato (Solanum lycopersicum) fruit from the DNA sequences in gene regulatory regions. By fixing the effects of trans-acting factors using single cell-type spatiotemporal transcriptome data for the response variables, we developed a prediction model for crucial expression patterns in the initiation of tomato fruit ripening. Feature visualization of the CNNs identified nucleotide residues critical to the objective expression pattern in each gene, and their effects were validated experimentally in ripening tomato fruit. This cis-decoding framework will not only contribute to the understanding of the regulatory networks derived from CREs and transcription factor interactions, but also provides a flexible means of designing alleles for optimized expression.


Figures

Figure 1
Figure 1
Prediction of gene expression patterns in a genome from CREs. A, Schematic model for the prediction of expression patterns among all genes in a genome. In a homogeneous cell line, the effects from trans-acting factors can be fixed among the genes. Then, expression patterns can be explained from flexible combinations of CREs (and potential epigenetic marks). B and C, Construction of the prediction model with two-step DL frameworks. Large Arabidopsis cistrome datasets (O’Malley et al., 2016), which provide genome-wide TF-binding peaks, were used in the first step (first DL) to predict CRE patterns for each TF. The resultant model was applied to the tomato genome sequences to predict CREs in the promoters of all genes to derive CRE arrays. For each gene, the CRE array was annotated with an expression pattern that was applied to the second step (second DL) and used for multiple regression and LAMP analyses (Terada et al., 2013). D, In the second DL step, the CRE arrays were trained with a 1D CNN with the clustered TF channels to generate a binary classification. With backpropagation of the CNN (explainable DL), the CREs or other nucleotide residues relevant to the objective expression class were visualized.
Figure 2
Figure 2
High-confidence prediction of variable CREs and key nucleotide residues by DL. A, ROC curves for binary classification of TF-binding and control sequences for 370 TFs. The AUC values ranged from 0.708 to 0.998 (average 0.956). B, Prediction performance of the FC-DL model and MEME (as used in O’Malley et al., 2016). C, Nucleotide residues relevant to prediction of CREs by the DL model, determined using two distinct feature visualization methods, Guided GradCAM and LRP. Relevance levels in the putative CREs (in the PK dotted squares) are reflected in the height of the nucleotide logos. ABF2-binding sequence tiles with high confidence (>0.95) for the prediction are represented. The prediction model properly highlighted the residues consistent with the physiologically validated representative motif (C)ACGT(G), which is a bZIP-binding G-box core motif (Jakoby et al., 2002). Furthermore, the same model detected motif variants, including minor gaps or substitutions. D, Correlation matrix for the CREs of the 370 TFs, with clustering by K-means++ (K = 50). Each cluster was constituted mostly of TFs from the same family (see Supplemental Table S5 for details).
Figure 3
Figure 3
Prediction of the gene expression patterns critical to tomato fruit ripening initiation by DL, and visualization of their key cis-elements. A, MA plot for the genes expressed in the MG and BR stages of ripening tomato fruit. Genes significantly upregulated in BR (N = 2,967, defined as “BRup”) and downregulated in BR (N = 3,098, defined as “BRdown”) are shown in orange and dark green, respectively. B, Performance (ROC–AUC values) for binary classification of BRup or BRdown against the control category. Averaged ROC–AUC values were calculated from four-fold cross-validations. Bars indicate the standard error (SE). C, Confidence distribution (or histogram of confidence in the DL output) for BRup prediction. Actual BRup genes exhibited substantially higher confidences than in the control genes (P < 2.2e-16). D, GO terms significantly enriched in the genes with the highest 10% confidence in the BRup category. E, Predicted cumulative relevance levels, which were calculated by summarizing the standardized relevance of each TF cluster over the 297 genes with the highest 10% confidence in the BRup category. Of the 50 channels recognized by each TF cluster, the seven with high relative relevance levels (>0.7) are highlighted. The central TF for each cluster is in parenthesis. F, Sum of the positional relevance for each TF cluster across the 297 genes. G–I, Identification of the CREs responsible for BRup in the promoter region of ACS2. With guided backpropagation on the model for BRup prediction, four channels showed high relevance levels (G). NAC Clst 7, the channel with the highest cumulative relevance level, showed two major relevant bins that corresponded to the high-confidence TF-binding regions (standardized relevance level >0.7), as indicated by single and double asterisks (H). With further guided backpropagation on the model for CRE prediction from the promoter sequences tiles (the first DL step, see Figure 1B), the nucleotide residues responsible for the two TF-binding regions were detected (i). The most relevant residues were localized on the hypothetical NAC-binding motifs indicated by dotted squares.
Figure 4
Figure 4
Experimental validation for cis-decoding by DL. A, Point-mutations were artificially induced on the residues with high relevance to DL prediction (see Figure 3I) in the 1-kb promoter of ACS2 (pACS2), generating the mutated allele pACS2mut. B and C, pACS2mut showed a substantial reduction in confidence for NAC Clst 7 binding prediction (B) and for BRup prediction (Conf. = 69% for pACS2, and 18% for pACS2mut) (C). D, Constructs for transient reporter assays. E, Dual-Luc transient reporter assay in ripening tomato fruit. In the MG stage, pACS2 and pACS2mut showed no significant differences (P = 0.98) and only slight activation compared with that of the mock reporter. In the BR stage, pACS2 showed stronger activation than in the MG stage, whereas ACS2mut was substantially less activated (P = 1.1e-5, Student’s t test). In the LR stage, both pACS2 and pACS2mut were activated in comparison to the mock, but showed no statistical differences (P = 0.64). F, Transient reporter assay with N. benthamiana for activation of pACS2 and pACS2mut alleles by a critical tomato ripening gene, NOR, nested in NAC Clst 7. Constitutive expression of tomato NOR could induce pACS2 activation, whereas pACS2mut was not substantially activated (P = 4.0e-6, Student’s t test). G, EMSA to test the ability of NOR to recognize the high-relevance residues in the two putatively NAC Clst 7-binding tiles in pACS2 (single and double asterisks in A). In both tiles, control cold probes properly competed with the labeled probes, whereas cold probes from the mutated alleles in pACS2mut exhibited no reduction in binding signals. H–J, Dual-Luc transient reporter assay to test the effects of high-relevance residues in pPG (H), pPL (I), and pNOR (J), in the tomato pericarp at the MG and BR stages. Artificial point-mutations (pPGmut and pNORmut, in blue) or deletions (pPGdel, pPLdel, and pNORdel, in gold) targeting the residues relevant to MYB Clst 9 (for pPG), misc Clst 2 (for pPL), and NAC Clst 1 (for pNOR) CREs are given in Supplemental Figure S11. The confidence for BRup prediction with each control, point-mutated, and deleted promoters are presented in box plots (and in Supplemental Figure S11). Except for pPLdel, all artificially mutated alleles showed significantly less activation than with the control promoters, in a BR stage-specific manner (P < 0.01, Student’s t test).
Figure 5
Figure 5
Consistency between the DL-predicting CREs and the binding sites of tomato TFs. We selected six tomato TFs (NOR, RIN, Solyc04g007000, Solyc08g063040, Solyc11g067280, and Solyc06g063070), which were the orthologs of the genes in NAC Clst 7, MADS Clst, misc Clst 6, C2H2 Clst 2, G2 Clst 2, and ERF Clst 2, respectively. A, Representative enriched motifs in the Arabidopsis DAP-Seq peaks (O’Malley et al., 2016) for the six TFs with the highest cumulative relevance to the genes significantly upregulated in the BR stage (see Figure 3E). B, The most probable enriched motifs in the DAP-Seq peaks for the described six tomato TFs, which exhibited similar sequence patterns to the corresponding Arabidopsis orthologs. C, Heatmaps for the relative read coverages surrounding the CREs predicted by each DL model. For all of the six TFs, most predicted CREs were enriched with DAP-seq reads, indicating TF binding.
Figure 6
Figure 6
Model for expression design based on explainable DL. If the objective expression patterns can be well predicted from CRE arrays, two-step feature visualization in the prediction models (or the second and then first DL models, see Figure 1B) will allow identification of the nucleotide-scale factor(s) responsible for the expression pattern. Randomization of the responsible residues can derive potentially unlimited variations for the objective expression pattern, which can be easily predicted using the first and second DL models. Once a desirable expression pattern is predicted, cis-editing with the CRISPR–Cas system may realize the design of the optimized allele.

Comment in

References

    1. Akagi T, Ikegami A, Tsujimoto T, Kobayashi S, Sato A, Kono A, Yonemori K (2009) DkMyb4 is a Myb transcription factor involved in proanthocyanidin biosynthesis in persimmon fruit. Plant Physiol 151: 2028–2045 - PMC - PubMed
    1. Akagi T, Onishi M, Masuda K, Kuroki R, Baba K, Takeshita K, Suzuki T, Niikawa T, Uchida S, Ise T (2020) Explainable deep learning reproduces a ‘professional eye’ on the diagnosis of internal disorders in persimmon fruit. Plant Cell Physiol 61: 1967–1973 - PubMed
    1. Alber M, Lapuschkin S, Seegerer P, Hägele M, Schütt KT, Montavon G, Samek W, Müller KR, Dähne S, Kindermans PJ (2019) iNNvestigate neural networks! J Mach Learn Res 20: 1–8
    1. Alipanahi B, Delong A, Weirauch MT, Frey BJ (2015) Predicting the sequence specificities of DNA-and RNA-binding proteins by deep learning. Nat Biotechnol 33: 831–838 - PubMed
    1. Alonge M, Wang X, Benoit M, Soyk S, Pereira L, Zhang L, Suresh H, Ramakrishnan S, Maumus F, Ciren D, Levy Y, et al. (2020) Major impacts of widespread structural variation on gene expression and crop improvement in tomato. Cell 182: 145–161 - PMC - PubMed

Publication types

MeSH terms