. 2022 Mar 8;117(1):11.
doi: 10.1007/s00395-022-00913-y.

Uncovering the molecular identity of cardiosphere-derived cells (CDCs) by single-cell RNA sequencing

Affiliations

Uncovering the molecular identity of cardiosphere-derived cells (CDCs) by single-cell RNA sequencing

Palgit-S Kogan et al. Basic Res Cardiol. .

Abstract

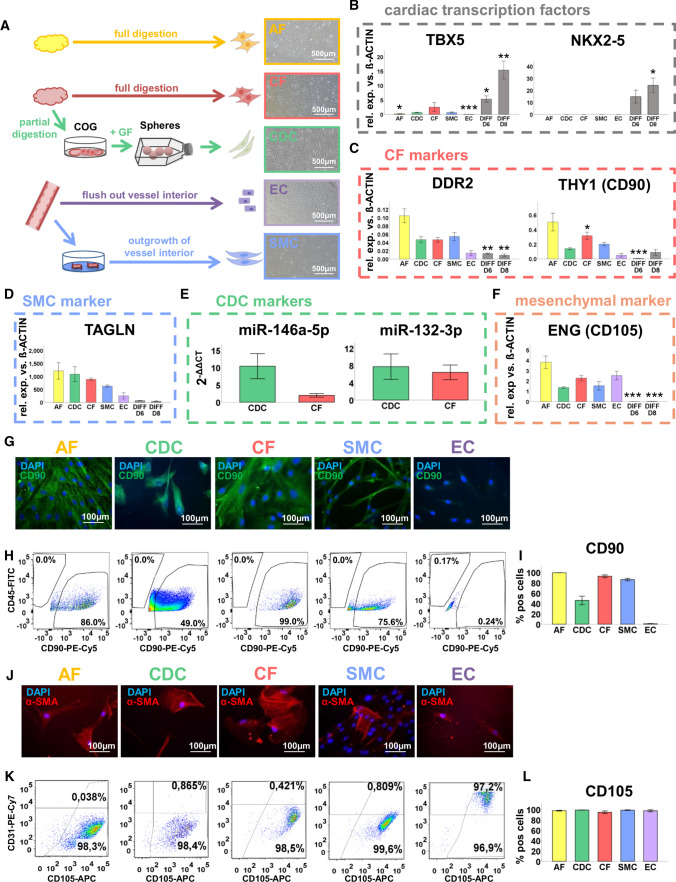
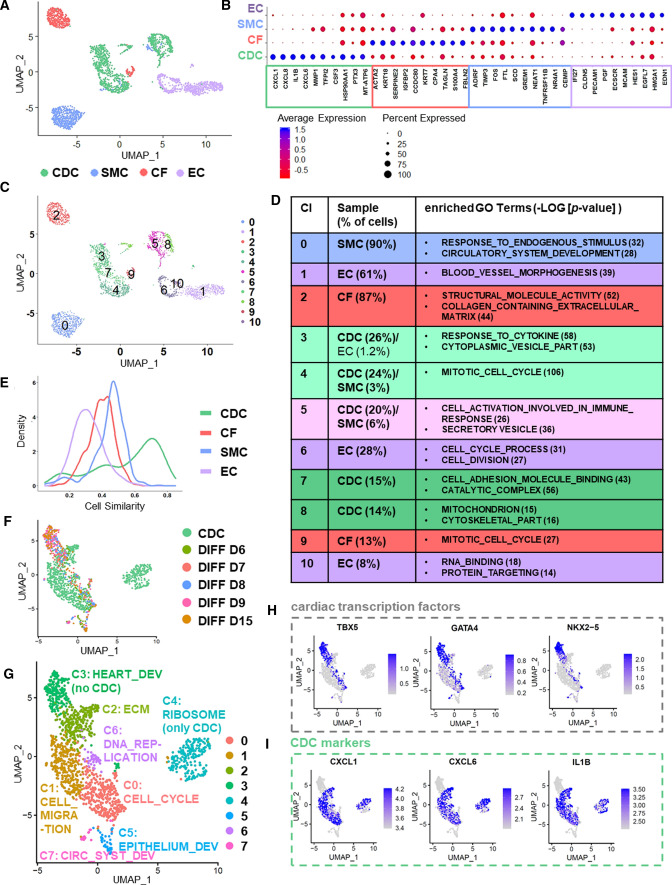
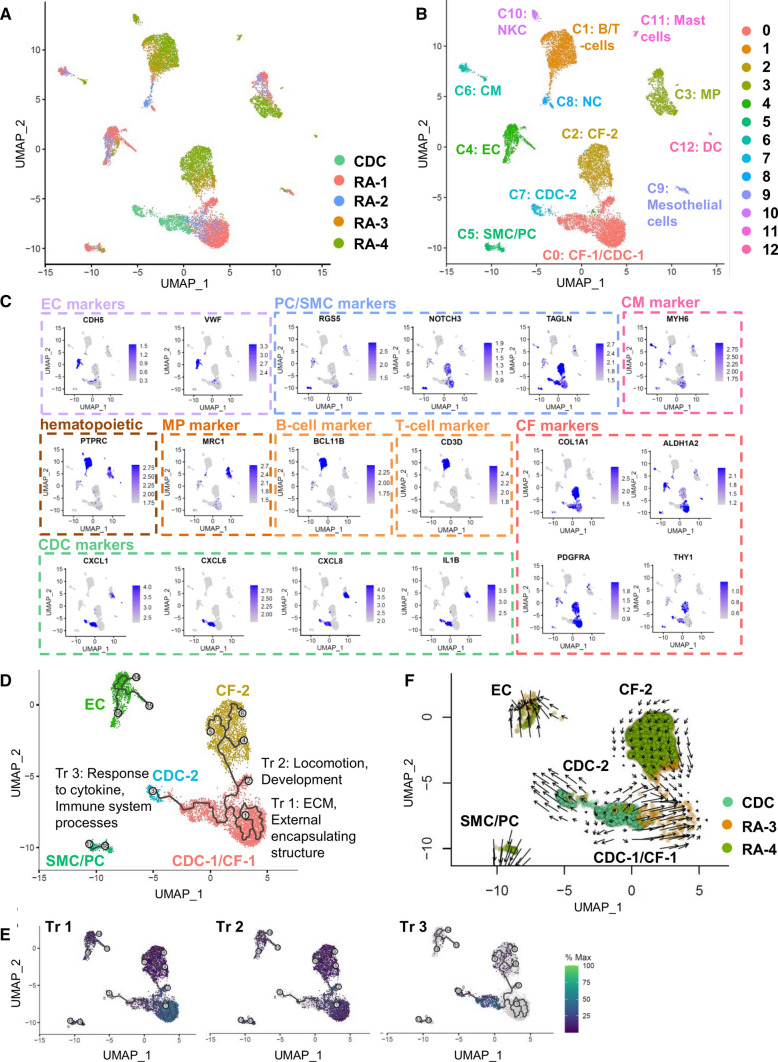
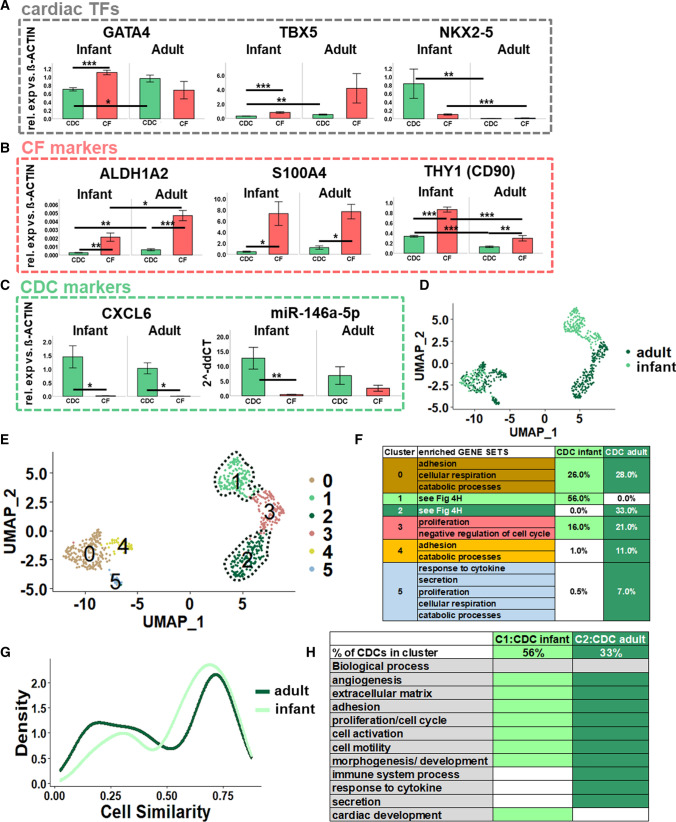
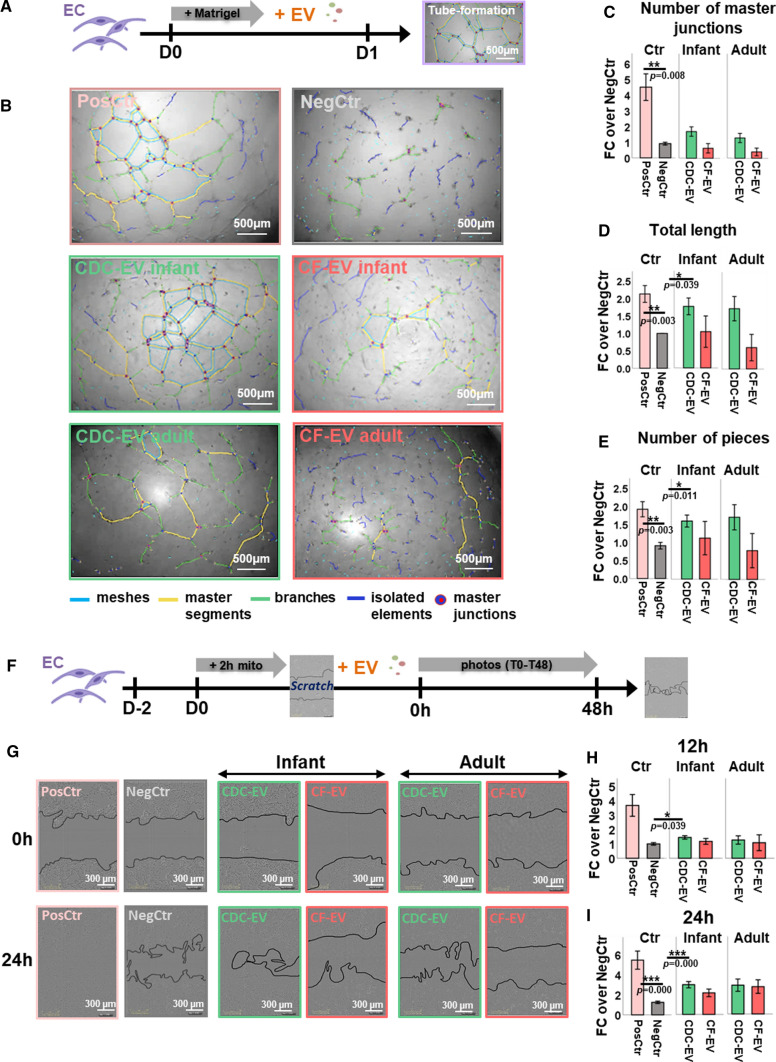
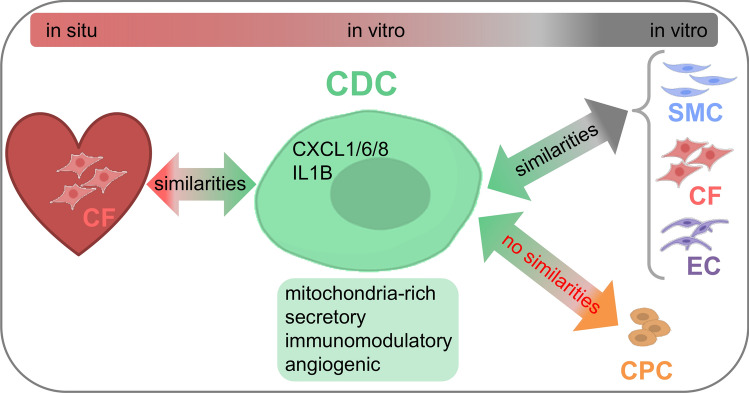
Cardiosphere-derived cells (CDCs) generated from human cardiac biopsies have been shown to have disease-modifying bioactivity in clinical trials. Paradoxically, CDCs' cellular origin in the heart remains elusive. We studied the molecular identity of CDCs using single-cell RNA sequencing (sc-RNAseq) in comparison to cardiac non-myocyte and non-hematopoietic cells (cardiac fibroblasts/CFs, smooth muscle cells/SMCs and endothelial cells/ECs). We identified CDCs as a distinct and mitochondria-rich cell type that shared biological similarities with non-myocyte cells but not with cardiac progenitor cells derived from human-induced pluripotent stem cells. CXCL6 emerged as a new specific marker for CDCs. By analysis of sc-RNAseq data from human right atrial biopsies in comparison with CDCs we uncovered transcriptomic similarities between CDCs and CFs. By direct comparison of infant and adult CDC sc-RNAseq data, infant CDCs revealed GO-terms associated with cardiac development. To analyze the beneficial effects of CDCs (pro-angiogenic, anti-fibrotic, anti-apoptotic), we performed functional in vitro assays with CDC-derived extracellular vesicles (EVs). CDC EVs augmented in vitro angiogenesis and did not stimulate scarring. They also reduced the expression of pro-apoptotic Bax in NRCMs. In conclusion, CDCs were disclosed as mitochondria-rich cells with unique properties but also with similarities to right atrial CFs. CDCs displayed highly proliferative, secretory and immunomodulatory properties, characteristics that can also be found in activated or inflammatory cell types. By special culture conditions, CDCs earn some bioactivities, including angiogenic potential, which might modify disease in certain disorders.

Keywords: Cardiac fibroblasts; Cardiac non-myocyte cells; Cardiosphere-derived cells (CDCs); Extracellular vesicles; Right atrial biopsy; Single-cell RNA sequencing.


Conflict of interest statement

The authors declare no potential conflict of interest.

Figures

Fig. 1
Fig. 1
Characterization of adult CDCs compared to other primary non-myocyte cell types. A Generation of adipose tissue-derived fibroblasts (AF), cardiac fibroblasts (CF), cardiosphere-derived cells (CDC), endothelial cells (EC) and smooth muscle cells (SMC). Abbreviations: COG, cardiac outgrowth; GF, growth factors. B–F Gene expression analysis of CDCs compared to primary cells and human-induced pluripotent stem cell-derived cardiac progenitor cells from day 6 (DIFF D6) and immature cardiomyocytes from day 8 of cardiac differentiation (DIFF D8) (only significant differences against CDCs are depicted). Relative RNA expression versus β-ACTIN is illustrated for B cardiac transcription factors TBX5 and NKX2-5, C CF markers DDR2 and THY1 (CD90), D SMC marker TAGLN, E CDC-typical microRNAs miR-146a-5p and miR-132-3p, and F mesenchymal marker ENG (CD105). G Immunocytochemical (ICC) staining against CD90 showed ubiquitous CD90 expression in AFs, CDCs, CFs and SMCs but not in ECs. H–I Flow cytometry analysis with CD90 antibodies (conjugated with PE-Cy5) confirmed ICC results but only 40–60% of CDCs expressed CD90. H Exemplary dot plots and I percentage of CD90-positive cells. J ICC staining against SMC marker α-smooth muscle actin (α-SMA) revealed ubiquitous expression in AFs, CDCs, CFs and SMCs and to a lower extent also in ECs. K-L Flow cytometry analysis with CD105 antibodies (conjugated with APC) depicted ubiquitous CD105 expression in AFs, CDCs, CFs, SMCs and ECs. K Exemplary dot plots and L percentage of CD105-positive cells. Data are represented as means ± SE, *p < 0.05, **p < 0.01, ***p < 0.001 (only significances against CDCs are depicted). A complete overview of p-values in Suppl. Table 3 (qRT-PCR) and Suppl. Table 4 (Flow cytometry). Parts of the figure were created with Biorender.com
Fig. 2
Fig. 2
Single-cell RNA sequencing (sc-RNAseq) of CDCs compared to the main cardiac non-myocyte cell types (CFs, SMCs, ECs) and differentiating hESCs. A UMAP plot of analyzed cell samples from sc-RNAseq colored by sample identifier. B Top ten upregulated differential expressed genes (uDEGs) for each cell type sorted by the average log fold change (avg_logFC) compared to all other cell samples (filtering parameters p < 0.05, avg_logFC ≥ 0.25). C UMAP plot of analyzed cell samples in sc-RNAseq colored by cluster. Eleven clusters were identified. D GO (gene ontology) terms significantly enriched for each cluster (Cl) analyzed by gene set enrichment analysis (GSEA). Column two reports the amount of cells for each sample included per cluster (percentages < 1% are not displayed). E Transcriptional similarity plots of CDCs, CFs, SMCs and ECs generated from sc-RNAseq data. F UMAP plot of sc-RNAseq-CDCs integrated with sc-RNAseq data of differentiating hESCs [44] at various stages (DIFF D6—DIFF D15) colored by sample identifier. G UMAP plot of sc-RNAseq-CDCs integrated with sc-RNAseq data of differentiating hESCs [44] at various stages (DIFF D6—DIFF D15) colored by clusters (unsupervised clustering). H UMAP plots generated from sc-RNAseq data showing expression levels of cardiac transcription factors TBX5, GATA4 and NKX2-5. I UMAP plots generated from sc-RNAseq data showing expression levels of CDC markers (B) CXCL1, CXCL6 and IL1B
Fig. 3
Fig. 3
Comparison of CDCs and human atrial biopsies by sc-/sn-RNAseq. A UMAP plot of adult CDC sc-RNAseq data integrated with sn/sc-RNAseq data from four human right atrial biopsies. Color indicates sample identifier. B UMAP plot of adult CDC sc-RNAseq data integrated with sn/sc-RNAseq data from four human right atrial biopsies. Color indicates cluster identity. Unsupervised clustering revealed 13 clusters identifying all main cell types of the human heart including rare cell populations (see also Suppl Fig. S7C). Abbreviations: CM, cardiomyocytes; DC, dendritic cells; MP, macrophages; NC, neuronal cells; NKC, natural killer cells; PC, pericytes; SC, single cell data; SN, single nuclei data; C) UMAP plots showing gene expression levels of various markers defining cell type identity of the clusters (see also Suppl Fig. S7B, C). D Zoomed view of trajectories detected in CF and CDC clusters. Color indicates cluster identity. Abbreviations: Tr, Trajectory E Overlapping gene expression of 3 top specific genes for each trajectory (Tr1: COL4A4, LAMA2, RORA; Tr2: TBX18, TBX20, NR4A1; Tr3: CXCL1, SERPINE1, CXCL6) F RNA velocity analysis performed by Velocyto. Velocity field projected onto the UMAP plot. Zoomed view of EC, SMC/PC, CF and CDC clusters. Color indicates sample identity. Arrows show the local average velocity and point from the CDC-2 cluster to the CDC-1/CF-1 cluster
Fig. 4
Fig. 4
Comparison of molecular characteristics of adult and infant CDCs. A–C Gene expression analysis by qRT-PCR of CDCs and CFs derived from infant (age: 5 days–5 years) and adult (age: 55–76 years) patients. Relative RNA expression versus β-ACTIN (gene symbol: ACTB) is illustrated. Data are represented as mean ± SEM, *p < 0.05, **p < 0.01, ***p < 0.001 (all p-values in Suppl Table 11) D-E Single-cell RNA sequencing of infant (age: 7 days) and adult (age: 61 years) CDCs. UMAP plots are illustrated colored by sample identifier (D) or cluster defined by gene expression (E). F Gene set topics enriched for uDEGs of each of the five clusters from Fig. 2E (for a detailed analysis see Suppl Table 12). G Transcriptional similarity plots of infant and adult CDCs generated from sc-RNAseq data. H Gene set topics enriched for uDEGs of infant CDC-specific cluster 1 and adult CDC-specific cluster 2 (for a detailed analysis see Suppl Table 13)
Fig. 5
Fig. 5
Paracrine effects mediated by CDC- and CF-derived extracellular vesicles (EVs). A–F Tube formation assay with human ECs on matrigel (matrigel assay). A Experimental outline. B Exemplary pictures of the positive control (PosCtr, EC medium with supplements), the negative control (NegCtr, serum-free medium) and serum-free medium supplemented with infant/adult CDC-/CF-EVs at the end of the matrigel assay. Angiogenesis Analyzer (ImageJ) highlights structures such as master segments, branches, isolated elements and master junctions. The software also calculates parameters such as “Total length” (the sum of length of segments, isolated elements and branches in the analyzed area), “Total master segments length” (the sum of the length of the detected master segments in the analyzed area), “Number of pieces” (the sum of number of segments, isolated elements and branches detected in the analyzed area). Detected and calculated parameters were normalized to the negative control (fold change to negative control, “FC over NegCtr”). C–E Quantitative analysis of selected parameters. F–I Migration assay (scratch assay) with human ECs. F Experimental outline. G Exemplary pictures of ECs incubated with EC medium with supplements (PosCtr), serum-free medium (NegCtr), or serum-free medium supplemented with CDC and CF-EVs at the time point of the scratch (0 h) and 24 h later. H–I Comparison of the differences of the cell-free area between time point 0 and 12 h (H) or 24 h (I) normalized to the negative control (fold change to negative control, “FC over NegCtr”). Data are represented as mean ± SE, *p < 0.05, **p < 0.01, ***p < 0.001
Fig. 6
Fig. 6
Molecular identity of CDCs. CDCs were identified as a distinct non-myocyte, non-hematopietic cell type with metabolic (mitochondria-rich), proliferative, secretive and immunomodulatory characteristics. CDCs originate from the human heart and show high similarity to atrial cardiac fibroblasts (CFs) in the human heart. Smooth muscle cells (SMCs), CFs and endothelial cells (ECs) shared biological processes with CDCs while cardiac progenitor cells (CPCs) did not. In functional assays, CDC-EVs acted in a pro-angiogenic way. Parts of the figure were created with Biorender.com

References

    1. Abramoff MD. Image processing with ImageJ. Biophotonics Int. 2004;11:36–42.
    1. Aghila Rani KG, Kartha CC. Effects of epidermal growth factor on proliferation and migration of cardiosphere-derived cells expanded from adult human heart. Growth Factors. 2010;28:157–165. doi: 10.3109/08977190903512628. - DOI - PubMed
    1. Assinder SJ, Stanton JA, Prasad PD. Transgelin: an actin-binding protein and tumour suppressor. Int J Biochem Cell Biol. 2009;41:482–486. doi: 10.1016/j.biocel.2008.02.011. - DOI - PubMed
    1. Barile L, Lionetti V, Cervio E, Matteucci M, Gherghiceanu M, Popescu LM, Torre T, Siclari F, Moccetti T, Vassalli G. Extracellular vesicles from human cardiac progenitor cells inhibit cardiomyocyte apoptosis and improve cardiac function after myocardial infarction. Cardiovasc Res. 2014;103:530–541. doi: 10.1093/cvr/cvu167. - DOI - PubMed
    1. Bergen V, Lange M, Peidli S, Wolf FA, Theis FJ. Generalizing RNA velocity to transient cell states through dynamical modeling. Nat Biotechnol. 2020;38:1408–1414. doi: 10.1038/s41587-020-0591-3. - DOI - PubMed

Publication types