

doi: 10.1073/pnas.2121979119.
Epub 2022 Mar 8.
Inhibitors of PARP: Number crunching and structure gazing
Affiliations
- PMID: 35259019
- PMCID: PMC8931346
- DOI: 10.1073/pnas.2121979119
Item in Clipboard
Inhibitors of PARP: Number crunching and structure gazing
Proc Natl Acad Sci U S A.
.
Abstract
SignificancePARP is an important target in the treatment of cancers, particularly in patients with breast, ovarian, or prostate cancer that have compromised homologous recombination repair (i.e., BRCA-/-). This review about inhibitors of PARP (PARPi) is for readers interested in the development of next-generation drugs for the treatment of cancer, providing insights into structure-activity relationships, in vitro vs. in vivo potency, PARP trapping, and synthetic lethality.
Keywords: HPF1; cancer drugs; drug specificity; inhibitor of Parp; synthetic lethality.
Conflict of interest statement
The authors declare no competing interest.
Figures
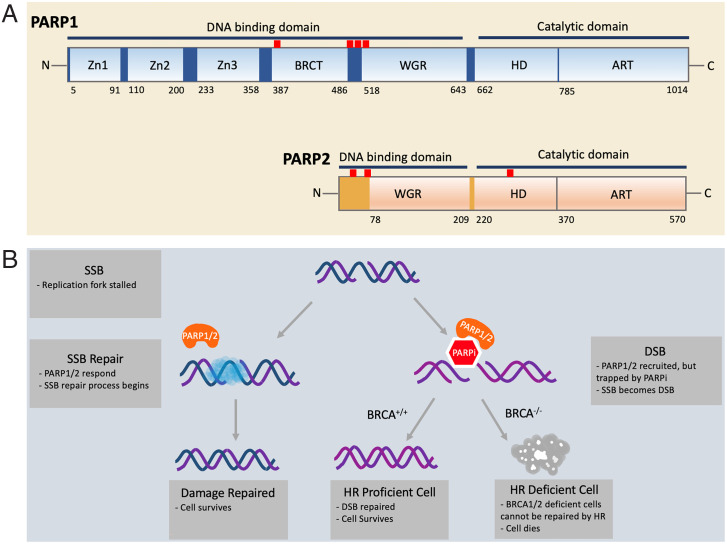
(A) Domain structure of PARP1 and PARP2. PARP1/2 contain DNA-binding domains and catalytic domains. In PARP1, the DNA-binding domain includes three zinc fingers (Zn1, Zn2, and Zn3), a breast cancer susceptibility protein-1 C terminus (BRCT) domain, and the tryptophan-glycine-arginine–rich (WGR) domain. The locations of the predominant automodification sites of PARP1 (D387, E488, E491, S499, S507, and S519) are indicated by red uptick bars. In PARP2, the DNA-binding domain includes an unstructured N-terminal region and the WGR domain. The catalytic domains of both PARP1/2 are composed of an alpha-helical subdomain (HD) and the ADP ribosyltransferase subdomain (CAT). The locations of the three known automodification sites of PARP2 (S47, S76, and S281) are indicated by red uptick bars. (B) The mechanism of synthetic BRCA1/2 deficiency and PARPi. During DNA replication, single-strand DNA is vulnerable to breakage. When a single-strand break (SSB) occurs, the replication fork is stalled. PARP1/2 (orange) arrive at the site of the damage and recruit other repair factors (blue cloud). In the presence of PARP1/2 inhibitor (red hexagon), however, PARP1/2 are trapped at the damage site, inhibiting the restart of replication. As a result of unresolved replication stress, a double-strand break (DSB) can arise. Homologous recombination (HR) is one of the most faithful ways to repair a DSB. Cells with functioning BRCA1/2 can carry out HR and restore the genomic integrity, but cancer cells with defective BRCA1/2 cannot. Thus, synthetic lethality selectively kills HR-deficient cancer cells in conjunction with a PARPi.
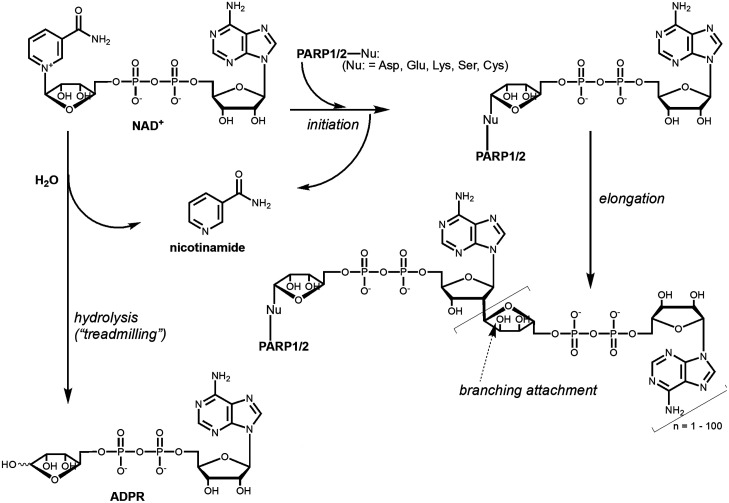
Chemical mechanism of PARylation by PARP1/2. In an initiation reaction, the ADPR moiety of the NAD+ substrate is attached to an amino acid side chain on PARP1/2. Elongation occurs wherein additional ADPRs are added to the existing ADPR, resulting in chain lengths up to 200. Branching of the PAR chains can also occur at the site indicated by an arrow. Additionally, PARP1 can simply hydrolyze NAD+ to yield free ADPR and nicotinamide in a reaction known as treadmilling.

Summary of inhibition measurements for PARPi with PARP1 and PARP2 and comparison to cell-based data. (A) For PARP1, each reported IC50 and KI value is shown as a point and the line indicates the median value. Our reported measurements for all these inhibitors using a method that avoids the tight-binding limit problem are indicated by black arrows. (B) For PARP2, each reported IC50 and KI value is shown as a point and the line indicates the median value. (C) The ratio of the median IC50 value for BRCT+/+ vs. matched BRCT−/− cells is plotted against the KI as determined in ref. , since these values were determined with proper consideration of the tight-binding limit. All raw values for the points in these plots along with literature references can be found in SI Appendix, Tables S1 and S2 .
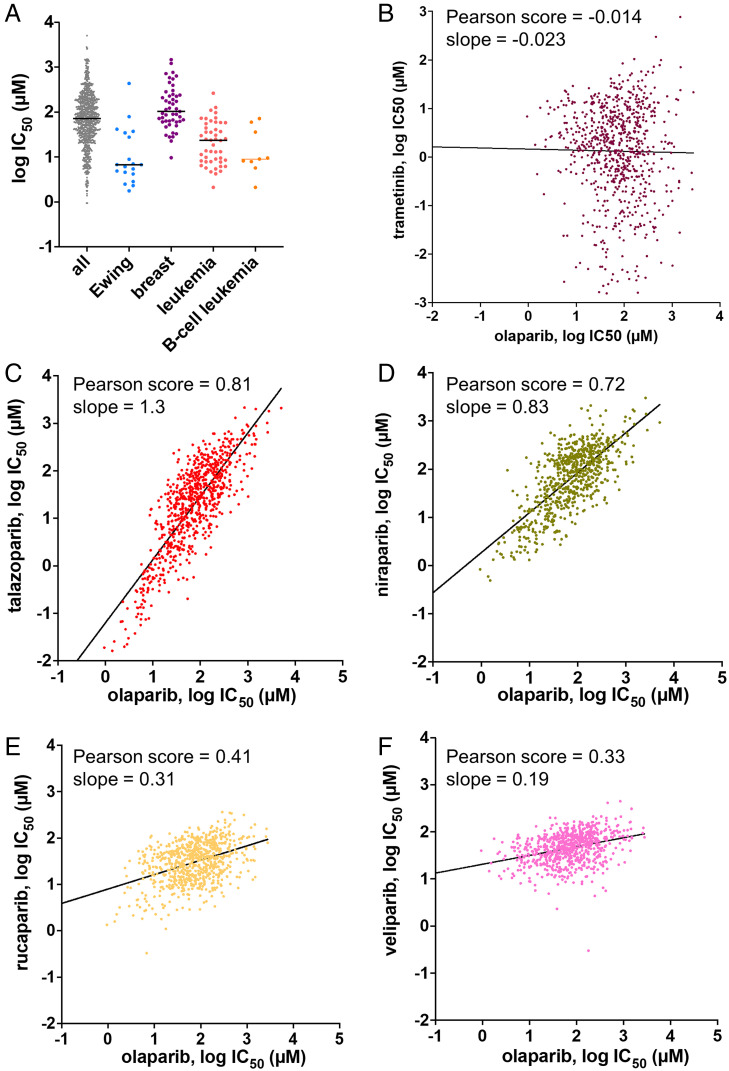
(A) Distribution of potencies for triggering cell death in 1,000 different cell lines by olaparib. The leftmost column includes all 1,000 cell lines studied in the Genomics of Drug Sensitivity in Cancer. Subsequent columns to the right display cancer-specific cell types wherein the breast cancer cell lines are not predominantly BRCA−/−. The line indicates the median value. The data were obtained from https://www.cancerrxgene.org . (B–F) Comparison of the potency of olaparib to other PARPi in a panel of 1,000 different cell types. The data were obtained from https://www.cancerrxgene.org . The IC50 values for each inhibitor were downloaded in an array and compared to the IC50 values for the other inhibitors for each cell line for which the database contained a value. Each data point represents the log IC50 value of a PARPi (B, trametinib; C, talazoparib; D, niraparib; E, rucaparib; F, veliparib) vs. the log IC50 value of olaparib for a different cell line. To facilitate interpretation and comparisons between the different graphs, the axes are “square” (one log unit is the same length on both x and y axes), and the scales are the same for all five graphs. The black line represents a best-fit linear correlation between the two inhibitors and the Pearson correlation coefficient and slope value are indicated for each graph.

Overview of binding pocket for NAD+ in the catalytic domain of PARP1. (Left) The ribbon structure of the catalytic domain of PARP1 is shown in cyan with the nonhydrolyzable NAD+ analog (BAD) shown in green (Protein Data Bank [PDB] ID 6BHV). (Right) The pocket for binding BAD is visualized with the protein surface shown in cyan. Note that the nicotinamide ring sits in the deepest pocket of the active site.
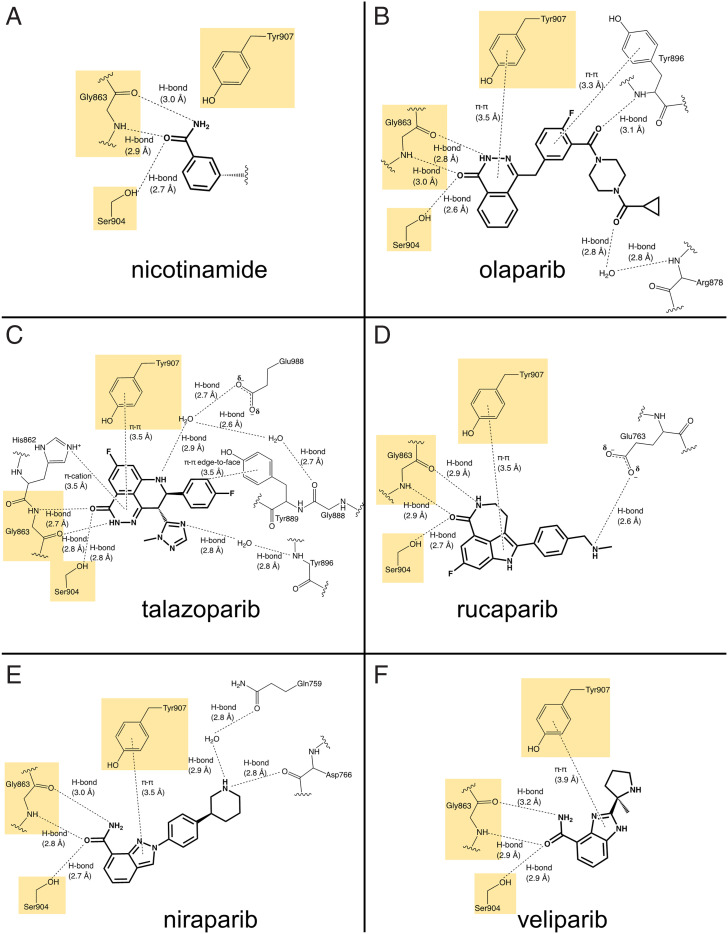
(A–F) Interaction diagrams for PARPi with PARP1. (A) Nicotinamide ring from BAD (PDB ID 6BHV). (B) Olaparib (PDB ID 7KK4). (C) Talazoparib (PDB ID 7KK3). (D) Rucaparib (PDB ID 6VVK). (E) Niraparib (PDB ID 7KK5). (F) Veliparib (PDB ID 7KK6). For simplicity and easier comparison with the PARPi, only the nicotinamide end of BAD is shown here. The full interaction diagram for BAD is included in SI Appendix, Fig. S1 . All diagrams were prepared in ChemDraw using the deposited PDB entries indicated.
References
-
- Lodish H., et al. , Molecular Biology of the Cell (Freeman, New York, NY, 2016).
-
- Jeggo P. A., Pearl L. H., Carr A. M., DNA repair, genome stability and cancer: A historical perspective. Nat. Rev. Cancer 16, 35–42 (2016). - PubMed
-
- Wood R. D., Mitchell M., Sgouras J., Lindahl T., Human DNA repair genes. Science 291, 1284–1289 (2001). - PubMed
-
- Gibson B. A., Kraus W. L., New insights into the molecular and cellular functions of poly(ADP-ribose) and PARPs. Nat. Rev. Mol. Cell Biol. 13, 411–424 (2012). - PubMed
-
- Bai P., Biology of poly(ADP-ribose) polymerases: The factotums of cell maintenance. Mol. Cell 58, 947–958 (2015). - PubMed
MeSH terms
Substances
Grants and funding
LinkOut - more resources
Full Text Sources
Medical
