. 2022 Mar 17;11(2):213-229.
doi: 10.1093/stcltm/szab021.

T-cadherin Expressing Cells in the Stromal Vascular Fraction of Human Adipose Tissue: Role in Osteogenesis and Angiogenesis

Affiliations

T-cadherin Expressing Cells in the Stromal Vascular Fraction of Human Adipose Tissue: Role in Osteogenesis and Angiogenesis

Julien Guerrero et al. Stem Cells Transl Med. .

Abstract

Cells of the stromal vascular fraction (SVF) of human adipose tissue have the capacity to generate osteogenic grafts with intrinsic vasculogenic properties. However, cultured adipose-derived stromal cells (ASCs), even after minimal monolayer expansion, lose osteogenic capacity in vivo. Communication between endothelial and stromal/mesenchymal cell lineages has been suggested to improve bone formation and vascularization by engineered tissues. Here, we investigated the specific role of a subpopulation of SVF cells positive for T-cadherin (T-cad), a putative endothelial marker. We found that maintenance during monolayer expansion of a T-cad-positive cell population, composed of endothelial lineage cells (ECs), is mandatory to preserve the osteogenic capacity of SVF cells in vivo and strongly supports their vasculogenic properties. Depletion of T-cad-positive cells from the SVF totally impaired bone formation in vivo and strongly reduced vascularization by SVF cells in association with decreased VEGF and Adiponectin expression. The osteogenic potential of T-cad-depleted SVF cells was fully rescued by co-culture with ECs from a human umbilical vein (HUVECs), constitutively expressing T-cad. Ectopic expression of T-cad in ASCs stimulated mineralization in vitro but failed to rescue osteogenic potential in vivo, indicating that the endothelial nature of the T-cad-positive cells is the key factor for induction of osteogenesis in engineered grafts based on SVF cells. This study demonstrates that crosstalk between stromal and T-cad expressing endothelial cells within adipose tissue critically regulates osteogenesis, with VEGF and adiponectin as associated molecular mediators.

Keywords: 3D microenvironment; adipose stem cells; angiogenesis; blood vessels; bone; osteogenesis.


Figures

Graphical Abstract
Graphical Abstract
Figure 1.
Figure 1.
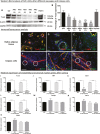
In vitro characterization and analysis of gene expression markers of the Tcadherin population in native human adipose tissue and Unpass cells. (A) Representative Western Blot of SVF, ASCs passed until passage 4 (P0, P1, P2, P3, and P4) and Unpass cells for T-cadherin, β-actin, and GAPDH. (B) Quantification of T-cad protein amount relative to β-actin and GAPDH protein amount (mean ± SD) in Western Blot assay. ∗ shows the significant representation with the SVF condition and ° shows the significant representation with the Unpass condition. (C-E) Immunofluorescence on native human adipose tissue co-stained (C) for T-cad and vWF, (D) for T-cad and Laminin, and (E) for T-cad and CD31. (F-G) Immunofluorescence on Unpass cells co-stained (F) for T-cad and vWF, (G) for T-cad and Laminin, and (H) for T-cad and CD31. DAPI staining in blue shows the nuclei and the yellow/orange color indicates colocalization of T-cad with either vWF, Lam or CD31. (IO) Relative gene expression (mean±SD) of (I) T-cad, (J) vWF, (K) CD31, (L) KDR, (M) CD105, (N) CD73, and (O) CD90 of SVF, SVF depleted of T-cad cells, Unpass cells and Unpass cells depleted of T-cad cells. Scale bar in micrographs = 100 μm. n = 7 values per group for Western Blot quantification, and n = 7 values per group for qPCR analysis. Abbreviation: SVF, Stromal Vascular Fraction; ASCs, Adipose Stromal Cells; T-cad, T-cadherin; vWF, von Willebrand Factor; Lam, Laminin; KDR, kinase insert domain receptor. ∗/°P < .05, ∗∗/°°P < .01, ∗∗∗/°°°P < .001, ∗∗∗∗P < .0001.
Figure 2.
Figure 2.
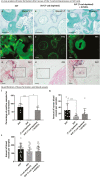
Depletion of T-cad-positive cells from SVF and Unpass cells impairs in vivo bone formation and vascularization. 12 weeks after in vivo implantation of Engipore samples seeded with SVF, SVF depleted of Tcad- positive cells, Unpass cells, and Unpass cells depleted of T-cad-positive cells were analysed for (A-D) Masson’s Trichrome staining, (E) bone formation, (F) amount of the blood vessels of human origin (G) total amount of blood vessels, (H-K) autofluorescence in FITC channel, (L-S) human ALU staining. White arrows in (A) and (C) indicate bone tissue. Black arrows in (P-S) indicate ALU-positive cells. Scale bar in micrographs = 100 μm. Data in histograms are given as (mean ± SD). n = 8 values per group for bone formation quantification, n = 24 values per group for total blood vessel quantification, and n = 12 values per group for human blood vessel quantification. Abbreviation: Masson’s T, Masson’s Trichrome. ∗∗P < .01, ∗∗∗P < .001.
Figure 3.
Figure 3.
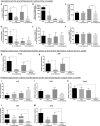
Depletion of T-cad-positive cells from SVF and Unpass cells alters secretion of growth factor and expression of endothelial and bone markers during 3D bioreactor culture. One week after pre-implantation bioreactor culture of Engipore samples seeded with SVF, SVF depleted of T-cad-positive cells, Unpass cells and Unpass cells depleted of T-cad-positive cells, perfusion supernatants were collected and analysed for release of growth factors (A) VEGF, (B) Adiponectin, (C) Thrombospondin, (D) IGF-1, (E) BMP-4 and (F) BMP-2, and resident cells analysed for relative gene expression of endothelial markers (G) T-cad and (H) vWF and bone markers (I) ALP, (J) Col1, (K) Runx2, (L) OPN, and (M) OPG. Data are given as (mean ± SD). n = 12 values per group for supernatant analysis, and n = 6 values per group for qPCR analysis. Abbreviations: VEGF, vascular endothelial growth factor; IGF, insulin-like growth factor; BMP, bone morphogenetic protein; T-cad, T-cadherin; vWF, von Willebrand factor; ALP, alkaline phosphatase; COL1, collagen type 1A1; Runx2, runt-related transcription factor 2; OPN, osteopontin; OPG, osteoprotegerin. ∗P < .05, ∗∗P < .01, ∗∗∗P < .001.
Figure 4.
Figure 4.
Impaired in vivo bone formation and vascularization capacities of T-cad-positive cell depleted SVF are rescued by co-culture with HUVECs. Twelve weeks after in vivo implantation, Engipore samples seeded with SVF, SVF depleted of Tcad-positive cells, and SVF depleted of T-cad-positive cells in co-culture with HUVECs were analysed for (A-C) Masson’s Trichrome staining, (D-F) autofluorescence in FITC channel, (G-I) human ALU immunostaining, (J) bone formation, (K) amount of blood vessels of human origin, (L) total amount of blood vessels. Scale bar in micrographs = 100 μm. Data in histograms are given as (mean ± SD). n = 7 values per group for bone formation quantification, n = 24 values per group for total blood vessel quantification, and n = 12 values per group for human blood vessel quantification. Abbreviation: Masson’s T, Masson’s Trichrome. ∗P < .05, ∗∗∗P < .001.
Figure 5.
Figure 5.
Co-culture of SVF depleted of T-cad-positive cells with HUVECs normalizes growth factor secretion and expression of endothelial and bone markers. One week after pre-implantation bioreactor culture of Engipore samples seeded with SVF, SVF depleted of T-cad-positive cells, and SVF depleted of T-cad-positive cells in co-culture with HUVECs, perfusion supernatants were collected and analysed for released growth factors (A) VEGF, (B) Adiponectin, (C) IGF-1, and (D), Thrombospondin, and resident cells were analysed for relative gene expression of endothelial markers (E) T-cad, and (F) vWF. Data in histograms are given as (mean ± SD). n = 12 values per group for supernatant analysis, and n = 6 values per group for qPCR analysis. Abbreviations: VEGF, vascular endothelial growth factor; IGF, insulin-like growth factor; BMP, bone morphogenetic protein; T-cad, T-cadherin; vWF, von Willebrand factor. ∗P < .05, ∗∗P < .01, ∗∗∗P < .001, ∗∗∗∗P < .0001.
Figure 6.
Figure 6.
In vivo assessment and quantification of bone formation and vascularization after the rescue of T-cad depletion in SVF and Unpass cells by co-culture with control HUVECs or HUVECs overexpressing T-cad. Twelve weeks after in vivo implantation, Engipore samples were seeded with (A, C, E, G, I, K, M, O, Q, and S) SVF depleted of T-cad-positive cells in co-culture with control HUVECs or HUVECs (T-cad+) and (B, D, F, H, L, N, P, R, and T) Unpass cells depleted of T-cad-positive cells in co-culture with control HUVECs or HUVECs (T-cad+). (A, B) Masson’s Trichrome staining, (C, D) autofluorescence in FITC, (E, F) human ALU immunostaining, (G, H) bone formation, (I, J) amount of blood vessels of human origin and (K, L) total amount of blood vessels were analysed. (M-T) Perfusion supernatants collected after 1 week of pre-implantation bioreactor culture of Engipore samples seeded with (M, O, Q, T) SVF depleted of T-cad-positive cells in co-culture with control HUVECs or HUVECs (T-cad+) and (N, P, R, and T) Unpass cells depleted of T-cad-positive cells in co-culture with control HUVECs or HUVECs (T-cad+). Secreted growth factors (M, N) VEGF, (O, P) Adiponectin, (Q, R) IGF-1 and (S, T) Thrombospondin were analysed. Scale bar in micrographs = 100 μm. Data in histograms are given as (mean ± SD). n = 7 values per group for bone formation quantification, n = 24 values per group for total blood vessel quantification, n = 12 values per group for human blood vessel quantification, and n = 12 values per group for supernatant analysis. ∗P < .05, ∗∗∗∗P < .0001.
Figure 7.
Figure 7.
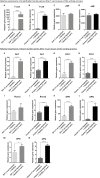
In vitro quantification of endothelial and bone markers relative gene expression after the rescue of T-cad depletion in SVF and Unpass cells by co-culture with control HUVECs or HUVECs overexpressing T-cad. Relative gene expression (mean ± SD) of endothelial markers (A-B) T-cad and (C-D) vWF and of bone markers (E-F) ALP, (G-H) COL1, (I-J) Runx2, (K-L) OPN, and (M-N) OPG in 2D cultures of SVF or Unpass cells depleted of T-cad-positive cells in co-culture with control HUVECs or with HUVECs (T-cad+). (E-N) n = 6 values per group for qPCR analysis. Abbreviations: T-cad, T-cadherin; vWF, von Willebrand factor; ALP, alkaline phosphatase; COL1, collagen type 1A1; Runx2, runt-related transcription factor 2; OPN, osteopontin; OPG, osteoprotegerin. ∗P < .05, ∗∗P < .01, ∗∗∗P < .001, ∗∗∗∗P < .0001.

References

    1. Barabaschi GD, Manoharan V, Li Q, Bertassoni LE. Engineering pre-vascularized scaffolds for bone regeneration. Adv Exp Med Biol. 2015;881:79-94. - PubMed
    1. Rouwkema J, Rivron NC, van Blitterswijk CA. Vascularization in tissue engineering. Trends Biotechnol. 2008;26(8):434-441. - PubMed
    1. Novosel EC, Kleinhans C, Kluger PJ. Vascularization is the key challenge in tissue engineering. Adv Drug Deliv Rev. 2011;63(4-5):300-311. - PubMed
    1. Moon JJ, West JL. Vascularization of engineered tissues: approaches to promote angio-genesis in biomaterials. Curr Top Med Chem. 2008;8(4):300-310. - PMC - PubMed
    1. Miranville A, Heeschen C, Sengenès C, Curat CA, Busse R, Bouloumié A. Improvement of postnatal neovascularization by human adipose tissue-derived stem cells. Circulation. 2004;110(3):349-355. - PubMed

Publication types