. 2022 Apr 25;32(8):1715-1727.e8.
doi: 10.1016/j.cub.2022.02.040. Epub 2022 Mar 7.

Robust regulatory architecture of pan-neuronal gene expression

Affiliations

Robust regulatory architecture of pan-neuronal gene expression

Eduardo Leyva-Díaz et al. Curr Biol. .

Abstract

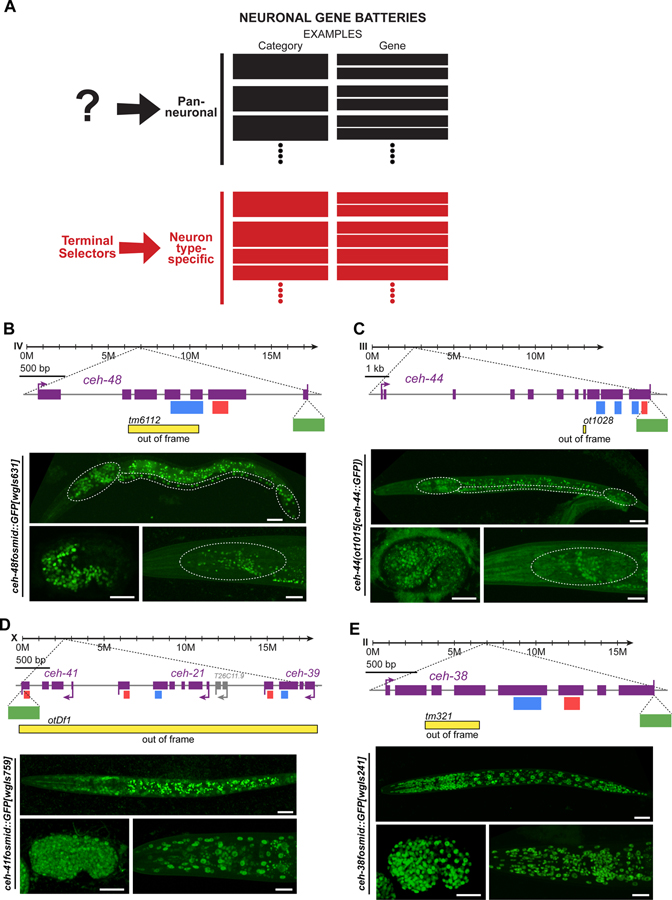
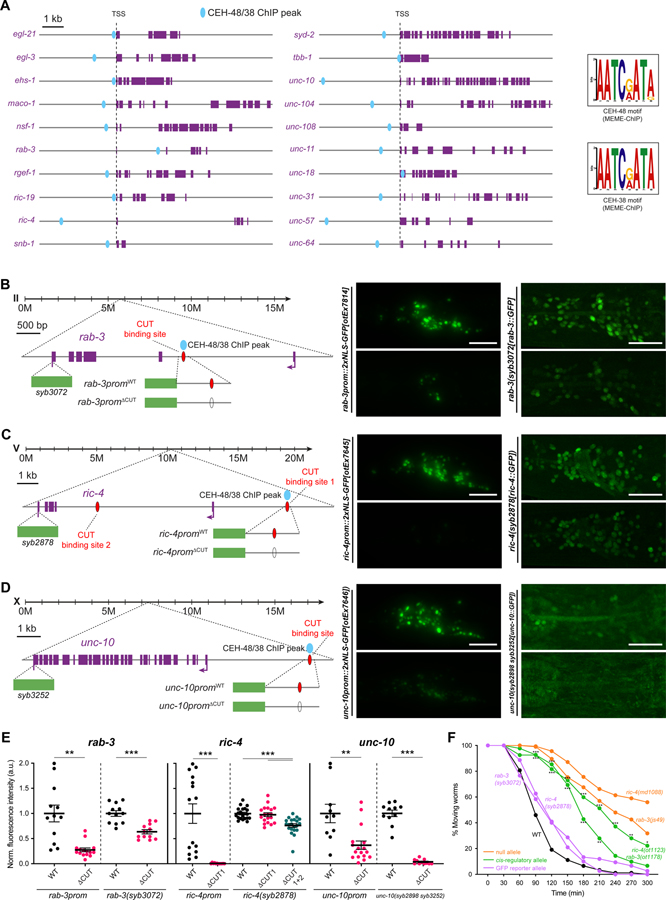
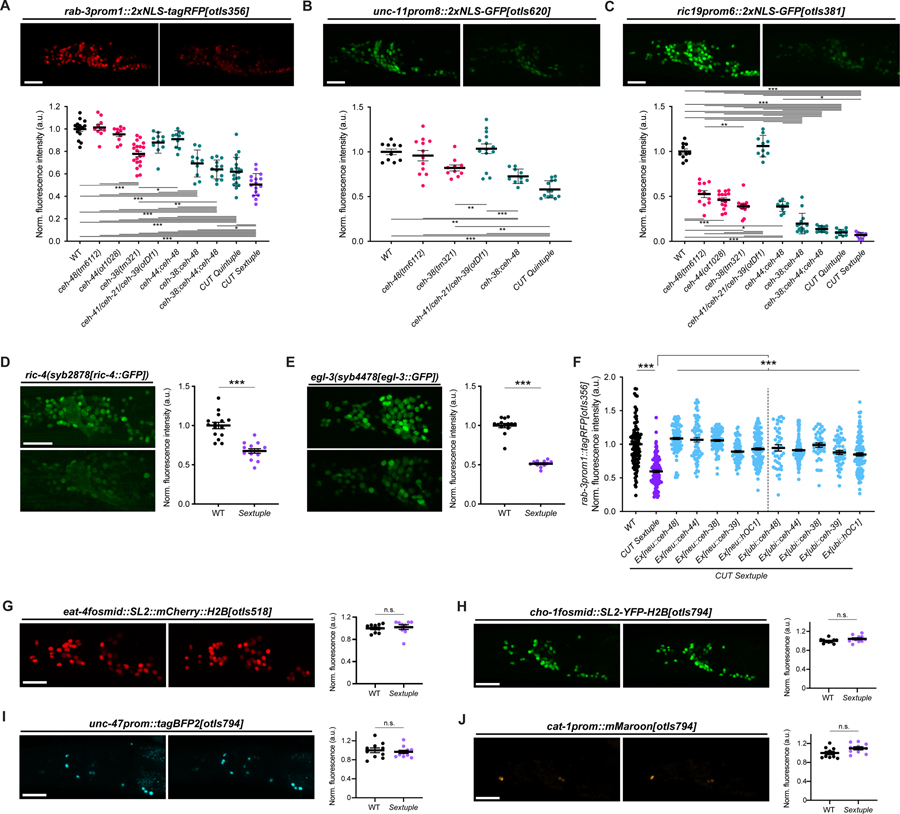
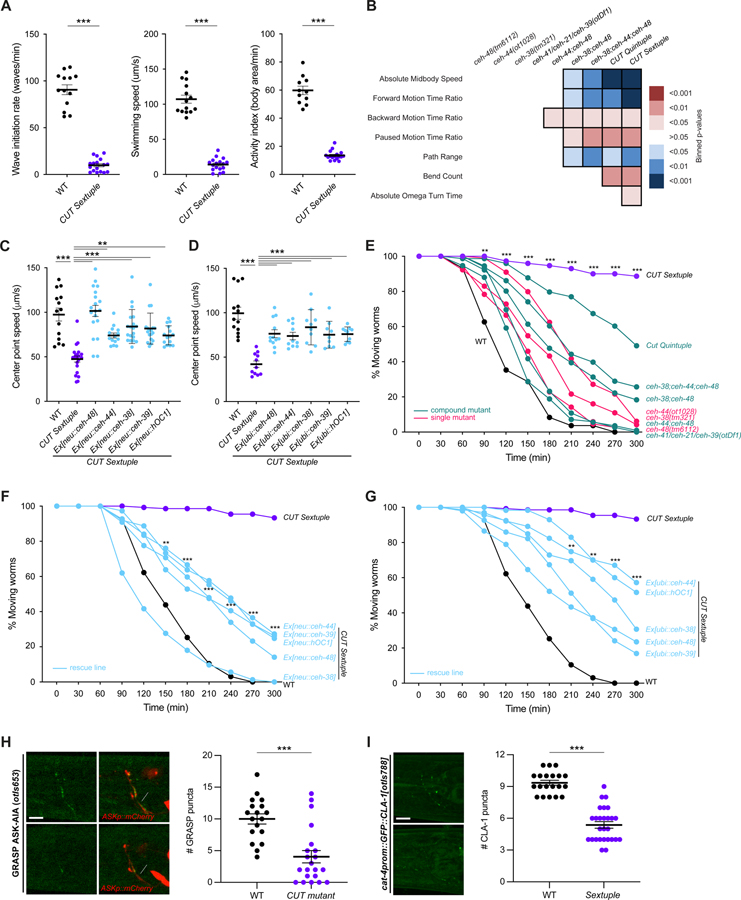
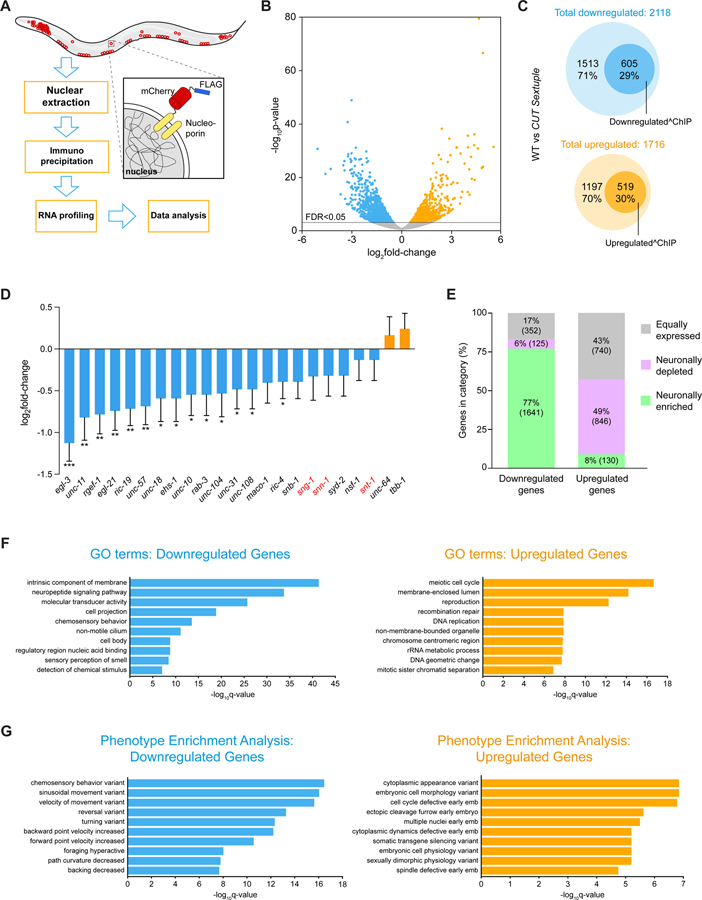
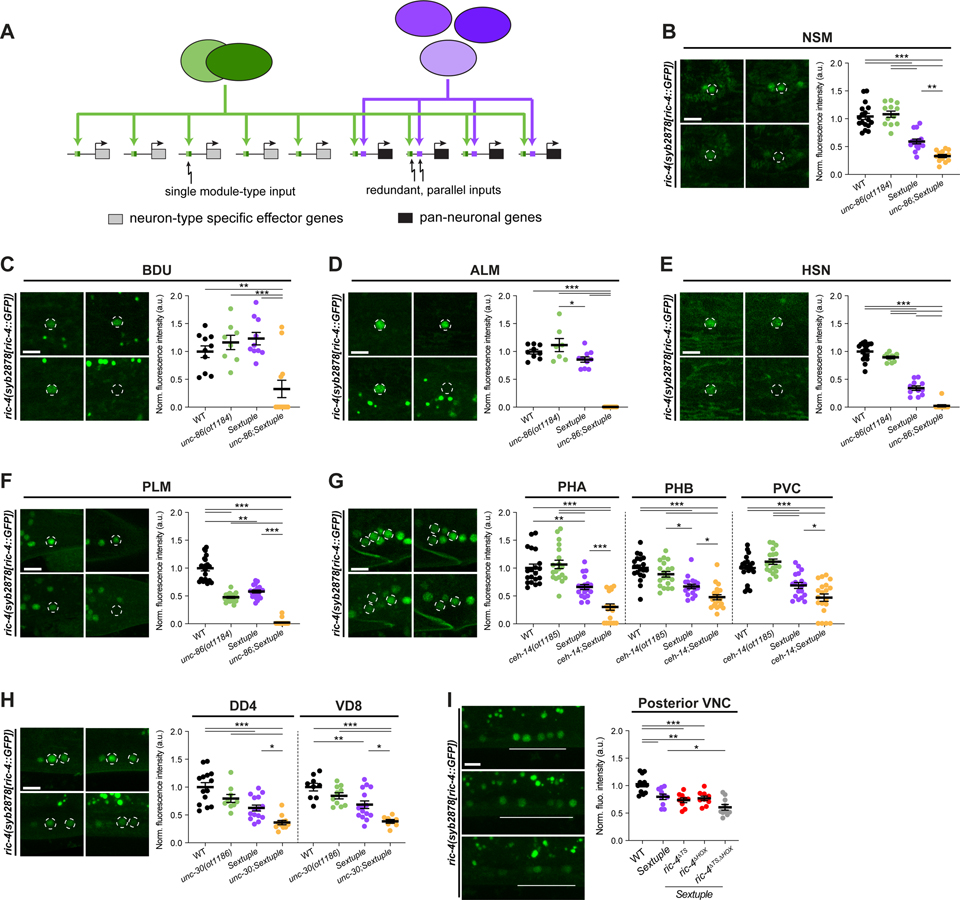
Pan-neuronally expressed genes, such as genes involved in the synaptic vesicle cycle or in neuropeptide maturation, are critical for proper function of all neurons, but the transcriptional control mechanisms that direct such genes to all neurons of a nervous system remain poorly understood. We show here that six members of the CUT family of homeobox genes control pan-neuronal identity specification in Caenorhabditis elegans. Single CUT mutants show barely any effects on pan-neuronal gene expression or global nervous system function, but such effects become apparent and progressively worsen upon removal of additional CUT family members, indicating a critical role of gene dosage. Overexpression of each individual CUT gene rescued the phenotype of compound mutants, corroborating that gene dosage, rather than the activity of specific members of the gene family, is critical for CUT gene family function. Genome-wide binding profiles, as well as mutation of CUT homeodomain binding sites by CRISPR/Cas9 genome engineering show that CUT genes directly control the expression of pan-neuronal features. Moreover, CUT genes act in conjunction with neuron-type-specific transcription factors to control pan-neuronal gene expression. Our study, therefore, provides a previously missing key insight into how neuronal gene expression programs are specified and reveals a highly buffered and robust mechanism that controls the most critical functional features of all neuronal cell types.


Conflict of interest statement

Declaration of interests The authors declare no competing interests.

Figures

Figure 1.
Figure 1.. CUT genes are expressed pan-neuronally.
(A) Schematic illustration of two main components of neuronal gene batteries, pan-neuronally expressed genes, for which no current regulator is known, and neuron type-specific gene batteries that are controlled by terminal selector-type transcription factors . Examples for genes in each category are provided. (B-E) Schematic representation of ceh-48 (B), ceh-44 (C), ceh-41, ceh-21 and ceh-39 (D), and ceh-38 (E), gene loci showing mutant alleles, GFP tags, and CUT and Homeodomain motifs location. Reporter expression at the comma embryonic stage (bottom left, lateral view), L1 larval stage (top, full worm lateral views) and young adult stage (bottom right, lateral view of the head) showing ceh-48 (ceh-48fosmid::GFP[wgIs631]). (B) and ceh-44 (ceh-44(ot1015[ceh-44::GFP])) (C) pan-neuronal expression, and ceh-41, ceh-21 and ceh-39 (D), ceh-38 (ceh-38fosmid::GFP[wgIs241]) (E) ubiquitous expression. We use a fosmid reporter for ceh-41 (ceh-41fosmid::GFP[wgIs759]), the last gene in the operon of three ONECUT genes, which provides a read-out for expression of all genes in the operon. The embryonic comma stage is the stage when neurons are born. Head ganglia, ventral nerve cord, and tail ganglia outlined in L1 images, and head ganglia outlined in young adult images for ceh-48 and ceh-44 reporters. Asterisks (*) indicate autofluorescence in L1 (ceh-48 and ceh-44) and Comma (ceh-44) images. See Figure S1 for a comparison between CRISPR reporters expression for the different CUT genes. Note that the ceh-44(ot1028) allele was design to introduce a frameshift in the CUT homeobox isoform of the Y54F10AM.4 locus (isoform a) and does not affect the b isoform of this locus, which generates a different, non-homeodomain containing isoform, homologous to CASP protein . YA, young adult; Scale bars 15 μm.
Figure 2.
Figure 2.. CUT genes binding is required for pan-neuronal gene expression.
(A) Schematic representation of 20 pan-neuronal genes and the location of CEH-48 and CEH-38 peaks found in the ChIP-seq datasets. CEH-48 and CEH-38 peaks overlap for all genes except in maco-1 and tbb-1, which only contain CEH-38 peaks, and ric-19, which only contains a CEH-48 peak. Scale represents 2kb for unc-104 and unc-31. The consensus binding motifs for CEH-48 and CEH-38, extracted from the ChIP-seq datasets using MEME-ChIP are shown on the right. See Data S1A–C for a full list of genes with CEH-48 and CEH-38 ChIP peaks. See Figure S2 for how CUT ChIP binding correlates with the cis-regulatory elements that we previously defined in pan-neuronally expressed genes . (B-D) Schematic representation of rab-3 (B), ric-4 (C) and unc-10 (D) gene loci (left) showing the location of CEH-48/CEH-38 ChIP peaks, CUT homeodomain binding sites, endogenous GFP tags for CRISPR reporters rab-3(syb3072[rab-3::T2A::3xNLS::GFP]), ric-4(syb2878[ric-4::T2A::3xNLS::GFP]), unc-10(syb2898 syb3252[unc-10::T2A::3xNLS::GFP])), and small promoters tested (rab-3prom10::2xNLS-GFP[otEx7814], ric-4prom30::2xNLS-GFP[otEx7645], unc-10prom12::2xNLS-GFP[otEx7646]). Blue ovals indicate binding based on ChIP-seq peak data, red ovals indicate binding site based on sequence. Worm head GFP images showing a reduction in pan-neuronal gene expression when the CUT homeodomain binding site is mutated compared to WT (middle, left). Mutation of the same CUT homeodomain binding sites endogenously in the context of CRISPR reporters affects pan-neuronal expression (middle, right). ric-4 gfp-tagged allele expression is only affected upon mutation of additional CUT homeodomain binding sites (site 1 and 2). unc-10 gfp-tagged allele expression is very dim and expression is not visible in all neurons. All images correspond to worms at the L4 larval stage. (E) Quantification of small promoters and CRISPR reporters (shown in B-D) head neurons fluorescence intensity in wild-type and upon CUT homeodomain binding site mutations in the regulatory control regions of rab-3 (left), ric-4 (center) and unc-10 (right). The data are presented as individual values with each dot representing the expression level of one worm with the mean ± SEM indicated. Unpaired t-test, **P < 0.01, ***P < 0.001. For ric-4(syb2878[ric-4::T2A::3xNLS::GFP]), one-way ANOVA followed by Tukey’s multiple comparisons test; ***P < 0.001. n ≥ 10 for all genotypes. (F) Aldicarb-sensitivity defects in wild-type animals, ric-4 and rab-3 CRISPR reporter alleles (rab-3(syb3072), ric-4(syb287)), ric-4 and rab-3 cis-regulatory alleles (ric-4(ot1123 syb2878), rab-3(ot1178 syb3072)), and ric-4 and rab-3 null alleles (ric-4(md1088), rab-3(js49)). Wild-type data is represented with black dots, the CRISPR reporter alleles with purple dots, the cis-regulatory alleles with green dots, and null alleles with orange dots. Two-way ANOVA followed by Tukey’s multiple comparisons test, comparisons for ric-4 and rab-3 cis-regulatory alleles vs wild-type indicated; *P < 0.05, **P < 0.01, ***P < 0.001. n ≥ 3 independent experiments (25 animals per independent experiment). Mean and SEM values are provided in Data S5A. TSS, transcription start site; WT, wild-type; a.u., arbitrary units. Scale bars 15 μm for all panels except for CRISPR reporters in (B-D), where scale bars equal 10 μm.
Figure 3.
Figure 3.. CUT genes act in a dosage-dependent manner to control pan-neuronal gene expression.
(A-C) Expression of rab-3prom1::2xNLS-tagRFP[otIs356] (A), unc-11prom8::2xGFP[otIs620] (B) and ric19prom6::2xNLS-GFP[otIs381] (C) in wild-type (left) and CUT sextuple mutant (right). Lateral views of the worm head at the L4 stage are shown. Quantification of fluorescence intensity in head neurons (bottom) in wild-type, individual CUT mutants (ceh-48(tm6112), ceh-44(ot1028) and ceh-38(tm321)) and compound CUT mutants (otDf1, which deletes ceh-41, ceh-21 and ceh-39; double ceh-44;ceh-48, double ceh-38;ceh-48, triple ceh-38;ceh-44;ceh-48, quintuple ceh-38;ceh-48;otDf1, and sextuple ceh-38;ceh-44;ceh-48;otDf1). unc-11prom::2xGFP[otIs620] and ceh-44 are located in the same chromosome (chr. III) and cannot be recombined together. The data are presented as individual values with each dot representing the expression level of one worm with the mean ± SEM indicated. Wild-type data is represented with black dots, individual CUT mutants with pink dots, the sextuple CUT mutant with purple dots, and other compound CUT mutants with green dots. One-way ANOVA followed by Tukey’s multiple comparisons test; *P < 0.05, **P < 0.01, ***P < 0.001. n ≥ 10 for all genotypes. All genotypes were compared, but only those comparisons that show statistically significant differences are indicated with lines. (D-E) Expression of ric-4(syb2878[ric-4::GFP]) (ric-4(syb2878[ric-4::T2A-3xNLS-GFP])) (D), egl-3(syb4478[egl-3::GFP]) (egl-3(syb4478[egl-3::SL2-GFP-H2B])) (E) in wild-type (top) and CUT sextuple mutant (bottom). Lateral views of the worm head at the L4 stage are shown. Quantification of CRISPR alleles fluorescence intensity in head neurons. The data are presented as individual values with each dot representing the expression level of one worm with the mean ± SEM indicated. Unpaired t-test, ***P < 0.001. n ≥ 12 for all genotypes. (F) Expression of rab-3prom::2xNLS-tagRFP[otIs356] was compared between wild-type, CUT sextuple mutant, and CUT sextuple mutant rescue (pan-neuronal, ceh-48 promoter (“neu”, see Figure S4), or ubiquitous, eft-3 promoter (“ubi”), expression of ceh-48, ceh-44, ceh-38, ceh-39 or hOC1). Quantification of fluorescence intensity analyzed by COPAS system (“worm sorter”). The data are presented as individual values with each dot representing the expression level of one worm with the mean ± SEM indicated. Wild-type data is represented with black dots, the sextuple CUT mutant with purple dots, and rescue lines with blue dots. One-way ANOVA followed by Tukey’s multiple comparisons test; ***P < 0.001. n ≥ 40 for all genotypes. (G-J) Neurotransmitter reporter transgenes in CUT gene mutants. Transgenes are otIs518 (eat-4fosmid::SL2::mCherry::H2B) (G) and otIs794 which contains cho-1fosmid::NLS-SL2-YFP-H2B (H), unc-47prom::tagBFP2 (I), and cat-1prom::mMaroon (J), analyzed in a wild-type (left) or CUT sextuple mutant background (right). Lateral views of the worm head at the L4 stage are shown. Quantification of fluorescence intensity in head neurons. The data are presented as individual values with each dot representing the expression level of one worm with the mean ± SEM indicated. n ≥ 10 for all genotypes. WT, wild-type; a.u., arbitrary units; n.s., not significant. Scale bars 15 μm.
Figure 4.
Figure 4.. CUT genes are required for proper neuronal function.
(A) Swimming behavior: wave initiation rate (left), swimming speed (center), and activity index (right) were compared between wild-type and CUT sextuple mutant using a multi-worm tracker system . The data are presented as individual values with each dot representing the value of one worm with the mean ± SEM indicated. Unpaired t-test, ***P < 0.001. n ≥ 11 for all genotypes. (B) Behavioral phenotypic summaries of representative locomotion features for individual and compound CUT mutants, analyzed using an automated worm tracker system . Heat map colors indicate the p-value for each feature for the comparison between each of the mutant strains and the wild-type strain. Red indicates a significant increase for the tested feature, while blue indicates a significant decrease. One-way ANOVA followed by Tukey’s multiple comparisons test. n ≥ 10 for all genotypes. Time ratio = (total time spent performing behavior)/(total assay time). (C-D) Worm speed was compared between wild-type, CUT sextuple mutant, and CUT sextuple mutant rescue (panneuronal, ceh-48 promoter (“neu”, see Figure S4) (C), or ubiquitous, eft-3 promoter (“ubi”) (D), expression of ceh-48, ceh-44, ceh-38, ceh-39 or hOC1) using a multi-worm tracker system . The data are presented as individual values with each dot representing the value of one worm with the mean ± SEM indicated. Wild-type data is represented with black dots, the sextuple CUT mutant with purple dots, and rescue lines with blue dots. One-way ANOVA followed by Tukey’s multiple comparisons test, comparisons with CUT sextuple mutant indicated; **P < 0.01, ***P < 0.001. n ≥ 10 for all genotypes. See Figure S4 for additional locomotion features. (E) Aldicarb-sensitivity defects in individual CUT mutants (ceh-48(tm6112), ceh-44(ot1028), ceh-38(tm321)) and compound CUT mutants (otDf1, which deletes ceh-41, ceh-21 and ceh-39; double ceh-44;ceh-48, double ceh-38;ceh-48, triple ceh-38;ceh-44;ceh-48, quintuple ceh-38;ceh-48;otDf1, and sextuple ceh-38;ceh-44;ceh-48;otDf1) compared to wild-type animals. Aldicarb is an acetylcholinesterase inhibitor that paralyzes worms. Decreased sensitivity to aldicarb correlates with a reduction in synaptic transmission . Worms were tested every 30 min for paralysis by touching the head and tail three times each. The data are presented as the percentage of moving worms at the indicated time point, dots represent the mean of independent experiments for each genotype. Wild-type data is represented with black dots, individual CUT mutants with pink dots, the sextuple CUT mutant with purple dots, and other compound CUT mutants with green dots. Two-way ANOVA followed by Tukey’s multiple comparisons test, comparisons for wild-type vs CUT sextuple mutant indicated; **P < 0.01, ***P < 0.001. n ≥ 3 independent experiments (25 animals per independent experiment). Mean and SEM values are provided in Data S5B. (F-G) Aldicarb-sensitivity defects in wild-type animals, CUT sextuple mutant, and CUT sextuple mutant rescue lines (pan-neuronal (F), or ubiquitous (G) rescue lines). Wild-type data is represented with black dots, the sextuple CUT mutant with purple dots, and rescue lines with blue dots. Two-way ANOVA followed by Tukey’s multiple comparisons test, comparisons for CUT sextuple mutant vs Ex[neu::ceh-44] (F), and CUT sextuple mutant vs Ex[ubi::ceh-44] (G) indicated; **P < 0.01, ***P < 0.001. n ≥ 3 independent experiments (25 animals per independent experiment). Mean and SEM values are provided in Data S5B. (H) ASK-AIA GRASP signal for the ASK>AIA (otIs653) in wild-type (top) and CUT compound mutant (ceh-38(tm321); ceh-44(ot1028); otDf1) (bottom). Lateral views of L1 worm heads at the nerve ring level are shown. ASK axon is labelled with cytoplasmic mCherry. Arrowheads indicate GRASP GFP synaptic puncta. otIs653 and ceh-48 are located in the same chromosome (chr. IV) and cannot be recombined together. Quantification of puncta along the ASK axon in the nerve ring. The data are presented as individual values with each dot representing the number of puncta in one worm with the mean ± SEM indicated. Unpaired t-test, ***P < 0.001. n ≥ 18 for all genotypes. (I) HSN presynaptic specializations labeled by GFP-CLA-1 (cat-4prom::GFP::CLA-1[otIs788]) in wild-type (top) and CUT sextuple mutant (bottom). Lateral views of young adult worm heads at the nerve ring level are shown. Arrowheads indicate CLA-1 presynaptic specializations. Quantification of CLA-1 puncta along the HSN axon in the nerve ring. The data are presented as individual values with each dot representing the number of puncta in one worm with the mean ± SEM indicated. Unpaired t-test, ***P < 0.001. n ≥ 20 for all genotypes. See Figure S3 for overall nervous system anatomy. WT, wild-type; Scale bars 5 μm.
Figure 5.
Figure 5.. Transcriptional profiling of CUT sextuple mutants.
(A) Schematic and experimental design for INTACT sample collection, protocol, and data analysis for neuronal transcriptome profiling. (B) Volcano plot of differentially expressed genes in CUT sextuple mutant neurons showing significantly (FDR < 0.05) downregulated (blue) or upregulated (orange) genes (RNA-seq, n = 3). See Data S2A for full list of differentially expressed genes. (C) Diagrams showing overlap between differentially expressed genes in CUT sextuple mutant and genes bound by CEH-48 or CEH-38 in a wild-type ChIP-seq . Downregulated genes are marked in blue, upregulated genes are marked in orange, and the genes that contain CUT peaks are marked with dark circles within both clusters. See Figure S5 for effect on ubiquitously expressed genes containing CUT peaks. (D) Changes of previously described pan-neuronal gene battery in CUT sextuple mutant animals. The data are presented as the log2FoldChange ± standard error calculated by DESeq2, comparing neuronal samples from wild-type and CUT sextuple mutant. The two-stage step-up method of Benjamini, Krieger and Yekutieli (FDR 10%) was used to calculate the q-values for this subset of genes, analyzing the individual p-values obtained from the DESeq2 comparison. *Q < 0.05, **Q < 0.01, ***Q < 0.001 (RNA-seq, n = 3). (E) Vertical slices representation of the distribution (in percentage) of the downregulated and the upregulated gene sets between the neuronally enriched (green), neuronally depleted (purple) and equally expressed (gray) gene sets. See Data S3A–C for full list of neuronally enriched and depleted genes. See Figure S6 for the validation of pan-neuronal expression of a neuronally-enriched CUT gene target. (F-G) GO enrichment analysis (F) and phenotype enrichment analysis (G) using gene sets of significantly downregulated (blue) or upregulated (orange) transcripts. Graphs illustrate the 10 most significant terms. Analysis performed using the Gene Set Enrichment Analysis Tool from Wormbase. See Data S4A–D for full list of enriched terms. WT, wild-type.
Figure 6.
Figure 6.. CUT genes cooperate with terminal selectors to control pan-neuronal gene expression.
(A) Illustration for how terminal selectors contribute to the regulation of pan-neuronal gene expression. (B-H) Expression of ric-4(syb2878[ric-4::GFP]) (ric-4(syb2878[ric-4::T2A-3xNLS-GFP])) in wild-type (top left), terminal selector mutant (unc-86(ot1184) (B-F), ceh-14(ot1185) (G) or unc-30(ot1186) (H); top right), CUT sextuple mutant (bottom left), and compound terminal selector and CUT sextuple mutant (bottom right). Lateral views of the head (B), midbody (C-E, H) and tail (F and G) are shown. All images correspond to worms at the L4 larval stage, except for HSN (E) where young adults are shown. Quantification of ric-4(syb2878[ric-4::T2A-3xNLS-GFP]) fluorescence intensity in individual neurons. The data are presented as individual values with each dot representing the expression level of NSM (B), BDU (C), ALM (D), HSN (E), PLM (F), PHA, PHB, PVC (G), DD4, or VD8 (H) neuron, with the mean ± SEM indicated. Wild-type data is represented with black dots, terminal selector mutants with green dots, the sextuple CUT mutant with purple dots, and compound terminal selector and CUT sextuple mutant with yellow dots. One-way ANOVA followed by Tukey’s multiple comparisons test; *P < 0.05, **P < 0.01, ***P < 0.001. n ≥ 8 for all genotypes. (I) Expression of ric-4(syb2878[ric-4::T2A-3xNLS-GFP]) in wild-type (top), CUT sextuple mutant (middle), and upon mutation of HOX and terminal selector binding sites on the ric-4 endogenous locus in a CUT sextuple mutant background (bottom). Individual mutation of the HOX (ric-4(ot1182 syb2878)) or terminal selector binding sites (ric-4(ot1181 syb2878)) has no effect on ric-4(syb2878[ric-4::T2A-3xNLS-GFP]) expression, but the expression is reduced in posterior ventral nerve cord (VNC) neurons when binding site mutations are combined (ric-4(ot1183 ot1181 syb2878)). Lateral views of the posterior VNC in L4 worms are shown. Quantification of ric-4(syb2878[ric-4::T2A-3xNLS-GFP]) fluorescence intensity in posterior VNC neurons. The data are presented as individual values with each dot representing the expression level of one worm with the mean ± SEM indicated. Wild-type data is represented with black dots, the sextuple CUT mutant with purple dots, the sextuple mutant with individual binding sites mutated with red dots, and the sextuple mutant with both binding sites mutated with gray dots. One-way ANOVA followed by Tukey’s multiple comparisons test; *P < 0.05, **P < 0.01, ***P < 0.001. n ≥ 9 for all genotypes. WT, wild-type; a.u., arbitrary units. Scale bars 5 μm.

References

    1. Hobert O, Carrera I, and Stefanakis N (2010). The molecular and gene regulatory signature of a neuron. Trends in neurosciences 33, 435–445. S0166–2236(10)00082–2 [pii] 10.1016/j.tins.2010.05.006. - DOI - PMC - PubMed
    1. Taylor SR, Santpere G, Weinreb A, Barrett A, Reilly MB, Xu C, Varol E, Oikonomou P, Glenwinkel L, McWhirter R, et al. (2021). Molecular topography of an entire nervous system. Cell 184, 4329–4347 e4323. 10.1016/j.cell.2021.06.023. - DOI - PMC - PubMed
    1. Stefanakis N, Carrera I, and Hobert O (2015). Regulatory Logic of Pan-Neuronal Gene Expression in C. elegans. Neuron 87, 733–750. 10.1016/j.neuron.2015.07.031. - DOI - PMC - PubMed
    1. Hobert O (2016). Terminal Selectors of Neuronal Identity. Curr Top Dev Biol 116, 455–475. 10.1016/bs.ctdb.2015.12.007. - DOI - PubMed
    1. Qiu Z, and Ghosh A (2008). A brief history of neuronal gene expression: regulatory mechanisms and cellular consequences. Neuron 60, 449–455. 10.1016/j.neuron.2008.10.039. - DOI - PubMed

Publication types

MeSH terms

Substances