. 2022 Dec;60(1):589-599.
doi: 10.1080/13880209.2022.2039722.

Epigallocatechin-3- O-gallate promotes extracellular matrix and inhibits inflammation in IL-1β stimulated chondrocytes by the PTEN/miRNA-29b pathway

Affiliations

Epigallocatechin-3- O-gallate promotes extracellular matrix and inhibits inflammation in IL-1β stimulated chondrocytes by the PTEN/miRNA-29b pathway

Dong Yang et al. Pharm Biol. 2022 Dec.

Abstract

Context: Epigallocatechin-3-O-gallate (EGCG) exhibits anti-arthritic activity. MiR-29b-3p provokes chondrocyte apoptosis and promotes the initiation and development of osteoarthritis (OA).

Objective: To explore the roles of EGCG and miR-29b-3p in interleukin-1β (IL-1β)-stimulated chondrocytes.

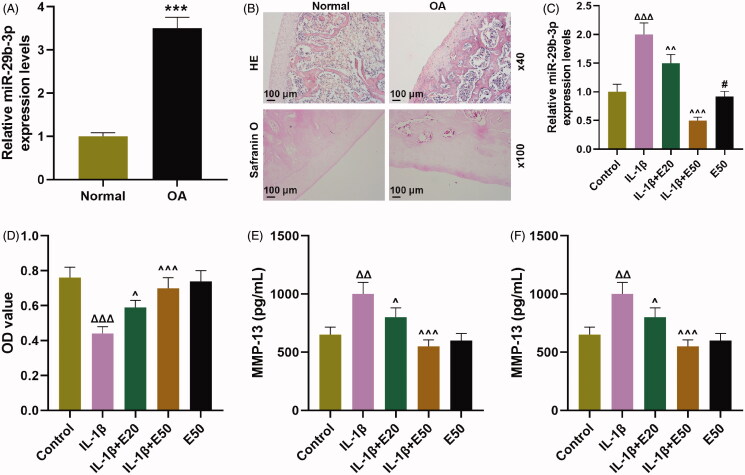
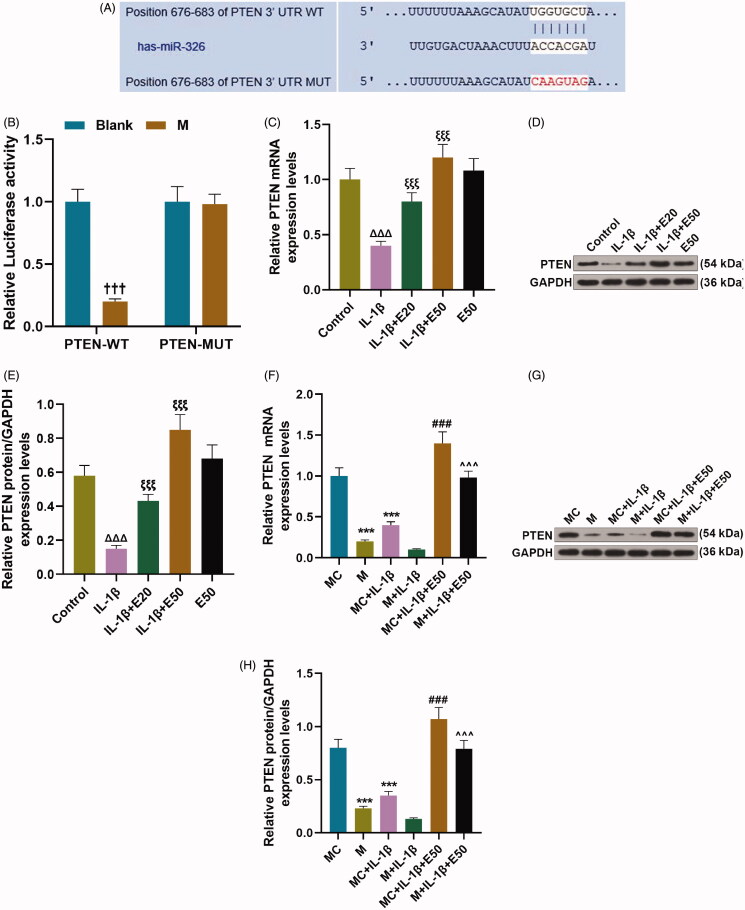
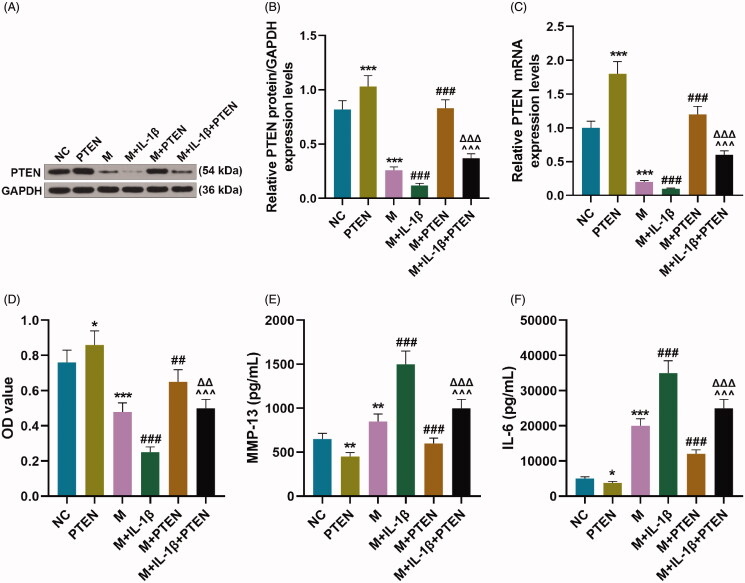
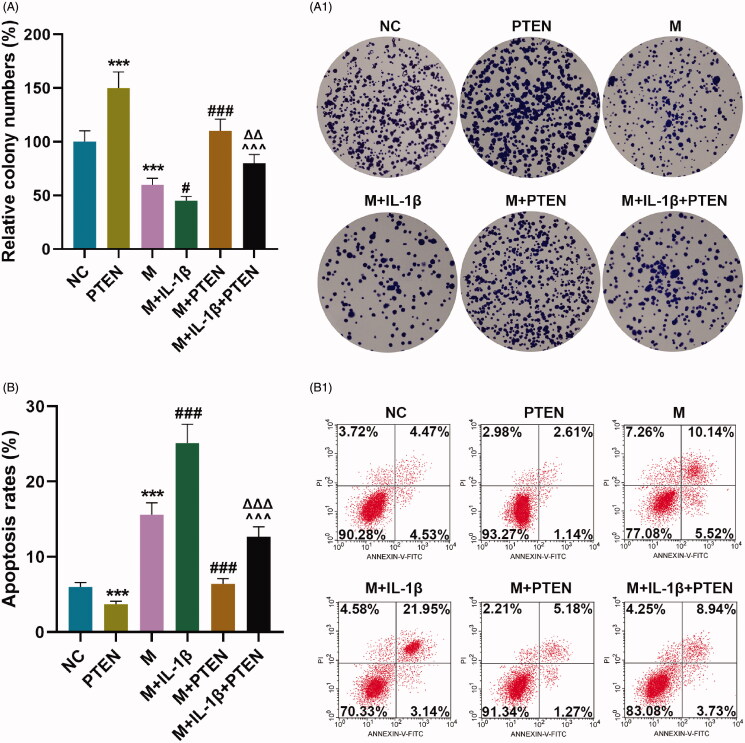
Materials and methods: HE and Safranin O staining were used to detect the pathological changes of cartilage tissue in OA patients and healthy people. OA-like chondrocyte injury was mimicked by 5 ng/mL IL-1β stimulation for 24 h in vitro, and after transfection with miR-29b-3p mimics and pcDNA-PTEN, IL-1β-stimulated chondrocytes were pre-treated with EGCG (20 and 50 μM) for 2 h. Cell viability, colony numbers, apoptosis rate, the levels of IL-6 and matrix metalloproteinase-13 (MMP-13), miR-19b-3p, PTEN and apoptosis-associated proteins in chondrocytes were evaluated.

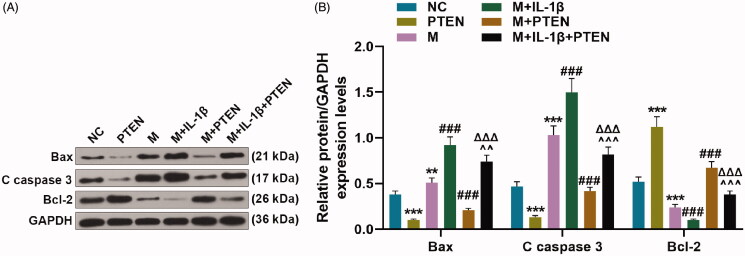
Results: MiR-29b-3p level was upregulated in cartilage tissues of OA patients (3.5-fold change, p < 0.001) and IL-1β stimulated chondrocytes (two fold change, p < 0.001). The matrix staining was weakened and unevenly distributed, and the chondrocytes were arranged disorderly in the tissues of patients with OA. EGCG (20 and 50 μM) increases viability and decreases the levels of miR-29b-3p and MMP-13 and IL-6 in IL-1β stimulated chondrocytes (p < 0.05). MiR-29b-3p mimics reversed the effects above 50 μM EGCG (p < 0.05). Furthermore, PTEN overexpression abrogated the effects of miR-29b-3p mimics on viability, colony numbers, apoptosis rate and the levels of Bcl-2, MMP-13, IL-6, Bax and cleaved caspase 3 in IL-1β-stimulated chondrocytes (p < 0.01).

Discussion and conclusions: EGCG is a potential candidate for the treatment of OA, which also can be explored in a novel therapeutic method for other degenerative or inflammatory disorders.

Keywords: Epigallocatechin-3-O-gallate; miR-29b-3p; osteoarthritis (OA).


Conflict of interest statement

The authors declare no conflicts of interest.

Figures

Figure 1.
Figure 1.
EGCG inhibited the levels of miR-29b-3p, MMP-13 and IL-6β but promoted cell viability on IL-1β-stimulated CHON-001 cells. (A) MiR-29b-3p expression in OA tissues and normal tissue was detected by qRT-PCR. (B) HE and Safranin O staining were used to detect the pathological changes of cartilage tissue in OA patients and healthy people. (C) The level of miR-29b-3p was determined by qRT-PCR in CHON-001 cells. (D) Cell counting kit-8 (CCK-8) indicated cell viability in CHON-001 cells. (E, F) The levels of MMP-13 and IL-6 were determined by ELISA in CHON-001 cells. U6 was used as a reference gene for miRNA. EGCG: epigallocatechin-3-O-gallate; EGCG20: 20 μM EGCG; EGCG50: 50 μM EGCG; qRT-PCR: real-time reverse transcription polymerase chain reaction; ELISA: enzyme-linked immunosorbent assay; control: CHON-001 cells cultured without IL-1β or EGCG. ΔΔΔp < 0.001 vs. control; p < 0.05 or ∧∧p < 0.01 or ∧∧∧p < 0.001 vs. IL-1β. All measurements were performed at least three times. Data were presented as the means ± standard deviation (SD).
Figure 2.
Figure 2.
EGCG inhibited the levels of miR-29b-3p, MMP-13 and IL-6β but promoted cell viability in IL-1β-stimulated CHON-001 cells by the down-regulation of miR-29b-3p. (A) CHON-001 cells were divided into control, MC, M, MC + E50 and M + E50 groups. (B–E) CHON-001 cells were divided into control, IL-1β, MC, M, MC + IL-1β, M + IL-1β, MC + IL-1β + E50 and M + IL-1β + E50 groups. (A, B) The level of miR-29b-3p was determined by qRT-PCR in CHON-001 cells. (C) Cell counting kit-8 (CCK-8) indicated cell viability in CHON-001 cells. (D, E) The levels of MMP-13 and IL-6 were determined by ELISA in CHON-001 cells. U6 was used as a reference gene for miRNA. EGCG: epigallocatechin-3-O-gallate; E50: 50 μM EGCG; MC: mimics control; M: miR-29b-3p mimics; qRT-PCR: real-time reverse transcription polymerase chain reaction; control: CHON-001 cells cultured without IL-1β or EGCG. ΔΔΔp < 0.001 vs. control; **p < 0.01 or ***p < 0.001 vs. MC; †††p < 0.001 vs. M; ∧∧p < 0.001 vs. M + IL-1β. All measurements were performed at least three times. Data were presented as the means ± standard deviation (SD).
Figure 3.
Figure 3.
EGCG indirectly increased phosphatase and tensin homolog (PTEN) expression via decreasing miR-29b-3p in IL-1β-stimulated CHON-001 cells. (A, B) The binding relationship between miR-29b-3p and PTEN was predicted by TargetScan V7.2 (A) and verified by dual-luciferase reporter assay (B). (C–E) CHON-001 cells were divided into control, IL-1β, IL-1β + E20, IL-1β + E50 and E50 groups. The protein (C, D) and mRNA (E) levels of PTEN in CHON-001 cells were determined by qRT-PCR and Western blot, respectively. (F–H) CHON-001 cells were divided into MC, M, MC + IL-1β, M + IL-1β, MC + IL-1β + E50 and M + IL-1β + E50 groups. The protein (F, G) and mRNA (H) levels of PTEN in CHON-001 cells were determined by qRT-PCR and Western blot, respectively. GAPDH was used as the internal reference control for PTEN. EGCG: epigallocatechin-3-O-gallate; E50: 50 μM EGCG; MC: mimics control; M: miR-29b-3p mimics; qRT-PCR: real-time reverse transcription polymerase chain reaction; control: CHON-001 cells cultured without IL-1β or EGCG. †††p < 0.001 vs. blank; ΔΔΔp < 0.001 vs. control; ξξξp < 0.001 vs. IL-1β; **p < 0.01 or ***p < 0.001 vs. MC; ∧∧∧p < 0.001 vs. M + IL-1β. All measurements were performed at least three times. Data were presented as the means ± standard deviation (SD).
Figure 4.
Figure 4.
Overexpressed miR-29b-3p affected viability and the levels of MMP-13 and IL-6 of IL-1β-stimulated CHON-001 cells via down-regulating PTEN. (A–F) CHON-001 cells were divided into NC, PTEN, M, M + IL-1β, M + PTEN and M + IL-1β + PTEN groups. The protein (A, B) and mRNA (C) levels of PTEN in CHON-001 cells were determined by Western blot and qRT-PCR, respectively. (D) Cell counting kit-8 (CCK-8) assay indicated viability of CHON-001 cells. (E, F) The levels of MMP-13 and IL-6 were determined by ELISA in CHON-001 cells. GAPDH was used as the internal reference control for PTEN. MC: mimics control; M: miR-29b-3p mimics; qRT-PCR: real-time reverse transcription polymerase chain reaction; ELISA: enzyme-linked immunosorbent assay. *p < 0.05 or **p < 0.01 or ***p < 0.001 vs. NC; ∧∧∧p < 0.001 vs. M + IL-1β; ΔΔΔp < 0.001 vs. M + PTEN. All measurements were performed at least three times. Data were presented as the means ± standard deviation (SD).
Figure 5.
Figure 5.
Overexpressed miR-29b-3p inhibited proliferation and promoted apoptosis in IL-1β-stimulated CHON-001 cells via down-regulating PTEN. (A, B) CHON-001 cells were divided into NC, PTEN, M, M + IL-1β, M + PTEN and M + IL-1β + PTEN groups. Colony numbers (A) and apoptosis rate (B) of CHON-001 cells were determined by colony formation and flow cytometry assays, respectively. MC: mimics control; M: miR-29b-3p mimics; NC: negative control. ***p < 0.001 vs. NC; #p < 0.05 or ###p < 0.001 vs. M; ∧∧∧p < 0.001 vs. M + IL-1β; ΔΔp < 0.01 or ΔΔΔp < 0.001 vs. M + PTEN. All measurements were performed at least three times. Data are presented as the means ± standard deviation (SD).
Figure 6.
Figure 6.
Overexpressed miR-29b-3p regulated the expression of apoptosis-related proteins in IL-1β-stimulated CHON-001 cells via down-regulating PTEN. (A, B) CHON-001 cells was divided into NC, PTEN, M, M + IL-1β, M + PTEN and M + IL-1β + PTEN groups. The expression of apoptosis-related proteins (Bax, cleaved (C) caspase 3 and Bcl-2) were determined by Western blot. GAPDH was used as the internal reference control for PTEN. MC: mimics control; M: miR-29b-3p mimics; NC: negative control. **p < 0.01 or ***p < 0.001 vs. NC; ###p < 0.001 vs. M; ∧∧p < 0.01 or ∧∧∧p < 0.001 vs. M + IL-1β; ΔΔΔp < 0.001 vs. M + PTEN. All measurements were performed at least three times. Data are presented as the means ± standard deviation (SD).

Similar articles

Cited by

References

    1. Ahmed S, Rahman A, Hasnain A, Lalonde M, Goldberg VM, Haqqi TM.. 2002. Green tea polyphenol epigallocatechin-3-gallate inhibits the IL-1 beta-induced activity and expression of cyclooxygenase-2 and nitric oxide synthase-2 in human chondrocytes. Free Radic Biol Med. 33(8):1097–1105. - PubMed
    1. Ahmed S, Wang N, Lalonde M, Goldberg VM, Haqqi TM.. 2004. Green tea polyphenol epigallocatechin-3-gallate (EGCG) differentially inhibits interleukin-1 beta-induced expression of matrix metalloproteinase-1 and -13 in human chondrocytes. J Pharmacol Exp Ther. 308(2):767–773. - PubMed
    1. Akhtar N, Haqqi TM.. 2011. Epigallocatechin-3-gallate suppresses the global interleukin-1beta-induced inflammatory response in human chondrocytes. Arthritis Res Ther. 13(3):R93. - PMC - PubMed
    1. Bobinac D, Spanjol J, Zoricic S, Maric I.. 2003. Changes in articular cartilage and subchondral bone histomorphometry in osteoarthritic knee joints in humans. Bone. 32(3):284–290. - PubMed
    1. Cao J, Zhang Y, Wang T, Li B.. 2018. Endoplasmic reticulum stress is involved in baicalin protection on chondrocytes from patients with osteoarthritis. Dose Response. 16(4):1559325818810636. - PMC - PubMed

MeSH terms