. 2022 Mar 9;20(1):60.
doi: 10.1186/s12915-022-01264-9.

Hematopoietic differentiation is characterized by a transient peak of entropy at a single-cell level

Affiliations

Hematopoietic differentiation is characterized by a transient peak of entropy at a single-cell level

Charles Dussiau et al. BMC Biol. .

Abstract

Background: Mature blood cells arise from hematopoietic stem cells in the bone marrow by a process of differentiation along one of several different lineage trajectories. This is often represented as a series of discrete steps of increasing progenitor cell commitment to a given lineage, but as for differentiation in general, whether the process is instructive or stochastic remains controversial. Here, we examine this question by analyzing single-cell transcriptomic data from human bone marrow cells, assessing cell-to-cell variability along the trajectories of hematopoietic differentiation into four different types of mature blood cells. The instructive model predicts that cells will be following the same sequence of instructions and that there will be minimal variability of gene expression between them throughout the process, while the stochastic model predicts a role for cell-to-cell variability when lineage commitments are being made.

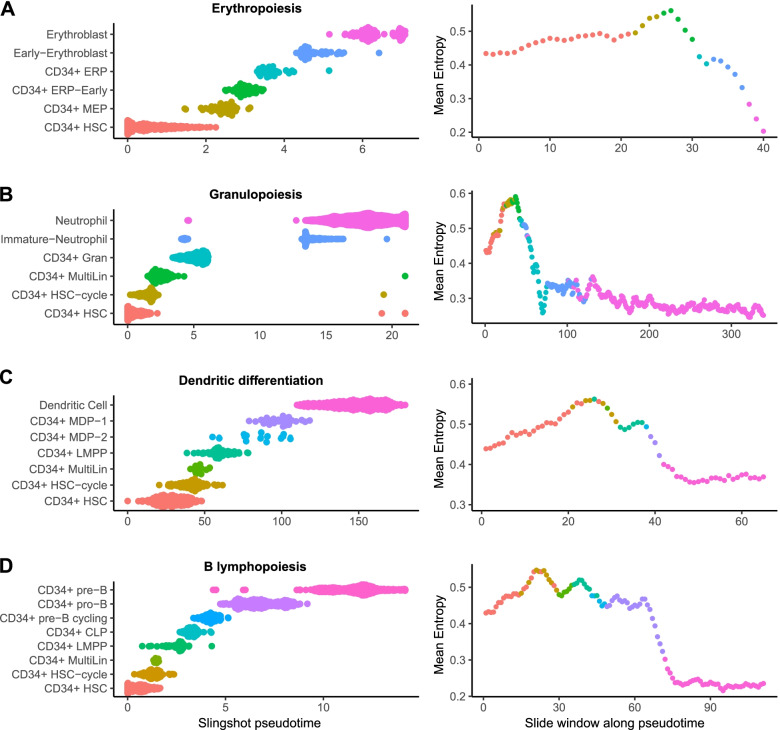
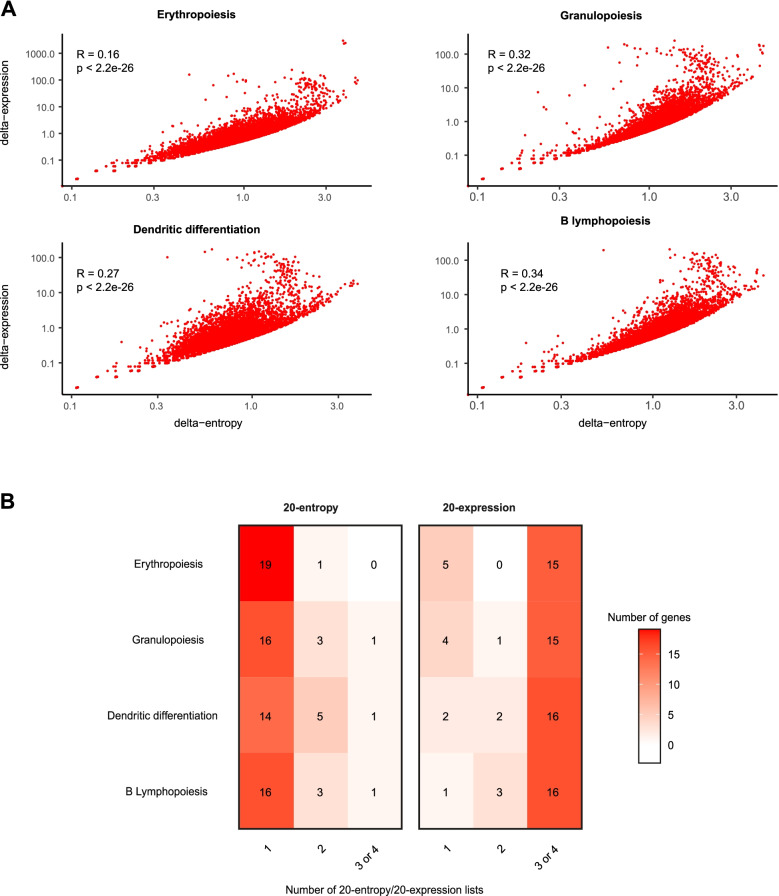
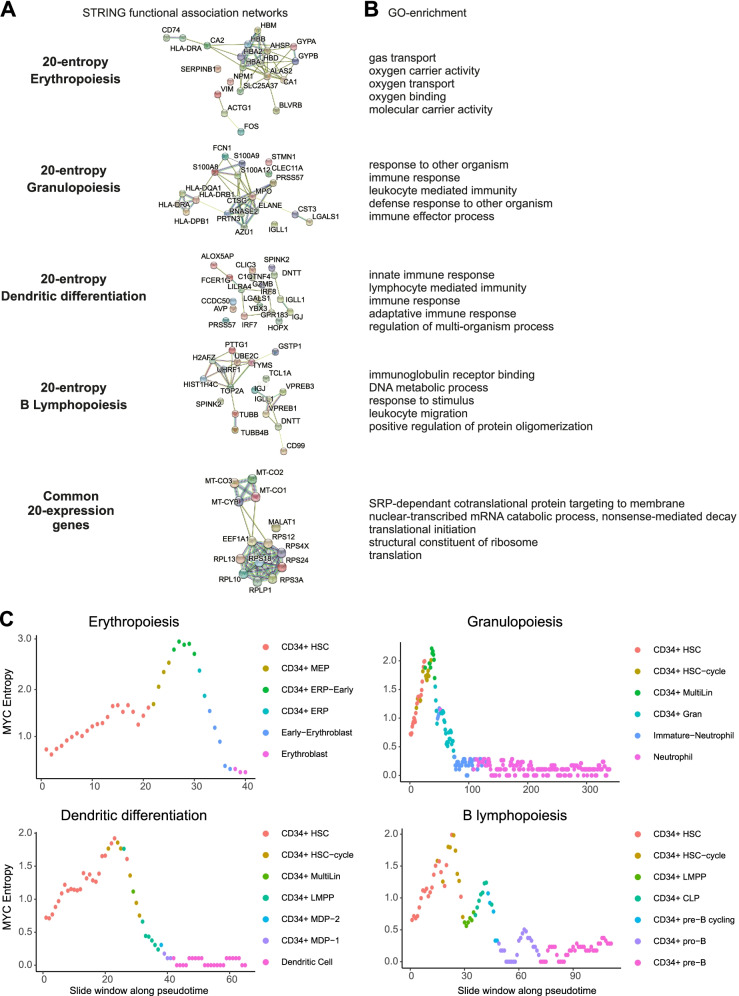
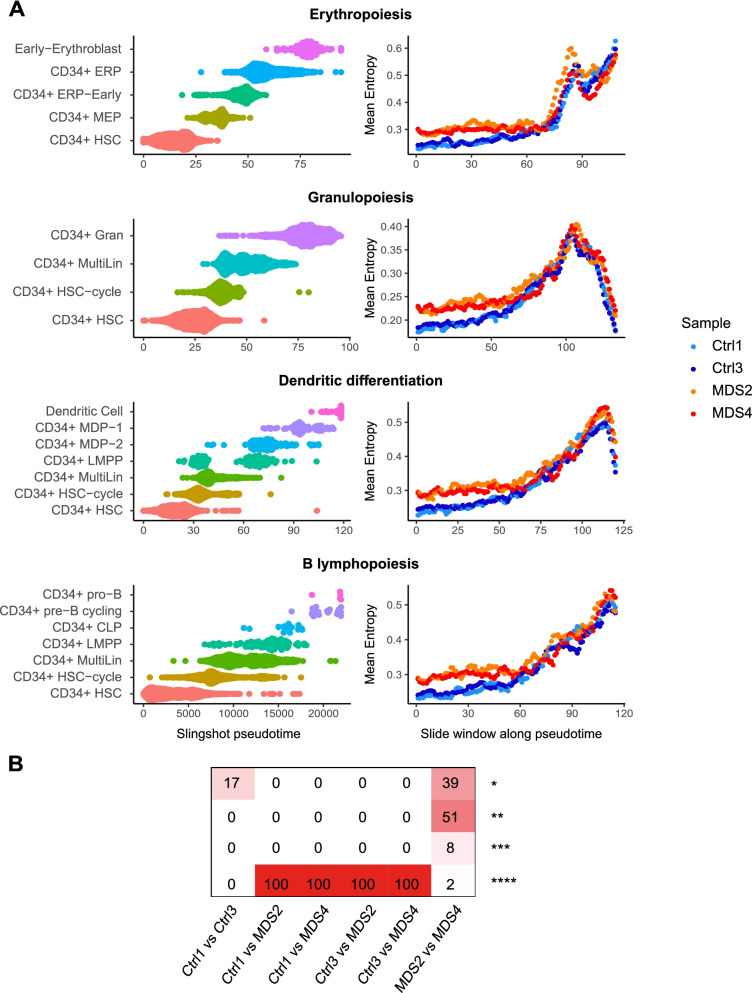
Results: Applying Shannon entropy to measure cell-to-cell variability among human hematopoietic bone marrow cells at the same stage of differentiation, we observed a transient peak of gene expression variability occurring at characteristic points in all hematopoietic differentiation pathways. Strikingly, the genes whose cell-to-cell variation of expression fluctuated the most over the course of a given differentiation trajectory are pathway-specific genes, whereas genes which showed the greatest variation of mean expression are common to all pathways. Finally, we showed that the level of cell-to-cell variation is increased in the most immature compartment of hematopoiesis in myelodysplastic syndromes.

Conclusions: These data suggest that human hematopoietic differentiation could be better conceptualized as a dynamical stochastic process with a transient stage of cellular indetermination, and strongly support the stochastic view of differentiation. They also highlight the need to consider the role of stochastic gene expression in complex physiological processes and pathologies such as cancers, paving the way for possible noise-based therapies through epigenetic regulation.

Keywords: Cell-to-cell variability; Entropy; Hematopoiesis; Myelodysplastic syndromes; Single-cell RNA-seq.


Conflict of interest statement

The authors declare that they have no competing interests.

Figures

Fig. 1
Fig. 1
Evolution of cell-to-cell gene expression variability during the main pathways of normal hematopoietic differentiation (HBM1). Cell populations belonging to each differentiation pathway were first selected and then ordered according to the pseudotime calculated by Slingshot. The average intercellular entropy of all genes was then calculated on a sliding window of 50 cells which moves across the pseudotime with a step of 10 cells (the color of each point on the graph correspond to the nature of the first cell in the corresponding sliding window). A Erythropoiesis. B Granulopoiesis. C Dendritic differentiation. D B lymphopoiesis
Fig. 2
Fig. 2
Delta-entropic and delta-expressed genes along hematopoietic differentiation (HBM1). A For each gene (red dots on the graphs), delta-expression is represented as a function of delta-entropy (logarithmic scale), in the 4 different hematopoiesis differentiation pathways. B Overlay between the different lists. Among the 20 genes that are the most delta-entropic within the erythropoietic pathway, only 1 was also appearing in the most delta-entropic in another differentiation pathway. On the contrary, among the 20 genes with the highest delta-expression in the granulopoiesis pathway, 15 were also appearing in the 20-expression lists in at least two other differentiation pathways
Fig. 3
Fig. 3
Functional association network and functional enrichment studies of 20-entropy and 20-expression gene lists. Analysis of the interaction networks (A) and GO functional enrichment (B) of the 20-entropy gene lists and common 20-expression genes with STRING algorithm. For each pathway, only the first five GO terms with a false discovery rate (FDR) lower than 0.05 were represented. C Cell-to-cell MYC expression variability during the main pathways of normal hematopoietic differentiation (HBM1)
Fig. 4
Fig. 4
Evolution of cell-to-cell gene expression variability during hematopoiesis in elderly subjects and SF3B1-mutated MDS. A For each differentiation pathway, a common pseudotime was calculated on the integrated gene cell matrix of the 4 samples. A sub-sampling was performed to have the same number of cells in each cell type per sample. The average intercellular entropy of all genes was then calculated individually for each patient on a sliding window of 50 cells advancing with a step of 10 cells on the common pseudotime. B Intercellular entropy of all genes was calculated on a subsample of 700 HSCs of healthy elderly patients and SF3B1-mutated MDS. A Wilcoxon assay was used to compare the mean intercellular entropy between samples. This was repeated 100 times. Shown is the number of times the resulting test gave a certain level of p-value: *p < 0.05, **p < 0.01, ***p < 0.001, ****p < 0.0001. In 100% of the subsamples, the difference in the mean intercellular entropy between control and MDS patients was very highly significant (p < 0.0001)

References

    1. Raj A, van Oudenaarden A. Nature, nurture, or chance: stochastic gene expression and its consequences. Cell. 2008;135(2):216–226. - PMC - PubMed
    1. Laurenti E, Göttgens B. From haematopoietic stem cells to complex differentiation landscapes. Nature. 2018;553(7689):418–426. - PMC - PubMed
    1. Kato H, Igarashi K. To be red or white: lineage commitment and maintenance of the hematopoietic system by the “inner myeloid.”. Haematologica. 2019;104(10):1919–1927. - PMC - PubMed
    1. Brown G, Ceredig R. Modeling the hematopoietic landscape. Front Cell Dev Biol. 2019;7:104. - PMC - PubMed
    1. Rieger MA, Hoppe PS, Smejkal BM, Eitelhuber AC, Schroeder T. Hematopoietic cytokines can instruct lineage choice. Science. 2009;325(5937):217–218. - PubMed

Publication types