

Modeling strategies for the allocation of SARS-CoV-2 vaccines in the United States
- PMID: 35260267
- PMCID: PMC8818403
- DOI: 10.1016/j.vaccine.2022.02.015
Modeling strategies for the allocation of SARS-CoV-2 vaccines in the United States
Abstract
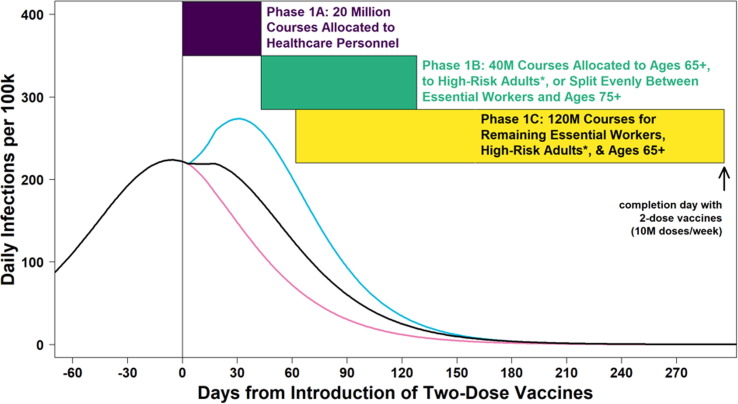
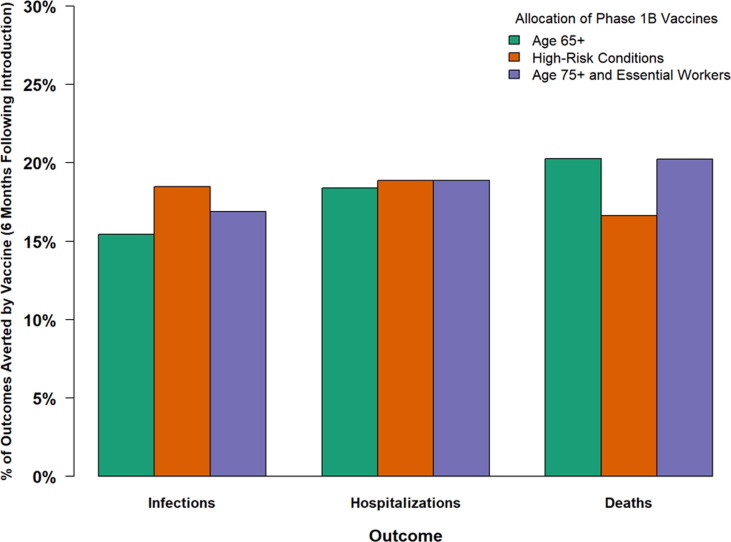
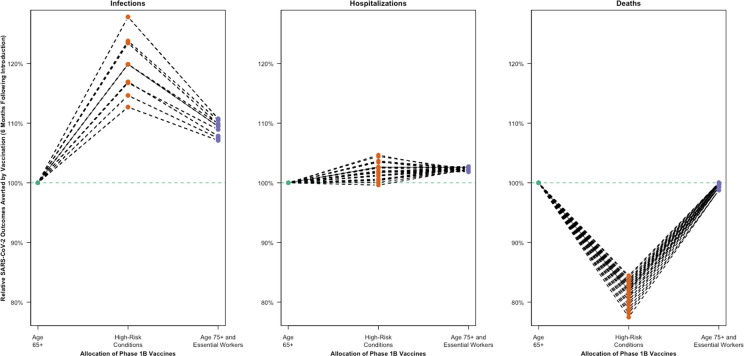
The Advisory Committee on Immunization Practices (ACIP) recommended phased allocation of SARS-CoV-2 vaccines in December 2020. To support the development of this guidance, we used a mathematical model of SARS-CoV-2 transmission to evaluate the relative impact of three vaccine allocation strategies on infections, hospitalizations, and deaths. All three strategies initially prioritized healthcare personnel (HCP) for vaccination. Strategies of subsequently prioritizing adults aged ≥65 years, or a combination of essential workers and adults aged ≥75 years, prevented the most deaths. Meanwhile, prioritizing adults with high-risk medical conditions immediately after HCP prevented the most infections. All three strategies prevented a similar fraction of hospitalizations. While no model is capable of fully capturing the complex social dynamics which shape epidemics, exercises such as this one can be a useful way for policy makers to formalize their assumptions and explore the key features of a problem before making decisions.
Keywords: COVID-19; Mathematical Modeling; SARS-CoV-2; Vaccines.
Published by Elsevier Ltd.
Conflict of interest statement
Declaration of Competing Interest The authors declare that they have no known competing financial interests or personal relationships that could have appeared to influence the work reported in this paper.
Figures
Similar articles
-
Prevention and Control of Seasonal Influenza with Vaccines: Recommendations of the Advisory Committee on Immunization Practices, United States, 2021-22 Influenza Season.MMWR Recomm Rep. 2021 Aug 27;70(5):1-28. doi: 10.15585/mmwr.rr7005a1. MMWR Recomm Rep. 2021. PMID: 34448800 Free PMC article.
-
The Advisory Committee on Immunization Practices' Updated Interim Recommendation for Allocation of COVID-19 Vaccine - United States, December 2020.MMWR Morb Mortal Wkly Rep. 2021 Jan 1;69(5152):1657-1660. doi: 10.15585/mmwr.mm695152e2. MMWR Morb Mortal Wkly Rep. 2021. PMID: 33382671 Free PMC article.
-
Estimated Number of COVID-19 Infections, Hospitalizations, and Deaths Prevented Among Vaccinated Persons in the US, December 2020 to September 2021.JAMA Netw Open. 2022 Jul 1;5(7):e2220385. doi: 10.1001/jamanetworkopen.2022.20385. JAMA Netw Open. 2022. PMID: 35793085 Free PMC article.
-
Who should be prioritized for COVID-19 vaccination in China? A descriptive study.BMC Med. 2021 Feb 10;19(1):45. doi: 10.1186/s12916-021-01923-8. BMC Med. 2021. PMID: 33563270 Free PMC article.
-
Reflections on the Advisory Committee on Immunization Practices During the COVID-19 Pandemic.Acad Pediatr. 2024 Sep-Oct;24(7):1038-1046. doi: 10.1016/j.acap.2024.06.019. Epub 2024 Jul 6. Acad Pediatr. 2024. PMID: 38972350 Review.
Cited by
-
Incorporating social determinants of health into transmission modeling of COVID-19 vaccine in the US: a scoping review.Lancet Reg Health Am. 2024 Jun 7;35:100806. doi: 10.1016/j.lana.2024.100806. eCollection 2024 Jul. Lancet Reg Health Am. 2024. PMID: 38948323 Free PMC article.
-
Optimal allocation strategies for prioritized geographical vaccination for Covid-19.Physica A. 2022 Dec 1;607:128166. doi: 10.1016/j.physa.2022.128166. Epub 2022 Sep 6. Physica A. 2022. PMID: 36090308 Free PMC article.
-
Learning from the COVID-19 pandemic: A systematic review of mathematical vaccine prioritization models.Infect Dis Model. 2024 May 15;9(4):1057-1080. doi: 10.1016/j.idm.2024.05.005. eCollection 2024 Dec. Infect Dis Model. 2024. PMID: 38988830 Free PMC article. Review.
-
Covid19Vaxplorer: A free, online, user-friendly COVID-19 vaccine allocation comparison tool.PLOS Glob Public Health. 2024 Jan 22;4(1):e0002136. doi: 10.1371/journal.pgph.0002136. eCollection 2024. PLOS Glob Public Health. 2024. PMID: 38252671 Free PMC article.
-
Learning from the COVID-19 pandemic: a systematic review of mathematical vaccine prioritization models.medRxiv [Preprint]. 2024 Mar 7:2024.03.04.24303726. doi: 10.1101/2024.03.04.24303726. medRxiv. 2024. Update in: Infect Dis Model. 2024 May 15;9(4):1057-1080. doi: 10.1016/j.idm.2024.05.005. PMID: 38496570 Free PMC article. Updated. Preprint.
References
-
- Razzaghi H., Wang Y., Lu H., Marshall K.E., Dowling N.F., Paz-Bailey G., et al. Estimated county-level prevalence of selected underlying medical conditions associated with increased risk for severe COVID-19 illness - United States, 2018. MMWR Morb Mortal Wkly Rep. 2020;69(29):945–950. - PMC - PubMed
-
- 2019 Behavioral Risk Factor Surveillance System Data: Centers for Disease Control and Prevention; 2020.
-
- Guidance on the Essential Critical Infrastructure Workforce, Version 4.1: Cybersecurity and Infrastructure Security Agency; 2020.
-
- Industries at a Glance: Bureau of Labor Statistics; 2021. Available from: https://www.bls.gov/iag/.
MeSH terms
Substances
LinkOut - more resources
Full Text Sources
Medical
Miscellaneous
