. 2022 Mar;10(3):e003982.
doi: 10.1136/jitc-2021-003982.

Combination cancer immunotherapy targeting TNFR2 and PD-1/PD-L1 signaling reduces immunosuppressive effects in the microenvironment of pancreatic tumors

Affiliations

Combination cancer immunotherapy targeting TNFR2 and PD-1/PD-L1 signaling reduces immunosuppressive effects in the microenvironment of pancreatic tumors

Xiaozhen Zhang et al. J Immunother Cancer. 2022 Mar.

Erratum in

Abstract

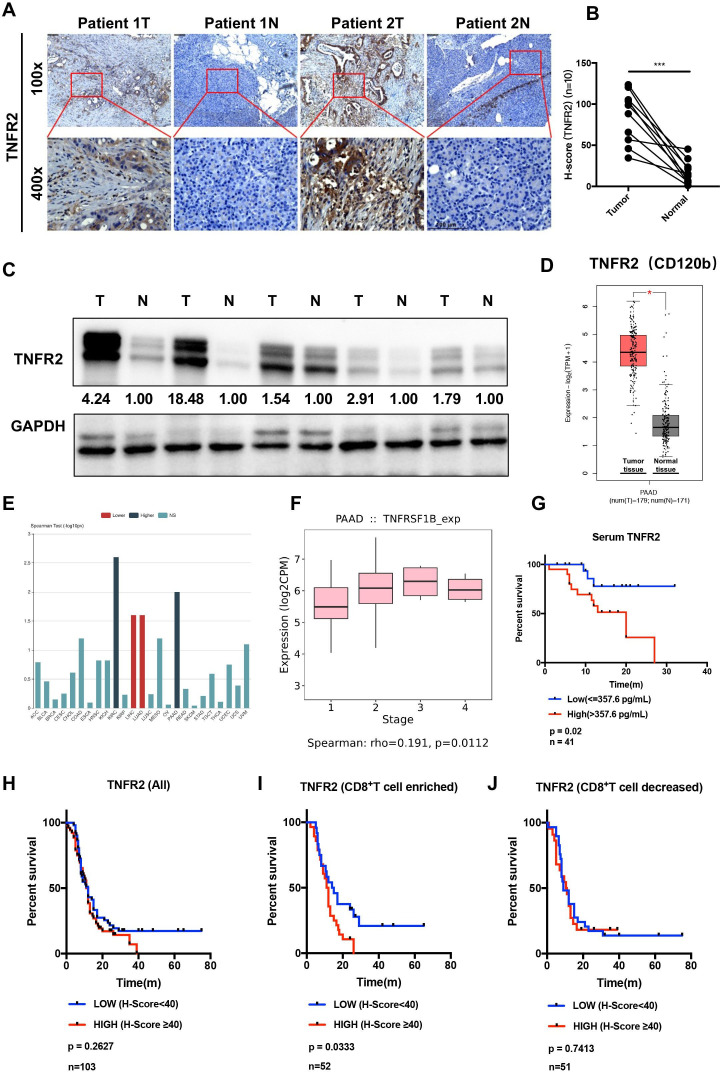
Backgrounds: In advanced pancreatic ductal adenocarcinoma (PDAC), immune therapy, including immune checkpoint inhibitors, has limited efficacy, encouraging the study of combination therapy.

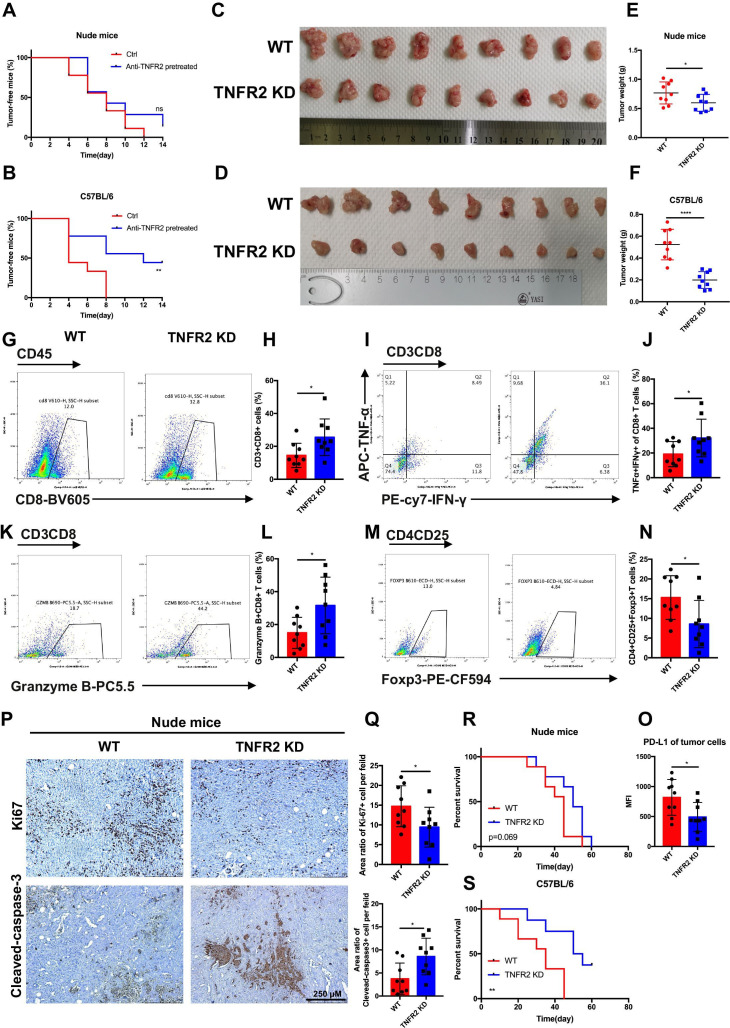
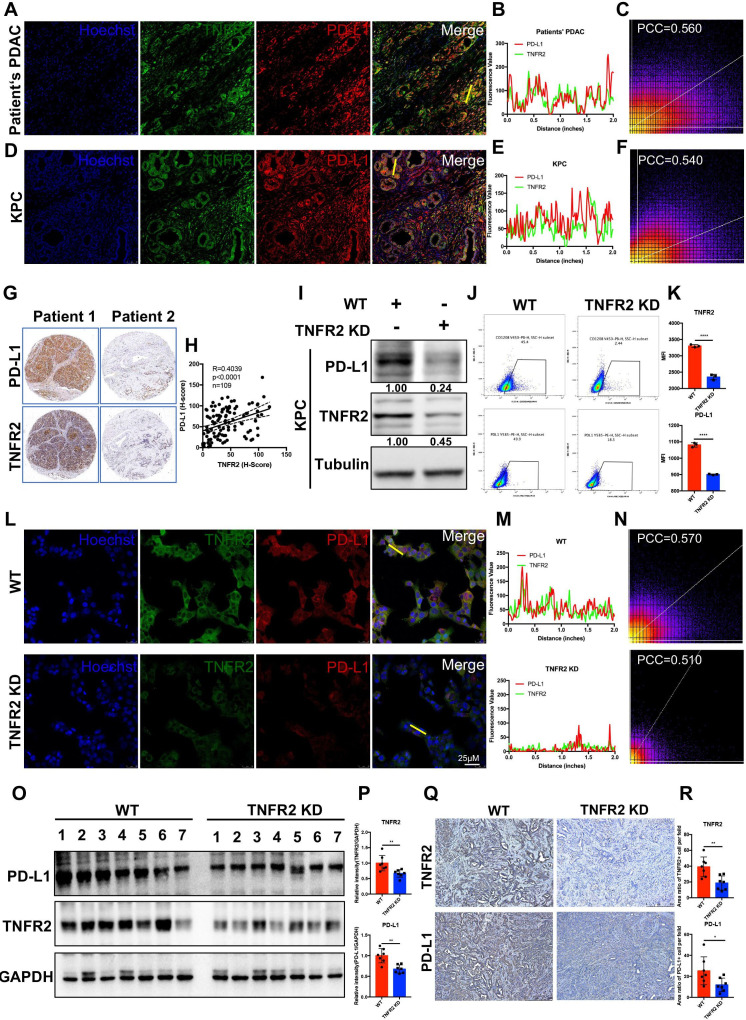
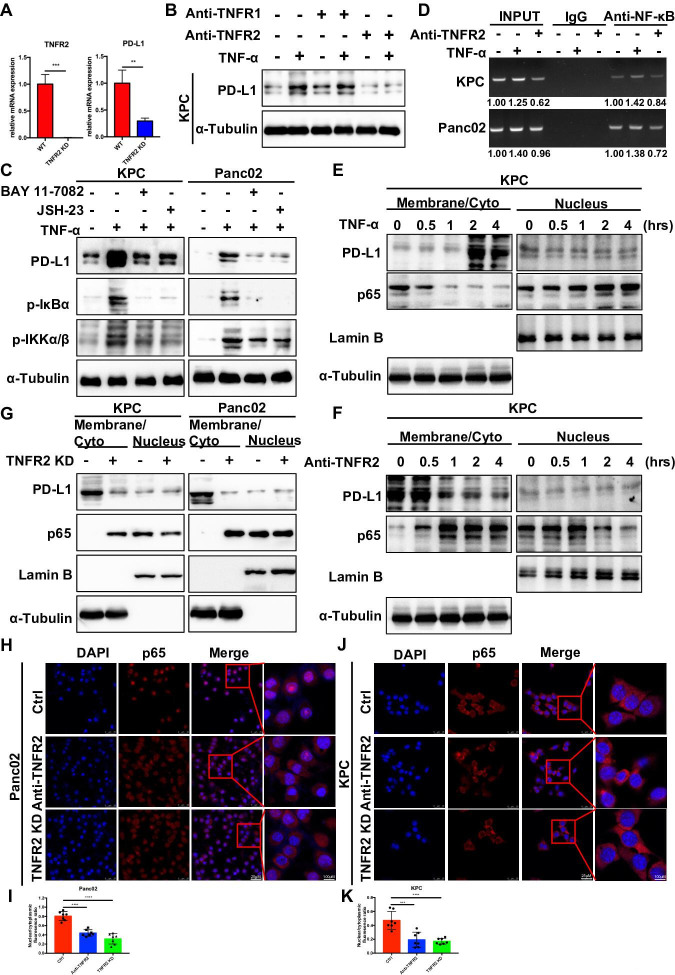
Methods: Tumor necrosis factor receptor 2 (TNFR2) was analyzed via immunohistochemistry, immunofluorescence, western blotting, and ELISAs. The in vitro mechanism that TNFR2 regulates programmed cell death 1 ligand 1 (PD-L1) was investigated using immunofluorescence, immunohistochemistry, flow cytometry, western blotting, and chromatin immunoprecipitation (ChIP). In vivo efficacy and mechanistic studies, using C57BL/6 mice and nude mice with KPC cell-derived subcutaneous and orthotopic tumors, employed antibodies against TNFR2 and PD-L1. Survival curves were constructed for the orthotopic model and a genetically engineered PDAC model (LSL-KrasG12D/+; LSL-Trp53R172H/+; Pdx1-Cre). Mass cytometry, immunohistochemistry, and flow cytometry analyzed local and systemic alterations in the immunophenotype.

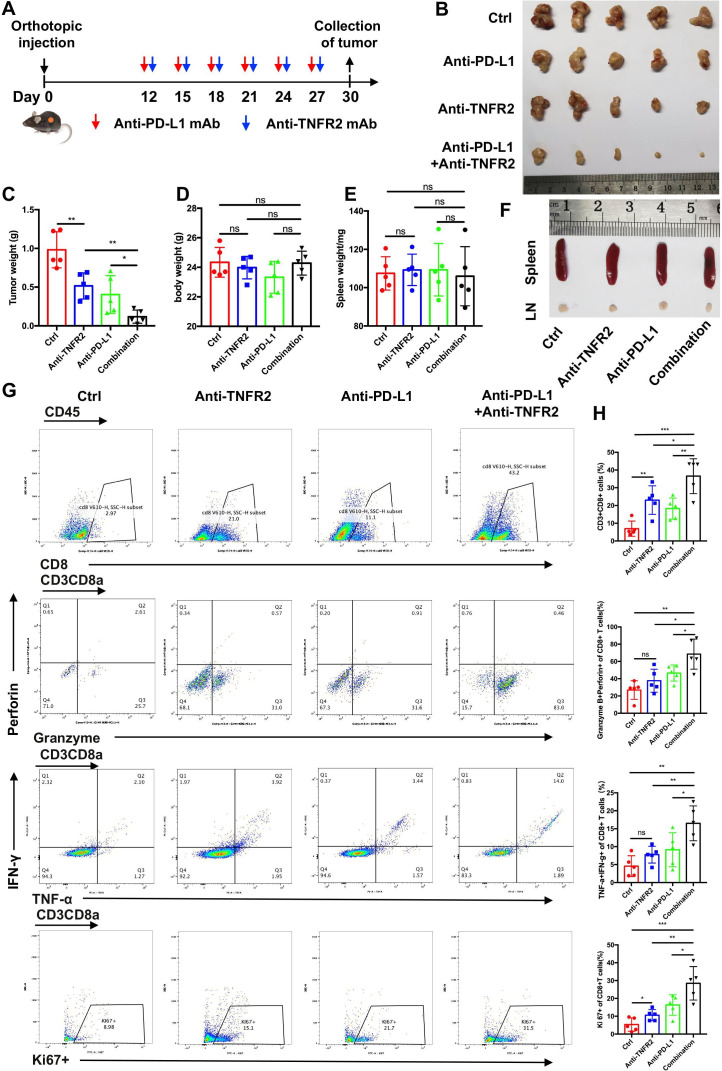
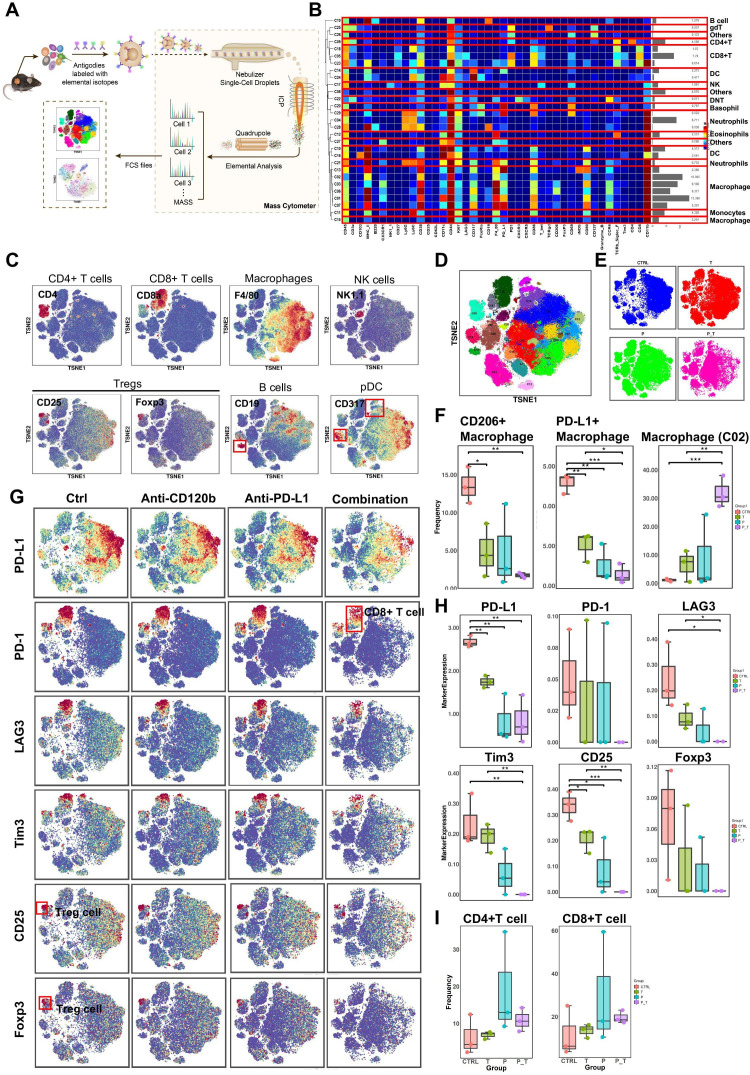
Results: TNFR2 showed high expression and is a prognostic factor in CD8+ T cell-enriched pancreatic cancer. TNFR2 promotes tumorigenesis and progression of pancreatic cancer via dual effect: suppressing cancer immunogenicity and partially accelerating tumor growth. TNFR2 positivity correlated with PD-L1, and in vitro and in vivo, it could regulate the expression of PDL1 at the transcription level via the p65 NF-κB pathway. Combining anti-TNFR2 and PD-L1 antibodies eradicated tumors, prolonged overall survival in pancreatic cancer, and induced strong antitumor immune memory and secondary prevention by reducing the infiltration of Tregs and tumor-associated macrophages and inducing CD8+ T cell activation in the PDAC microenvironment. Finally, the antitumor immune response derived from combination therapy is mainly dependent on CD8+ T cells, partially dependent on CD4+ T cells, and independent of natural killer cells.

Conclusions: Anti-TNFR2 and anti-PD-L1 combination therapy eradicated tumors by inhibiting their growth, relieving tumor immunosuppression, and generating robust memory recall.

Keywords: B7-H1 antigen; biomarkers; gastrointestinal neoplasms; immunotherapy; tumor.


Conflict of interest statement

Competing interests: None declared.

Figures

Figure 1
Figure 1. The expression and prognostic analysis of TNFR2 in pancreatic ductal adenocarcinoma (PDAC). (A–C) The expression profile of TNFR2 in pancreatic cancer was detected in paired tumor and normal pancreatic tissues by IHC staining (n=10) (A and B) and western blotting analysis (n=5) (C) (N, normal pancreatic tissue; T, pancreatic tumor tissue). Scale bars: 100 µm. (D) The relative TNFR2 expression in pancreatic cancer and normal pancreatic tissues was analyzed using large-scale RNA-seq datasets of PDAC from the TCGA database (n=350). (E–F) Association between the expression of TNFR2 and tumor stage using large-scale RNA-Seq datasets of PDAC from the TCGA database. (G) Overall survival (OS) of patients with pancreatic cancer with high or low concentrations of TNFR2 in their serum (n=41). (H–J) Overall survival (OS) of patients with all pancreatic cancer (H), enriched with CD8+ T cells (I) and decreased with CD8+ T cells (J), with high or low expression of TNFR2. IHC, immunohistochemistry; TCGA, The Cancer Genome Atlas; TNFR2, tumor necrosis factor receptor 2.
Figure 2
Figure 2. TNFR2 promotes tumorigenesis and the development of pancreatic cancer by suppressing cancer immunogenicity and partially accelerating tumor growth. (A and B) Pancreatic cancer cells (KPC), with or without pretreatment with anti-TNFR2 antibody (200 µg/2×106 cells, 24 hours), were inoculated subcutaneously and separately into the immunocompetent and immunodeficient mice (n=7). Tumor incidence was recorded at the indicated times. (C–F) The visual maps of tumors and tumor weight of the immunocompetent and immunodeficient mice are shown; n=9 mice per group. (G–N) Representative images and statistical results of tumor-infiltrating lymphocytes (CD8+ T cells, granzyme B+CD8+ T cells, TNF-α+IFN-γ+CD8+T cells and Tregs) are shown as indicated by flow cytometry. (O) Flow cytometry was used to evaluate the percentage of PD-L1+ tumor cells in tumor tissues. Results are presented as mean±SD from one representative experiment. *P<0.05, **p<0.01, ***p<0.001 according to a two-tailed t-test. (P–Q) Representative images and statistical of the results of IHC staining of Ki-67 and cleaved-caspase-3 of Tnfr2 knockdown tumors in immunodeficient nude mice. (R–S) Survival of immunocompetent and immunodeficient mice bearing TNFR2-depleted pancreatic cancer cells; n=9 mice per group. The statistical significance between wildtype (WT) and knockdown (TNFR2 KD) immunocompetent (R) and immunodeficient (S) mice was assessed using Kaplan-Meier survival curves with the log-rank test. IHC, immunohistochemistry; ns, not significant; TNFR2, tumor necrosis factor receptor 2; Tregs, regulatory T cells.
Figure 3
Figure 3. TNFR2 correlated positively with PD-L1 in pancreatic cancer. (A–F) Representative immunofluorescence (IF) images and the statistical results of TNFR2 and PD-L1 in tissues from patients with PDAC (A–C) and GEMM-KPC (LSL-KrasG12D/+; LSL-Trp53R172H/+; Pdx1-Cre) tissues (D–F). All images are presented at 100× magnification. (G–H) Representative images and the statistical results of IHC (n=109) staining of TNFR2 and PD-L1 in a tissue microarray. (I–K) Western blotting analysis, flow cytometry, and IF staining of PD-L1 expression in pancreatic cancer cell lines after Tnfr2 knockdown. (L–N) Representative IF images and the statistical results of PD-L1 expression in pancreatic cancer cell lines after Tnfr2 knockdown. All images are presented at 200× magnification. (O–P) Western blotting and the statistical results of TNFR2 and PD-L1 expression in Tnfr2-KD xenograft tumor samples. (Q–R) Representative images and the statistical results of IHC staining of TNFR2 and PD-L1 in Tnfr2-KD xenograft tumor samples. All images are presented at 100× magnification. *P<0.05, **p<0.01, ***p<0.001 according to a two-tailed t-test. ns, not significant; PCC, Pearson’s correlation coefficient. IHC, immunohistochemistry; PD-L1, programmed cell death 1 ligand 1; PDAC, pancreatic ductal adenocarcinoma; TNFR2, tumor necrosis factor receptor 2.
Figure 4
Figure 4. TNFR2 regulates PD-L1 expression via NF-κB p65/PD-L1. (A) qRT-PCR examination of the expression of PDL1 in pancreatic cancer cell with TNFR2 KD. (B) Western blotting analysis of PD-L1 expression under anti-TNFR1 or anti-TNFR2 blocking antibodies with and without TNF-α treatment. (C) Exogenous PD-L1 expression determined by western blotting analysis in KPC and Panc02 cells pretreated with NF-κB p65 inhibitors for 2 hours, followed by treatment with TNF-α for 12 hours. (D) Chromatin immunoprecipitation (ChIP) assay analysis of NF-κB bound potential binding site in the CD274 (PD-L1) promotor after TNF-α treatment in PDAC cells. (E–F) Nuclear translocation of p65 analyzed at the indicated time points using cell fractionation in KPC cells treated with TNF-α and anti-TNFR2 antibody. (G) Nuclear translocation of p65 analyzed at the indicated time points using cell fractionation in KPC-tnfr2 KD and Panc02-tnfr2 KD cells. (H–K) Representative immunofluorescence (IF) images and the statistical results of nuclear translocation of p65 in TNFR2 KD and anti-TNFR2-treated pancreatic cancer cell. Scale bars: 25 µm at 100× magnification; 100 µm at 400× magnification. *P<0.05, **p<0.01, ***p<0.001 according to a two-tailed t-test. ns, not significant; PD-L1, programmed cell death 1; PDAC, pancreatic ductal adenocarcinoma; TNFR2, tumor necrosis factor receptor 2.
Figure 5
Figure 5. The anti-TNFR2 antibody and PD-L1 antagonist combination eradicates PDAC in orthotopic tumor-bearing mice. (A) Schedule of the anti-TNFR2 and anti-PD-L1 antibody combination therapy in the orthotopic model. (B) Representative images showing tumors harvested from mice bearing KPC cells treated with the anti-PD-L1 antibody, the anti-TNFR2 antibody, or their combination (n=5). (C and D) The statistical results of tumor weight and mouse body weight. (E and F) The statistical results of spleen weight and representative images after final treatments. (G–H) Flow cytometry analysis and statistical results for tumor-infiltrating lymphocytes. Data are displayed as the mean±SD of one representative experiment. *P<0.05, **p<0.01, ***p<0.001 according to a two-tailed t-test. ns, not significant; PD-L1, programmed cell death 1 ligand 1; PDAC, pancreatic ductal adenocarcinoma; TNFR2, tumor necrosis factor receptor 2.
Figure 6
Figure 6. CyTOF analysis of tumor-infiltrating lymphocytes after anti-TNFR2 or anti-PD-L1 antibody therapy. (A) A scheme showing the experiments and CyTOF analysis of anti-TNFR2 or anti-PD-L1 combination therapy. (B) We identified 29 clusters, as shown in a tSNE plot. (C) tSNE plots were color coded for the expression of marker genes for the seven main immune cell types. (D) Forty-one immune markers were differentially expressed in the 29 cell clusters, as shown by a heatmap. According to typically expressed markers, certain clusters contained known cell types. (E) Plots of tSNE showing the distinct immune landscape of tumors in the different treatment groups. (F) Proportions of three immune cell types in the four treatment groups. (G) tSNE plots showing color-coded expression of marker genes for PD-L1, CD8+ T cells and Treg cells in the four treatment groups. The main types of immune cells are marked using red boxes. (H) Marker genes expression for PD-L1, CD8+ T cells and Treg cells in the four treatment groups. The data were derived from CyTOF analysis. (I) Proportions of CD4+ T cells and CD8+ T cells in the four treatment groups. Data are displayed as the mean±SD of one representative experiment. *P<0.05, **p<0.01, ***p<0.001 according to a two-tailed t-test. ns, not significant. CyTOF, cytometry by time of flight; PD-L1, programmed cell death 1 ligand 1; TNFR2, tumor necrosis factor receptor 2.
Figure 7
Figure 7. The antitumor response to combined anti-PD-L1 and anti-TNFR2 blockade depends on CD8+ T cells. (A) Tumor implantation and injection of antibodies schedule for immune cell (CD4+T cells, CD8+ T cells, and NK cells) depletion in mice receiving combination treatment. (B–G) Representative flow cytometry and quantification of NK, CD8, and CD4 staining of splenocytes to confirm immune cell depletion. (H) Representative images showing tumors harvested from mice bearing KPC cells treated with combination therapy after immune cell depletion (n=5). (I–J) The statistical results of tumor weight and mouse body weight. (K) Tumor growth curve of mice treated with combination therapy and antibodies for immune cell depletion. (L) Proposed model of the function of TNFR2 and the detailed mechanisms by which the TNFR2/NF-κB p65-PD-L1 pathway that contributes to escape from T cell immune surveillance and the TNFR2/NF-κB p65-mediated tumor growth pathway. NK, natural killer; PD-L1, programmed cell death 1 ligand 1; TNFR2, tumor necrosis factor receptor 2.

References

    1. Ferlay J, Soerjomataram I, Dikshit R, et al. Cancer incidence and mortality worldwide: sources, methods and major patterns in GLOBOCAN 2012. Int J Cancer. 2015;136:E359–86. doi: 10.1002/ijc.29210. - DOI - PubMed
    1. Siegel RL, Miller KD, Jemal A. Cancer statistics, 2019. CA Cancer J Clin. 2019;69:7–34. doi: 10.3322/caac.21551. - DOI - PubMed
    1. Von Hoff DD, Ervin T, Arena FP, et al. Increased survival in pancreatic cancer with nab-paclitaxel plus gemcitabine. N Engl J Med. 2013;369:1691–703. doi: 10.1056/NEJMoa1304369. - DOI - PMC - PubMed
    1. Conroy T, Desseigne F, Ychou M, et al. FOLFIRINOX versus gemcitabine for metastatic pancreatic cancer. N Engl J Med. 2011;364:1817–25. doi: 10.1056/NEJMoa1011923. - DOI - PubMed
    1. Kamisawa T, Wood LD, Itoi T, et al. Pancreatic cancer. Lancet. 2016;388:73–85. doi: 10.1016/S0140-6736(16)00141-0. - DOI - PubMed

Substances