. 2022 Jul;71(7):1359-1372.
doi: 10.1136/gutjnl-2021-324755. Epub 2022 Mar 8.

A faecal microbiota signature with high specificity for pancreatic cancer

Collaborators, Affiliations

A faecal microbiota signature with high specificity for pancreatic cancer

Ece Kartal et al. Gut. 2022 Jul.

Abstract

Background: Recent evidence suggests a role for the microbiome in pancreatic ductal adenocarcinoma (PDAC) aetiology and progression.

Objective: To explore the faecal and salivary microbiota as potential diagnostic biomarkers.

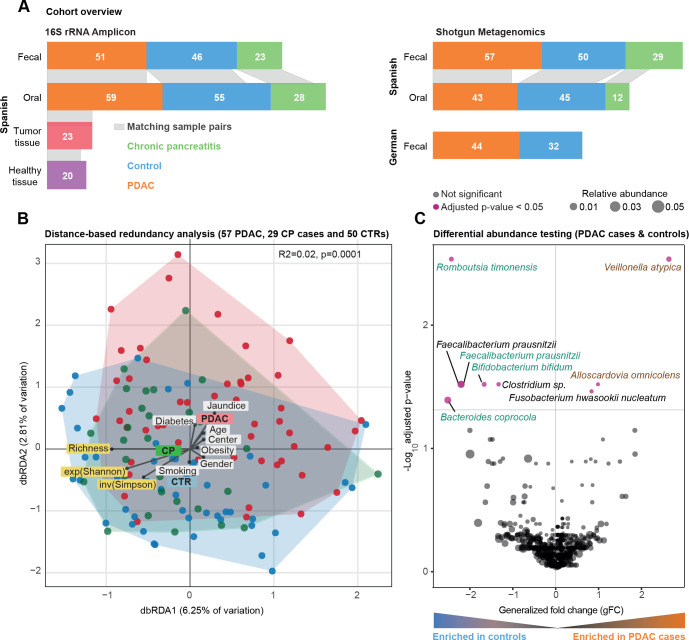
Methods: We applied shotgun metagenomic and 16S rRNA amplicon sequencing to samples from a Spanish case-control study (n=136), including 57 cases, 50 controls, and 29 patients with chronic pancreatitis in the discovery phase, and from a German case-control study (n=76), in the validation phase.

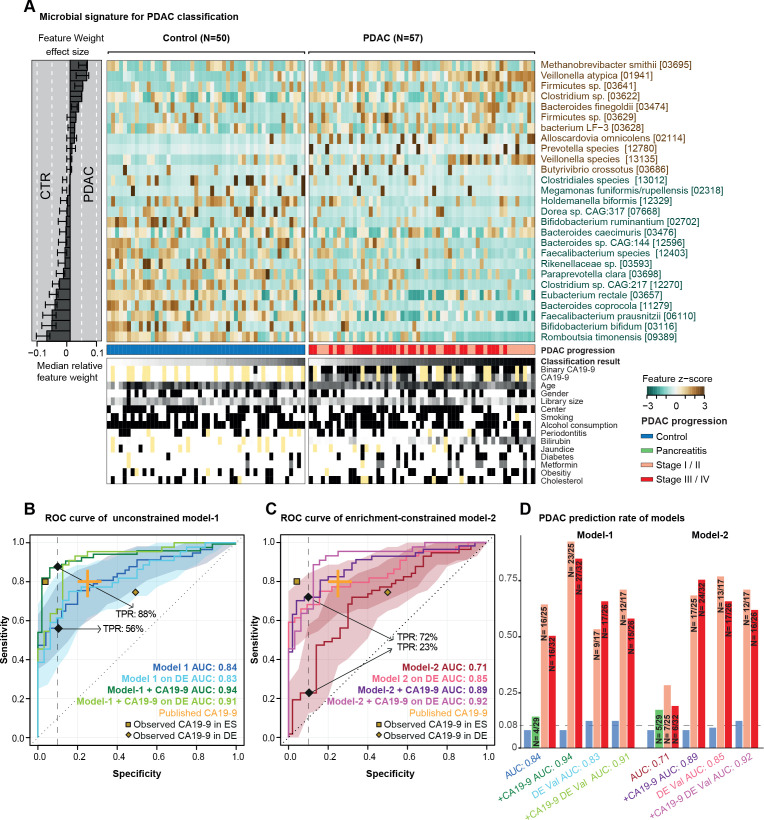
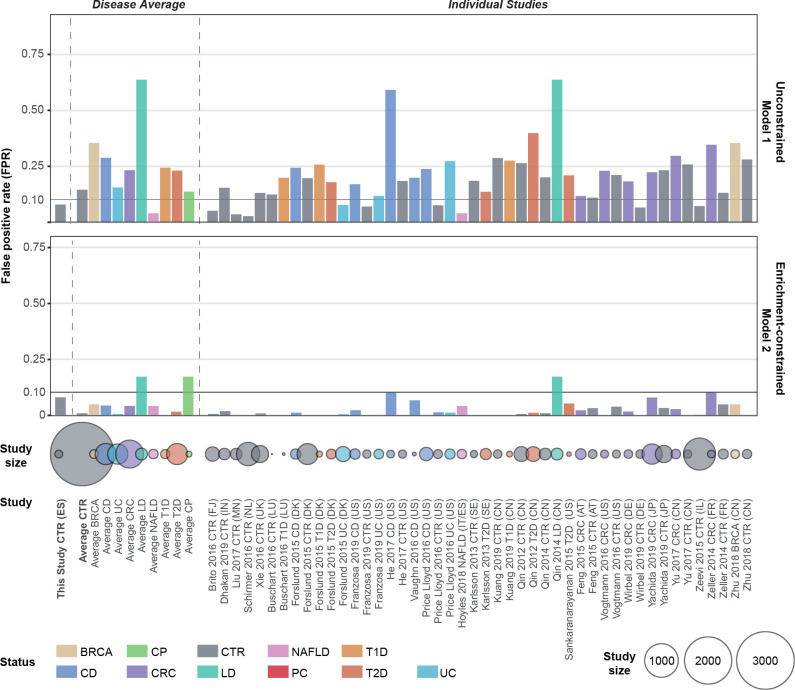
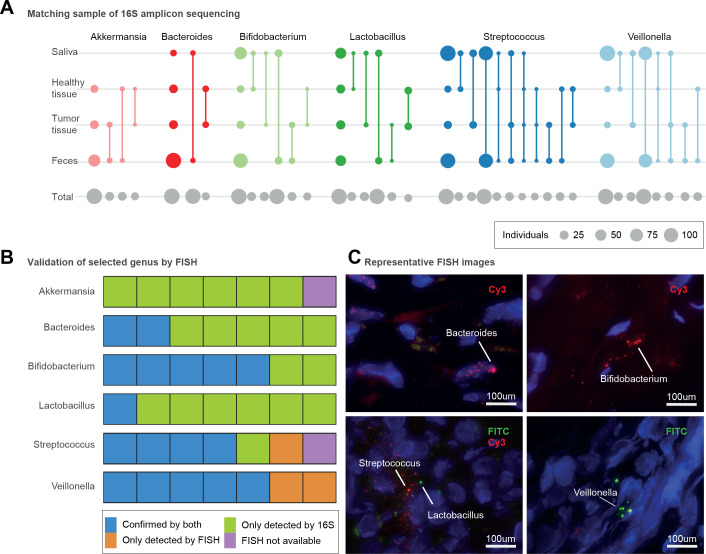
Results: Faecal metagenomic classifiers performed much better than saliva-based classifiers and identified patients with PDAC with an accuracy of up to 0.84 area under the receiver operating characteristic curve (AUROC) based on a set of 27 microbial species, with consistent accuracy across early and late disease stages. Performance further improved to up to 0.94 AUROC when we combined our microbiome-based predictions with serum levels of carbohydrate antigen (CA) 19-9, the only current non-invasive, Food and Drug Administration approved, low specificity PDAC diagnostic biomarker. Furthermore, a microbiota-based classification model confined to PDAC-enriched species was highly disease-specific when validated against 25 publicly available metagenomic study populations for various health conditions (n=5792). Both microbiome-based models had a high prediction accuracy on a German validation population (n=76). Several faecal PDAC marker species were detectable in pancreatic tumour and non-tumour tissue using 16S rRNA sequencing and fluorescence in situ hybridisation.

Conclusion: Taken together, our results indicate that non-invasive, robust and specific faecal microbiota-based screening for the early detection of PDAC is feasible.

Keywords: cancer prevention; intestinal microbiology; pancreatic cancer; pancreatic tumours; screening.


Conflict of interest statement

Competing interests: EK, TSBS, JW, OMM, EM-M, GZ, LE, SR-P, FXR, NM and PB have a pending patent application (application number: EP21382876.7) for early detection of pancreatic cancer based on microbial biomarkers. The other authors declare no conflicts of interest.

Figures

Figure 1
Figure 1
Community analysis of Spanish faecal microbiome data. (A) Study population overview. Grey bands between the bar plots indicate samples of matching body sites within individuals. (B) Bray-Curtis distance-based redundancy analysis (dbRDA) of pancreatic ductal adenocarcinoma (PDAC), chronic pancreatitis (CP) and control (CTR) faecal microbiome data in a Spanish (ES) cohort. PDAC samples are shown as red coloured circles, patients with CP as green and controls as blue. Richness, exponential Shannon (exp(Shannon)) and inverse Simpson (inv(Simpson)) diversity measures are also visualised with arrows similarly to tested metadata variables. The distance of the meta-variable from the centre represents the confounding effect size (see ‘Methods’). (C) Wilcoxon test results of ES faecal microbiome data to test enriched taxa between PDAC and control cases (see ‘Methods’). Y-axis is log10(FDR corrected p values), X-axis is generalised fold change, and dot size represents the relative abundance of a given species. Red dots represent significantly differentially abundant species in either group, while black dots show non-significant species after FDR correction. Green and brown-coloured species are selected in metagenomic model-1 as predictors of PDAC. FDR, false discovery rate.
Figure 2
Figure 2
Predictive microbiome signatures of pancreatic ductal adenocarcinoma (PDAC). (A) Normalised abundance of 27 selected species in the faecal microbiome across samples shown as a heat map. The right panel represents the contribution of each selected feature to the overall model-1, and the robustness (the percentage of models in which the feature is included as predictor) of each feature is presented as percentage. Classification scores from cross-validation of each individual and condition for tested meta-variables are displayed at the bottom of the panel, yellow representing missing information. (B–D) Internal cross-validation results of unconstrained model-1 (without feature selection), enrichment-constrained model-2 (constrained to positive features) and combination of carbohydrate antigen (CA)19-9 (using a threshold of 37 μL/mL) with microbial features (see ‘Methods’) are shown as receiver operating characteristic (ROC) curve with 95% CI shaded in corresponding colour. True positive rates (TPRs) are given as a percentage at a 90% specificity cut-off. Validation of all models on an independent German (DE) PDAC test population (n=76) is represented as well. Published CA19-9 accuracy from a meta-study shown in orange. The yellow dots represent observed CA19-9 accuracies in our populations (data available for 33/50 controls (CTRs) and 44/57 patients with PDAC in the Spanish (ES) and for 8/32 CTRs and 44/44 patients with PDAC in the German (DE) population) (D) TPRs of all models at different PDAC progression stages and in addition, the false-positive rate for patients with chronic pancreatitis and controls at a 90% specificity cut-off are shown as bar plots. Stages I and II and stages III and IV are combined owing to the overall low sample size. The number of predicted cases compared with the total is also shown on the top of each bar. DE-Val, German validation population.
Figure 3
Figure 3
External validation of the disease specificity of pancreatic ductal adenocarcinoma (PDAC) faecal microbiome models. False positive rate (FPR) of metagenomic unconstrained model-1 and enrichment-constrained model-2 in 25 external test sets is shown as a bar plot (see online supplemental table S4 for a list of all studies included). Validation datasets were profiled and normalised in the same way as the initial dataset (see ‘Methods’). Each study was stratified according to health status and models were tested to predict in the given group at a 90% specificity cut-off. A low FPR on metagenomes from patients with other disorders and healthy individuals indicates that the model is specific to PDAC. The number of subjects in each group is displayed as colour coded circles below. BRCA, breast cancer; CRC, colorectal cancer; CD, Crohn’s disease; CP, chronic pancreatitis;, CTR, controls; LD, liver disease; NAFLD, non-alcoholic fatty liver disease; PC, pancreatic cancer; T1D, type 1 diabetes; T2D, type 2 diabetes; UC, ulcerative colitis; ES, Spanish; DE, German.
Figure 4
Figure 4
Presence of microbiomes in different sections of the pancreas with different conditions. (A) Presence of different genera in four different body sites including faecal, saliva, pancreatic tumour and healthy tissue samples, as inferred by 16S amplicon data. Circle size corresponds to the total number of subjects available for each comparison (grey, bottom row) or with intra-individually matched amplicon sequence variants (coloured); matched sample types are connected by lines. The first column shows the total number of samples per site in which the genus was detected. (B) Seven selected pancreatic tissue samples (five tumour and two non-tumour) to show bacterial presence/absence with both 16S amplicon and fluorescence in situ hybridisation (FISH) methods. Validation of bacterial presence with both 16S amplicon sequencing and FISH is shown in blue. Samples showing bacterial presence according to 16S only are displayed in green. Bacterial presence validated only by FISH is shown in orange, and samples not subjected to FISH validation owing to lack of tissue material are shown in purple. (C) Representative microscopy images for Bacteroides (intranuclear, tumour tissue), Bifidobacterium (extranuclear, tumour tissue), Lactobacillus (extranuclear, non-tumour tissue), Streptococcus (extranuclear, non-tumour tissue), Veillonella (extranuclear, tumour tissue). Fluorescein isothiocyanate (FITC) and Cy3 fluorescent dyes were used as indicated, and DAPI (4',6,-diamidino-2-phenylindole; blue) was used to label the nucleus.

Comment in

References

    1. Siegel RL, Miller KD, Jemal A. Cancer statistics, 2018. CA Cancer J Clin 2018;68:7–30. 10.3322/caac.21442 - DOI - PubMed
    1. Bray F, Ferlay J, Soerjomataram I, et al. . Global cancer statistics 2018: GLOBOCAN estimates of incidence and mortality worldwide for 36 cancers in 185 countries. CA Cancer J Clin 2018;68:394–424. 10.3322/caac.21492 - DOI - PubMed
    1. Kamisawa T, Wood LD, Itoi T, et al. . Pancreatic cancer. The Lancet 2016;388:73–85. 10.1016/S0140-6736(16)00141-0 - DOI - PubMed
    1. Park W, Chawla A, O’Reilly EM. Pancreatic cancer: a review. JAMA 2021;326. 10.1001/jama.2021.13027 - DOI - PMC - PubMed
    1. Wang Y, Li Z, Zheng S, et al. . Expression profile of long non-coding RNAs in pancreatic cancer and their clinical significance as biomarkers. Oncotarget 2015;6:35684–98. 10.18632/oncotarget.5533 - DOI - PMC - PubMed

Publication types