. 2022 Mar 8;7(5):e153755.
doi: 10.1172/jci.insight.153755.

Adipocyte-derived PGE2 is required for intermittent fasting-induced Treg proliferation and improvement of insulin sensitivity

Affiliations

Adipocyte-derived PGE2 is required for intermittent fasting-induced Treg proliferation and improvement of insulin sensitivity

Chunqing Wang et al. JCI Insight. .

Abstract

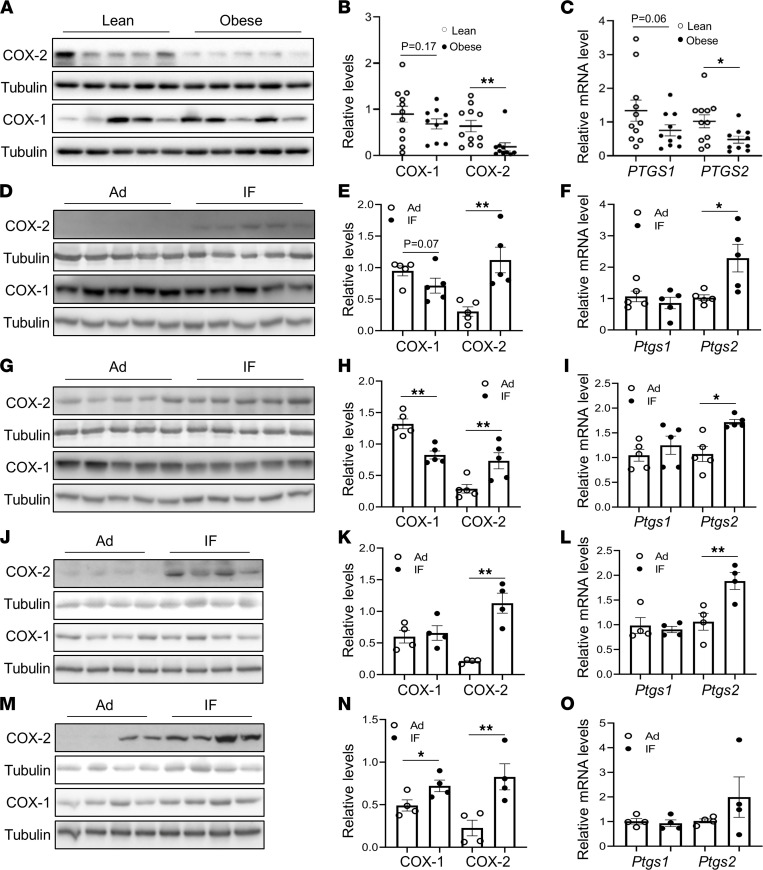
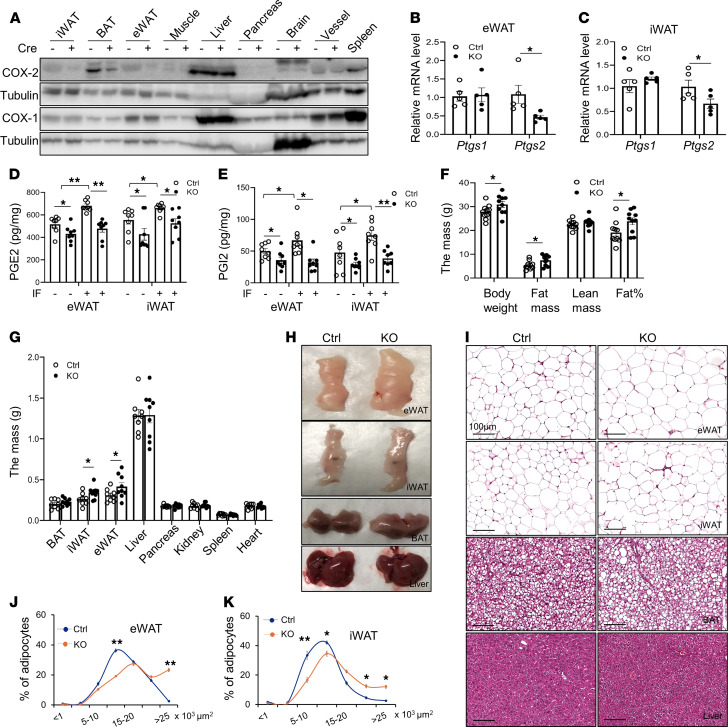
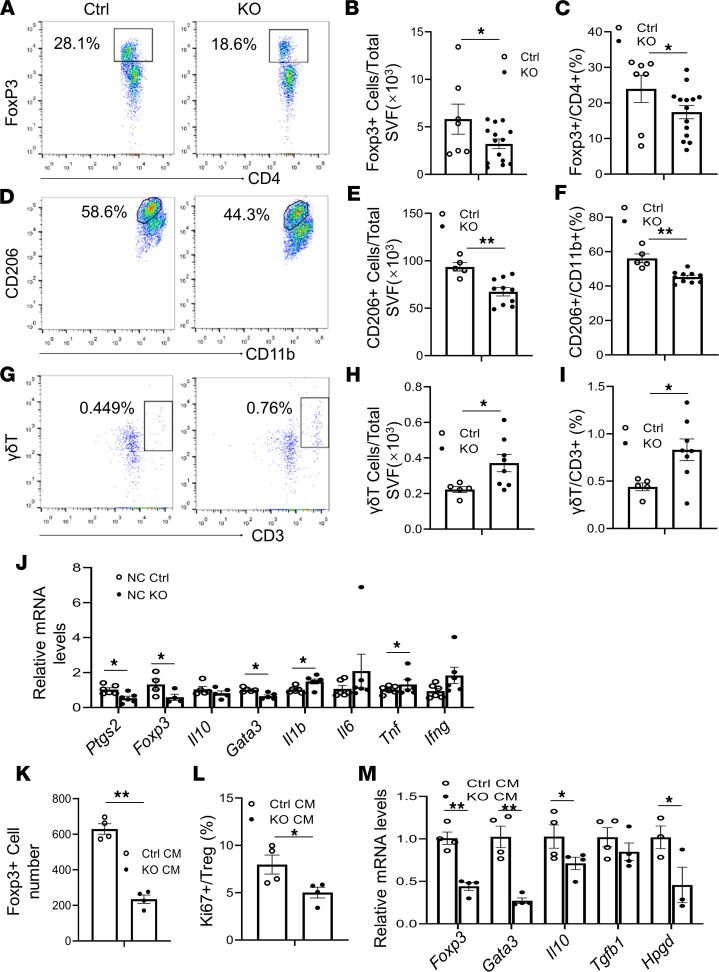
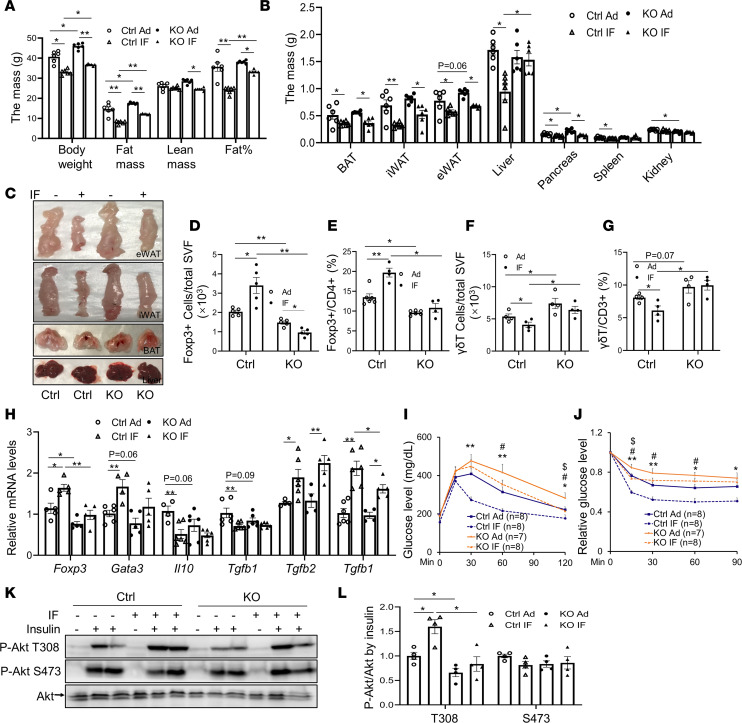
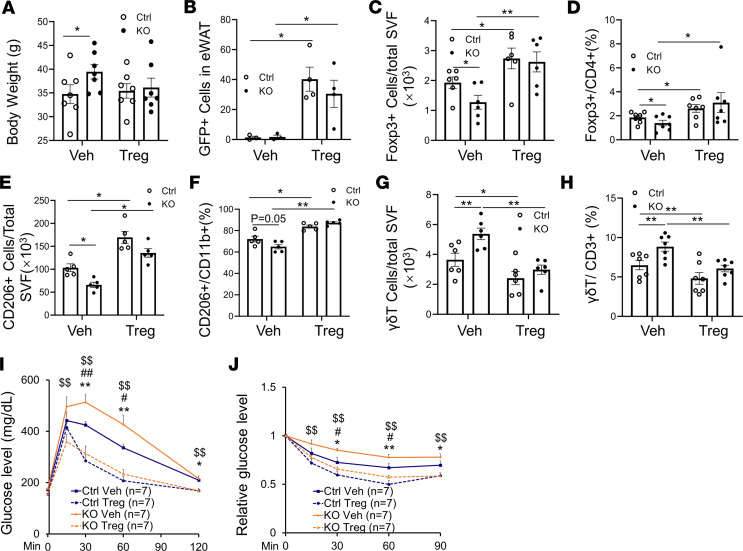
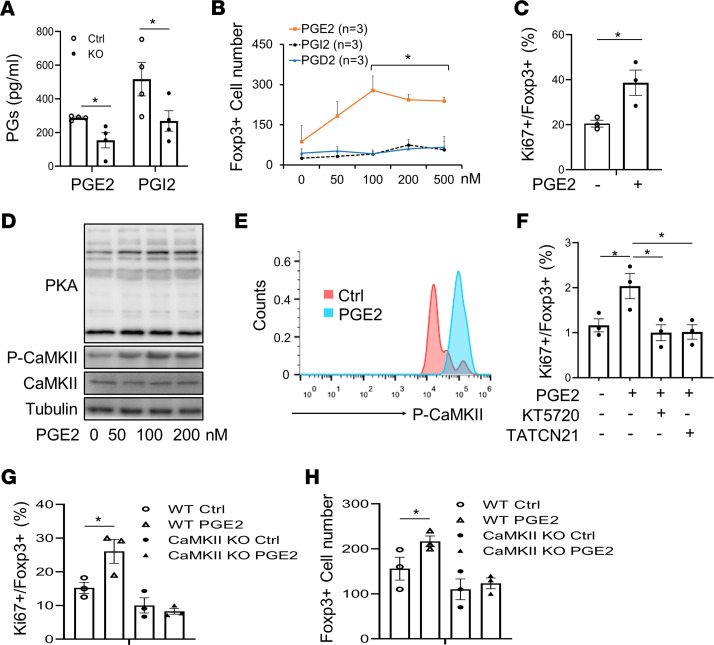
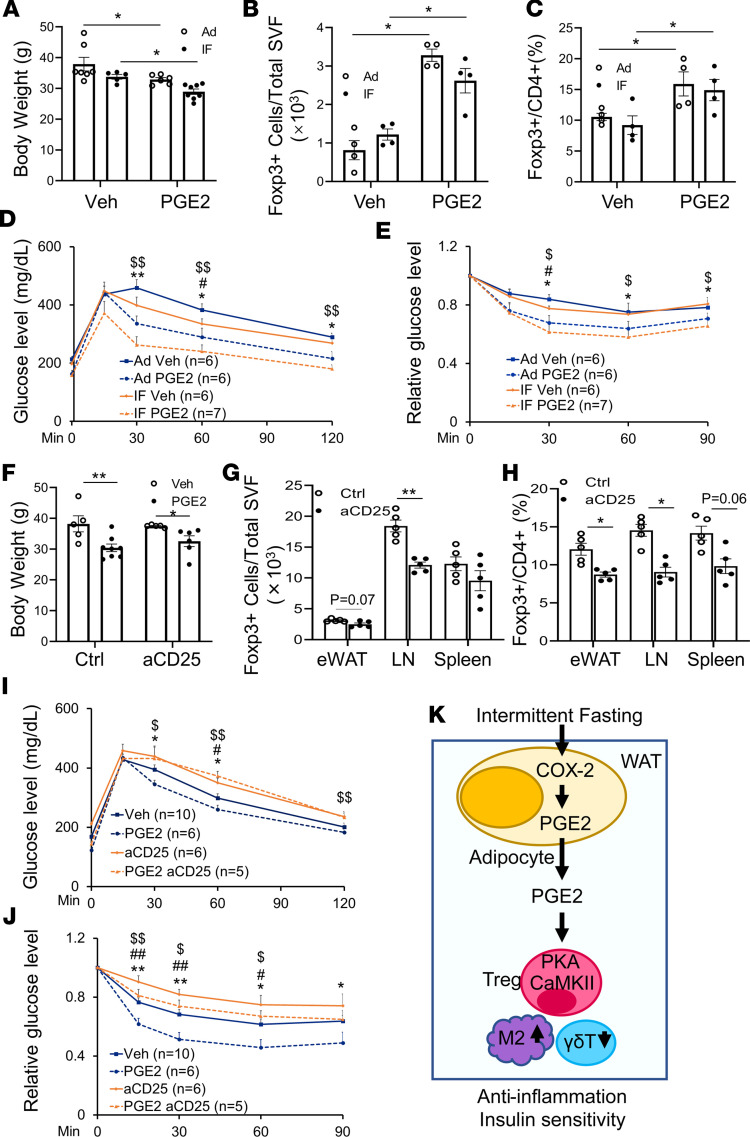
The intermittent fasting (IF) diet has profound benefits for diabetes prevention. However, the precise mechanisms underlying IF's beneficial effects remain poorly defined. Here, we show that the expression levels of cyclooxygenase-2 (COX-2), an enzyme that produces prostaglandins, are suppressed in white adipose tissue (WAT) of obese humans. In addition, the expression of COX-2 in WAT is markedly upregulated by IF in obese mice. Adipocyte-specific depletion of COX-2 led to reduced fractions of CD4+Foxp3+ Tregs and a substantial decrease in the frequency of CD206+ macrophages, an increase in the abundance of γδT cells in WAT under normal chow diet conditions, and attenuation of IF-induced antiinflammatory and insulin-sensitizing effects, despite a similar antiobesity effect in obese mice. Mechanistically, adipocyte-derived prostaglandin E2 (PGE2) promoted Treg proliferation through the CaMKII pathway in vitro and rescued Treg populations in adipose tissue in COX-2-deficient mice. Ultimately, inactivation of Tregs by neutralizing anti-CD25 diminished IF-elicited antiinflammatory and insulin-sensitizing effects, and PGE2 restored the beneficial effects of IF in COX-2-KO mice. Collectively, our study reveals that adipocyte COX-2 is a key regulator of Treg proliferation and that adipocyte-derived PGE2 is essential for IF-elicited type 2 immune response and metabolic benefits.

Keywords: Adipose tissue; Innate immunity; Metabolism.


Figures

Figure 1
Figure 1. COX-2 expression is suppressed by obesity and is induced by IF in AT.
The expression levels of COX-2 but not COX-1 in protein (A and B) and mRNA (C) were suppressed by obesity in visceral fat of human participants, compared with that of lean controls, despite a decrease in mRNA of PTGS2, a gene that encodes human COX-2. PTGS1 is a gene encoding human COX-1. Tubulin was used as the loading control. The expression levels of COX-2 but not COX-1 in protein (D and E) and mRNA (F) were markedly induced by IF in eWAT of mice with diet-induced obesity. The protein (G and H) and mRNA (I) levels of COX-2 in iWAT were also induced by IF despite the suppression of COX-1 in protein in obese mice. The upregulation of COX-2 expression by IF was also observed in eWAT (J–L) and iWAT (M and N) of NCD mice, although no significant effect was observed on the mRNA levels of both Ptgs2, a gene that encodes mouse COX-2, and Ptgs1, a gene that encodes mouse COX-1, in iWAT (O). We fed 6-week-old male mice a 45% HFD or NCD for 8 weeks, which was followed by Ad or IF for 30 days. All data in this figure were analyzed by t test and are presented as the mean ± SEM. *P < 0.05; **P < 0.01.
Figure 2
Figure 2. Adipocyte-specific depletion of COX-2 suppressed IF-induced PG production and increased adipocyte development.
(A–E) Three-month-old male COX-2–KO and control (Ctrl) mice were used. (A) COX-2 was highly enriched in AT compared with other tissue or organs, and adipocyte-specific depletion of COX-2 markedly downregulated COX-2 but not COX-1 protein levels in eWAT, iWAT, and BAT, with little effect on muscle, liver, pancreas, brain, or blood vessels. (B and C) The mRNA levels of Ptgs2 but not Ptgs1 were notably decreased by COX-2 depletion in eWAT and iWAT. The basal and IF secretion levels of PGE2 (D) and PGI2 (E) in eWAT and iWAT were significantly decreased in COX-2–KO mice compared with Ctrls. The tissue samples of eWAT and iWAT were minced and incubated in medium for 8 hours. The medium was collected and the levels of PGE2 and PGI2 were determined by an ELISA kit accordingly. (F–K) Six-month-old male COX-2–KO and Ctrl mice were used for these studies. (F) COX-2 deficiency promoted adipocyte development. The lean mass, fat mass, total mass, and fat percentage were measured using dual-energy X-ray absorptiometry scanning. (G) The mass of epididymal and inguinal fat pads, but not of brown fat, was increased in COX-2–KO mice. The organs were weighed after mice were euthanized. (H) Representative images of eWAT, iWAT, BAT, and liver in COX-2–KO and Ctrl mice. (I) H&E staining of eWAT, iWAT, BAT, and liver in COX-2–KO and Ctrl mice. (J and K) The fat cells’ size was enlarged by COX-2 deficiency in eWAT and iWAT. (B–G, J, and K) Data are presented as the mean ± SEM. (B, C, F, G, J, and K) Data were analyzed via t test. (D and E) ANOVA was used for statistical analysis. *P < 0.05; **P < 0.01.
Figure 3
Figure 3. Deficiency of COX-2 in adipocytes reduces Treg frequency and type 2 immune response in AT.
(A–I) The eWAT samples were collected from 6-month-old male COX-2–KO and control (Ctrl) mice (n = 5–14/group); the stromal vascular fraction of AT was used for flow cytometry analysis. (A) The fraction of resident CD4+Foxp3+ cells was decreased in eWAT of COX-2–KO mice compared with that of Ctrl mice. (B and C) The percentage of CD4+ Foxp3+ cells in total CD4+ cells was decreased in eWAT of COX-2–KO mice compared with that of Ctrl mice. COX-2–KO mice had reduced a Siglec-5CD11b+CD206+ population (D and E) and decreased proportion of CD11b+CD206+ in CD11b+ cells (F) in eWAT. COX-2 deficiency led to an increase in the γδT+CD3+ cell population (G and H) and in the proportion of γδT+CD3+ cells in total CD3+ cells (I) in eWAT. (J) COX-2–KO downregulated mRNA levels of Foxp3, GATA-3 as well as COX-2 in eWAT while upregulating levels of IL-1β and IFN-γ in eWAT despite no significant effect on IL-10, IL-6, and TNF-α. (K and L) The culture medium (CM) from primary COX-2–KO adipocytes decreased the fraction of CD4+Foxp3+ cells and suppressed the percentage of Ki67+ Tregs in total Tregs compared with Ctrl medium. AT Tregs were isolated from AT and treated with the CM from COX-2–KO and Ctrl primary adipocytes for 24 hours. n = 4/group. (M) The medium from primary COX-2–KO adipocytes decreased mRNA levels of Foxp3, Gata3, Il10, and Hpgd without significant effects on Tgfb1 in AT Tregs. (B, C, E, F, and H–M) The t test was used to analyze data for these studies. All data are presented as mean ± SEM. * P < 0.05; **P < 0.01.
Figure 4
Figure 4. COX-2 deficiency suppressed IF-induced Treg proliferation and improvement of insulin resistance.
A HFD was fed to 6-week-old male COX-2–KO and control (Ctrl) mice for 8 weeks followed by IF (n = 6–8/group) for 30 days. (A) IF led to a 32.6% loss of fat mass and a 18.7% loss of body mass but not lean mass in Ctrl mice, and the antiobesity effect was not significantly affected by COX-2 deficiency. (B) IF-induced mass loss in eWAT and BAT was little affected, whereas the effects on iWAT and liver were suppressed in COX-2–KO mice compared with Ctrl mice. (C) Representative images of eWAT, iWAT, BAT, and liver in HFD-fed COX-2–KO and Ctrl mice before and after IF. COX-2 deficiency alleviated IF-induced increase in the Treg fraction (D) and the proportion of Tregs in CD4+ cells (E); suppressed the inhibitory effects of IF on the γδT cell fraction (F) and the proportion of γδT cells in CD3+ cells (G); and diminished the inducing effect of IF on mRNA levels of Foxp3, GATA3, and TGFβ3 with little effect on IL-10, TGFβ1, and TGFβ2 (H) in eWAT. (I) COX-2 deficiency diminished IF-improved glucose tolerance. (J) COX-2 deficiency diminished IF-improved insulin tolerance. (K and L) Insulin-stimulated phosphorylation of Akt at Thr308 (T308) and Ser473 (S473) in the liver of COX-2–KO and Ctrl mice treated with or without IF. n = 4/group. *P < 0.05 and **P < 0.01 for Ad vs. IF in Ctrl mice; #P < 0.05 for Ctrl vs. KO mice with Ad diet; $P < 0.05 for Ad vs. IF in KO mice. ANOVA was used to analyze all the data in this figure. (A, B, and D–H) Data are presented as mean ± SEM. * P < 0.05; **P < 0.01.
Figure 5
Figure 5. Adoptive transfer of Tregs reverses COX-2–KO–caused AT inflammation and insulin resistance.
For the following studies, mouse GFP+CD4+ T cells were isolated from lymph nodes and spleens of Foxp3-eGFP mice, and IP injection of CD4+GFP+ T cells which were positive Treg cells and CD4+GFP- as negative control cells to 8 weeks HFD-fed COX-2–KO and control (Ctrl) mice. (A) There was little effect of adoptive transfer on the BW in COX-2–KO and control mice 2 weeks post transfer. Flow cytometry analysis of CD4+GFP+ cells (B), CD4+Foxp3+ Treg cells (C) and the proportion of Foxp3+ Treg in CD4+ cells (D) in eWAT showed the successful transfer of Tregs in AT. Adoptive transfer of Tregs increased CD11b+CD206+ cell fraction (E) and the proportion of CD11b+CD206+ in CD11b+ cells (F), while suppressed γδT+CD3+ cell population (G) and the proportion of γδT+CD3+ cell in total CD3+ cells (H). Adoptive transfer of Treg cells rescued COX-2 deficiency-induced glucose (I) and insulin (J) intolerance. *P < 0.05 and **P < 0.01 Ctrl vehicle (Veh) vs. Ctrl Treg; #P < 0.05 and ##P < 0.01 for Ctrl Veh vs. KO Veh; $$P < 0.01 for KO Veh vs. KO Tregs; no significant difference was found between Ctrl Tregs and KO Tregs. (A–H) n = 4–7/group. (B) Representative data from 3 independent experiments are reported. ANOVA was used to analyze the data in this figure. Data are reported as mean ± SEM. *P < 0.05; **P < 0.01.
Figure 6
Figure 6. Adipocyte COX-2 promotes resident Treg proliferation through PGE2.
(A) COX-2 deficiency suppressed the secretion levels of PGE2 and PGI2 in primary adipocytes. COX-2–KO and control (Ctrl) primary adipocytes were changed to fresh medium and cultured for 2 hours. Medium was collected and used to determine the levels of PGE2 and PGI2, using an ELISA kit. (B, C, E, and F) AT Tregs were isolated from AT for these studies. Treatment of PGE2 but not PGD2 and PGI2 increased the population of Foxp3+ Tregs in a dose-dependent manner (B), and treatment of 100 nM PGE2 induced proliferation of Tregs as indicated by the staining of Ki67 (C). Intracellular Ki67+ and Foxp3+ Tregs were determined by flow cytometry analysis. AT Tregs were treated with DMSO, PGD2, PGE2, or PGI2, with indicated doses for 24 hours. *P < 0.05 compared with the group without treatment. (D) Treatment of PGE2 stimulated activation of PKA and CaMKII in differentiated Tregs in a dose-dependent manner. CD4+-naive T cells were isolated from a single-cell suspension from lymph nodes and spleens and then differentiated into CD4+Foxp3+ Tregs. Differentiated Tregs were treated, or not, with PGE2 for 1 hour. Representative data from 3 independent experiments are reported. (E) PGE2 treatment stimulated phosphorylation of CaMKII in AT Tregs. n = 3/group. (F) Inhibiting PKA by 5 μM KT 5720 or inhibiting CaMKII by 5 μM TATCN21 suppressed PGE2-treatment–induced proliferation of AT Tregs. AT Tregs were treated with KT 5720 or TATCN21 for 1 hour, followed by co-treatment with PGE2 for 24 hours. n = 3/group. CaMKIIγ deficiency blocked PGE2-stimulated CD4+Foxp3+ Treg proliferation, indicated by Ki67 expression (G) and total Treg fraction (H). Primary Tregs were isolated from AT of CaMKIIγ-KO and WT mice and treated with 100 nM PGE2 for 24 hours, followed by flow cytometry analysis. (A–C) The t test was used for data analysis. (F–H) ANOVA was used for data analysis. Data are reported as mean ± SEM. *P < 0.05; **P < 0.01.
Figure 7
Figure 7. The PGE2/Treg axis is indispensable for the antiinflammatory and insulin-sensitizing effects of IF.
HFD-fed COX-2–KO mice were fed on an IF schedule or Ad for 4 weeks. Two weeks after IF, mice were injected with PGE2 or vehicle (Veh) for 2 weeks. (A) PGE2 administration resulted in significantly decreased body mass of COX-2–KO mice under both IF and Ad conditions. n = 5–8/group. Treatment with PGE2 restored the AT Treg population (B) and the proportion of Tregs in CD4+ cells (C) in COX-2–KO mice under both IF and Ad conditions. n = 4/group. PGE2 administration improved glucose (D) and insulin (E) tolerance in COX-2–KO mice under both IF and Ad conditions. *P < 0.05 and **P < 0.01 for Veh vs. PGE2 with Ad diet; #P < 0.05 for Ad vs. IF with Veh treatment; $P < 0.05 and $$P < 0.01 for IF Veh vs. IF PGE2. HFD-fed C57BL/6 mice were administered CD25 neutralizing antibody for 2 days, followed by PGE2 injection. (F) Blocking the Treg pathway had no significant effect on the antiobesity effect of PGE2, as indicated by the body mass. n = 5–8/group. (G and H) Neutralization of CD25 diminished the inducing effects of PGE2 on the AT Treg population. n = 5/group. Blocking the Treg pathway impaired basal and PGE2-increased glucose (I) and insulin (J) tolerance. *P < 0.05 and **P < 0.01 for Veh vs. PGE2; #P < 0.05 and ##P < 0.01 for Ctrl vs. anti-CD25 (aCD25); $P < 0.05 and $$P < 0.01 for aCD25 vs. PGE2 aCD25. (K) Working model. ANOVA was used to analyze the data in this figure. All data are reported as mean ± SEM. LN, lymph node.

Similar articles

Cited by

References

    1. Luo L, Liu M. Adipose tissue in control of metabolism. J Endocrinol. 2016;231(3):R77–R99. doi: 10.1530/JOE-16-0211. - DOI - PMC - PubMed
    1. Luo Y, et al. Myeloid adrenergic signaling via CaMKII forms a feedforward loop of catecholamine biosynthesis. J Mol Cell Biol. 2017;9(5):422–434. doi: 10.1093/jmcb/mjx046. - DOI - PMC - PubMed
    1. Li G, et al. Intermittent fasting promotes white adipose browning and decreases obesity by shaping the gut microbiota. Cell Metab. 2017;26(4):672–685. doi: 10.1016/j.cmet.2017.08.019. - DOI - PMC - PubMed
    1. Kim KH, et al. Intermittent fasting promotes adipose thermogenesis and metabolic homeostasis via VEGF-mediated alternative activation of macrophage. Cell Res. 2017;27(11):1309–1326. doi: 10.1038/cr.2017.126. - DOI - PMC - PubMed
    1. Liu B, et al. Intermittent fasting improves glucose tolerance and promotes adipose tissue remodeling in male mice fed a high-fat diet. Endocrinology. 2019;160(1):169–180. doi: 10.1210/en.2018-00701. - DOI - PubMed