. 2022 Mar 8;12(1):3720.
doi: 10.1038/s41598-022-07404-z.

Photonic reinforcement learning based on optoelectronic reservoir computing

Affiliations

Photonic reinforcement learning based on optoelectronic reservoir computing

Kazutaka Kanno et al. Sci Rep. .

Abstract

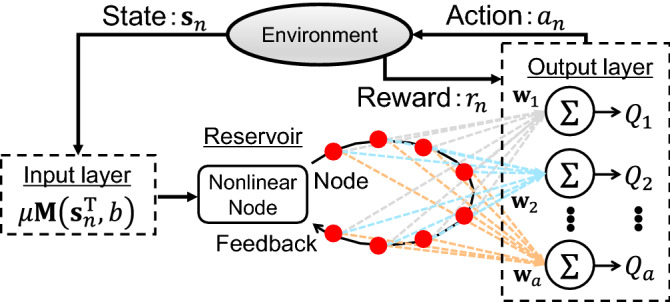
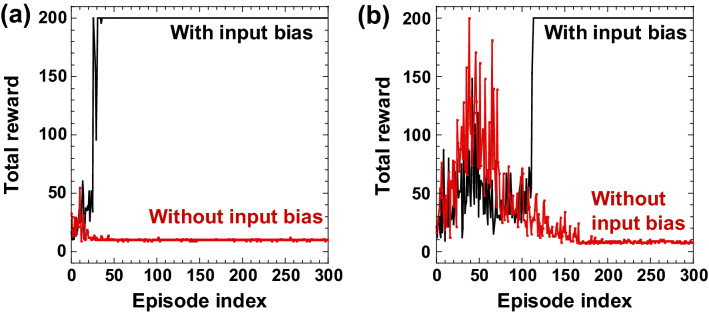
Reinforcement learning has been intensively investigated and developed in artificial intelligence in the absence of training data, such as autonomous driving vehicles, robot control, internet advertising, and elastic optical networks. However, the computational cost of reinforcement learning with deep neural networks is extremely high and reducing the learning cost is a challenging issue. We propose a photonic on-line implementation of reinforcement learning using optoelectronic delay-based reservoir computing, both experimentally and numerically. In the proposed scheme, we accelerate reinforcement learning at a rate of several megahertz because there is no required learning process for the internal connection weights in reservoir computing. We perform two benchmark tasks, CartPole-v0 and MountanCar-v0 tasks, to evaluate the proposed scheme. Our results represent the first hardware implementation of reinforcement learning based on photonic reservoir computing and pave the way for fast and efficient reinforcement learning as a novel photonic accelerator.


Conflict of interest statement

The authors declare no competing interests.

Figures

Figure 1
Figure 1
Schematic diagram of reinforcement learning based on delay-based reservoir computing.
Figure 2
Figure 2
(a) Schematic diagram of the optoelectronic delay system for reservoir computing. An input signal is preprocessed before injecting into the reservoir and added to a feedback signal. Reservoir node states are extracted from the temporal response of the reservoir and are shown as red circles. In the schematic diagram, MZM is the Mach–Zehnder modulator, PD is the photodetector, BPF is the bandpass filter, and AMP is the electric amplifier. (b) Experimental setup for reinforcement learning. The system has no delayed feedback, and the detected signal at the PD is not fed back to the MZM. In the personal computer (PC), environmental states in reinforcement learning tasks are calculated and the masking procedure is applied. The input data preprocessed in the PC is transferred to the arbitrary waveform generator (AWG). The optical signal from the MZM is detected at the PD, and the detected power is adjusted using the optical attenuator (ATT). The detected signal at the PD is measured at the digital oscilloscope (OSC). The AWG and the OSC are controlled by the PC in an on-line manner.
Figure 3
Figure 3
(a) Numerical and (b) experimental results of the CartPole-v0 task. The result shows the total reward for each episode. The total reward of 200 indicates that the pole keeps upright over an episode. The black and red curves show the case with and without the input bias (b=0.8 and b=0.0), respectively.
Figure 4
Figure 4
(a) Numerical and (b) experimental results of the MountainCar-v0 task. The black curve represents the total reward for each episode. The moving average of the total reward is represented as the red curve. The average is calculated from the past 100 episodes. The total reward of -200 indicates that the car does not reach the top of the mountain. A larger value of the total reward indicates that the car reaches the top of the mountain at a smaller number of steps. (c) The total reward for each episode, where the reservoir weight at the 180th episode in (b) is used in experiment. The weight is not updated in (c). The blue dashed line corresponds to the total reward of -110 that indicates that the task is successfully solved.
Figure 5
Figure 5
(a) Maximum of the average total reward as a function of the input bias b. The red solid (with diamonds) and blue dashed (circles) curves represent the case with (κ=0.9) and without (κ=0) delayed feedback. The average total reward is calculated using a moving window from the past 100 episodes. The error bar represents the maximum and minimum values for 10 trials. (b) Maximum of the average total reward as a function of the feedback strength κ. The input bias is set to be b=0.9, 0.7, and 0.5 for the black solid (circles), red dashed (diamonds), and blue dotted (squares) curves, respectively. The plotted value is the maximum of the average total reward in 100 consecutive episodes. The error bar represents the maximum and minimum values for 10 trials.

Similar articles

Cited by

References

    1. Andrae A, Edler T. On global electricity usage of communication technology: trends to 2030. Challenges. 2015;6:117–157.
    1. Haghighat MH, Li J. Intrusion detection system using voting-based neural network. Tsinghua Sci. Technol. 2021;26:484–495.
    1. Zhang J, Xu Q. Attention-aware heterogeneous graph neural network. Big Data Min. Anal. 2021;4:233–241.
    1. Bie Y, Yang Y. A multitask multiview neural network for end-to-end aspect-based sentiment analysis. Big Data Min. Anal. 2021;4:195–207.
    1. Sutton RS, Barto AG. Reinforcement Learning: An Introduction. Cambridge: The MIT Press; 2018.